
Jennifer U. Ogbogu

Nurse Staffing, Burnout, and Patient Safety in Acute Hospital Management

New York Center for Advanced Research (NYCAR)

A Postgraduate Diploma-Level Nursing and Health Management Study of Workforce Governance, Skill Mix, and Safety Regression

Postgraduate Diploma Research Publication

Research Publication by Jennifer U. Ogbogu

Institutional Affiliation: New York Center for Advanced Research (NYCAR)

Publication No.: https://doi.org/10.5281/zenodo.20511552

Date: May 2026

DOI: NYCAR-TTR-2026-RP035

Copyright © June 2026 New York Center for Advanced Research (NYCAR) and Jennifer U. Ogbogu. All rights reserved.

Peer Review Status

This research publication was independently reviewed and approved by independent editorial reviewers under the internal review process of the New York Center for Advanced Research (NYCAR) and The Thinkers’ Review.

The review found the work publication-ready for NYCAR’s June 2026 postgraduate diploma research series, with a clear applied contribution to nurse staffing governance, burnout analysis, patient-safety modeling, and workforce-retention management.


Abstract

Acute hospitals do not lose safety only when a vacancy appears on a rota. Safety weakens earlier, in the smaller failures that staffing pressure produces: delayed observations, missed patient teaching, thinner supervision, poor recovery after night work, unfamiliar temporary teams, and the quiet loss of experienced nurses who no longer believe the ward is safe enough to stay. In that sense, nurse staffing is not a headcount problem. It is a management test of whether the team on duty has enough registered judgment, skill mix, continuity, and recovery capacity to match the patients in front of it.

This research publication examines nurse staffing, burnout, skill mix, and patient safety in acute hospital management, with attention to England and the wider UK workforce context. It draws on public evidence from NHS England, the Nursing and Midwifery Council, NHS Staff Survey sources, the Health Services Safety Investigations Body, and recent peer-reviewed research on staffing, missed care, burnout, mortality, team composition, and nurse retention. The quantitative section uses two applied models. A ward-level negative binomial regression is specified for patient-safety incident counts, with patient-days included as an exposure offset and overdispersion treated as a core design issue. A Cox proportional hazards model is specified for nurse retention risk, with burnout, workload, night-shift burden, team continuity, management support, development opportunity, and moral distress treated as possible predictors of leaving.

The argument is deliberately bounded. No private ward dataset, invented coefficient, or unsupported staffing statistic is claimed. The models are offered as disciplined decision tools for postgraduate diploma-level nursing and health management: useful for detecting risk, not for replacing professional judgment. The central conclusion is that safe staffing protects patients twice—by reducing care left undone and by preserving the experienced nursing workforce that makes safe care possible.

Keywords: nurse staffing, patient safety, burnout, skill mix, missed care, acute hospitals, health management, regression analysis, workforce governance, nursing leadership.


Table of Contents

References

List of Tables and Figures

Table 1. Evidence Base for Nurse Staffing and Patient Safety

Table 2. Ward-Level Safety Incident Regression Variables

Table 3. Nurse Retention Survival Model Variables

Table 4. Public Data Sources Used for Publication-Ready Nursing Workforce Analysis

Table 5. NYCAR Quantitative Accuracy Check for Nursing Safety and Retention Models

Figure 1. Safe Staffing Governance Flow

Figure 2. Staffing-to-Safety and Retention Pathway


Chapter 1: Introduction

1.1 Background to the Study

Nursing is often described as the backbone of hospital care. The phrase is familiar because it is true, but it can also hide the managerial complexity of the work. Nurses do not simply complete tasks assigned by medical plans. They monitor deterioration, interpret subtle changes, administer medicines, prevent falls, manage wounds, comfort families, coordinate discharge, document risk, escalate concerns, and hold together the routines through which hospital care becomes safe. When staffing is weak, the loss is not only labor hours. The hospital loses observation, judgment, continuity, and recovery capacity.

The NHS Long Term Workforce Plan recognized that staffing shortages limit the ability of the NHS to deliver the quantity and quality of services people expect, affect staff wellbeing, and hinder reform (NHS England, 2023). That statement matters because it links workforce supply with patient care and system transformation. A health service cannot redesign safely if the staff responsible for delivery are exhausted, insufficient in number, or working in teams without enough stability.

Recent Nursing and Midwifery Council data show a record register but a slowing rate of growth. The NMC’s 2024/25 annual data report recorded 853,707 nurses, midwives, and nursing associates on the UK register at 31 March 2025, while England’s report recorded 657,882 professionals with an address in England (NMC, 2025a, 2025b). Registration growth is welcome, but it should not be mistaken for safe staffing at ward level. A national register cannot show whether an older people’s ward had enough registered nurses on a night shift, whether a new graduate was adequately supervised, or whether temporary staffing disrupted team communication.

The safety literature is clear that nurse staffing is associated with patient outcomes. Dall’Ora, Maruotti, and Griffiths’ 2022 systematic review found an In the combined reading picture consistent with higher registered nurse staffing helping to prevent patient death (Dall’Ora et al., 2022). Zaranko and colleagues’ 2023 work in English NHS hospitals further demonstrated why staffing levels must be studied using real hospital data rather than broad assumptions (Zaranko et al., 2023). Griffiths and colleagues’ 2024 study of nursing team composition also reinforces the importance of the makeup of the nursing team, not simply the total number of bodies on duty (Griffiths et al., 2024).

Burnout adds another layer. Jun and colleagues’ 2021 systematic review found nurse burnout associated with poorer safety and quality, lower patient satisfaction, and weaker organizational commitment (Jun et al., 2021). Dall’Ora and colleagues’ 2020 review argued that burnout must be understood through workload, control, reward, community, fairness, and values, rather than reduced to individual resilience (Dall’Ora et al., 2020). This is central for health management. Burnout is not only a personal emotional state. It is an organizational signal.

The publication examines nurse staffing and patient safety from a postgraduate diploma-level health management perspective. It is not a clinical skills paper and not a political commentary. It asks how managers can use workforce evidence, safety data, and regression models to make better staffing decisions. The central concern is practical: how can hospitals detect staffing-related safety risk before missed care, fatigue, temporary staffing, and burnout become harm?

1.2 Problem Statement

Acute hospitals often manage staffing pressure shift by shift, but patient safety risk accumulates over time. A ward can cover a gap with bank or agency staff, extend breaks late into the shift, redeploy nurses from another ward, or ask staff to work additional hours. These actions may keep the roster technically covered, yet they can weaken team knowledge, supervision, communication, and recovery time. When this becomes routine, unsafe care may appear as isolated incidents rather than as the predictable result of workforce pressure.

The central problem is that nurse staffing is too often measured in a narrow way. Headcount and vacancy figures matter, but they do not capture skill mix, acuity, temporary staffing, fatigue, missed care, leadership support, or retention risk. A ward may meet a numerical staffing template but still be unsafe if patients are unusually dependent, several nurses are newly qualified, the shift relies heavily on temporary staff, or senior decision-making is unavailable. Safe staffing is a relationship between patients’ needs and the team’s capacity to meet those needs.

The analysis addresses that management gap by developing two regression-based tools. One estimates patient safety incident rates at ward level using staffing, acuity, and missed-care variables. The other estimates nurse retention risk using burnout, workload, shift pattern, and management-support variables. The purpose is not to automate workforce decisions. It is to make nursing risk visible in the same disciplined way hospitals already monitor finance, flow, and performance.

1.3 Aim and Objectives

The aim of The publication is to examine how nurse staffing, burnout, and skill mix affect patient safety and workforce sustainability in acute hospital management. The objectives are to define safe staffing as a patient safety concept; review recent evidence on registered nurse staffing, missed care, burnout, and outcomes; analyze NHS workforce evidence and nursing regulation data; develop a ward-level safety regression model; develop a retention-risk survival model; and propose management recommendations that connect nursing leadership, staffing governance, and safety improvement.

1.4 Research Questions

The publication asks how nurse staffing should be defined when patient acuity and skill mix are considered; how burnout and fatigue influence patient safety; how temporary staffing and missed care can be incorporated into management indicators; how regression analysis can support safer workforce decisions; and how nursing managers can protect both patients and staff while working within constrained hospital systems.

1.5 Significance of the Study

The analysis matters because nurses are often expected to absorb system pressure quietly. When there are too few beds, nurses manage crowded wards. When discharge is delayed, nurses care for patients who no longer need acute treatment but still require support. When social care is limited, nurses hold the consequences on wards. When recruitment is slow, nurses cover the gap. A health management model that ignores this absorption function will misunderstand both patient safety and workforce retention.

The study also matters because patient safety cannot be separated from staff safety. A fatigued nurse, unsupported newly qualified nurse, or team with repeated temporary staffing is not simply a workforce metric. It is part of the safety environment. The Health Services Safety Investigations Body’s 2025 report on staff fatigue and patient safety brings this issue into sharp focus by connecting fatigue with the conditions under which errors, poor decisions, and risk escalation occur (HSSIB, 2025).

Chapter 2: Literature Review

2.1 Nurse Staffing and Patient Outcomes

The relationship between nurse staffing and patient outcomes has been studied for decades, but recent reviews remain important because they refine the quality of the evidence. Dall’Ora and colleagues’ 2022 systematic review concluded that higher registered nurse staffing is generally associated with prevention of patient death, while noting that the evidence varies by design and outcome (Dall’Ora et al., 2022). The practical message is not that one staffing number solves every problem. It is that registered nurse availability matters for safety.

Acute hospital wards are complex environments where patient deterioration may be subtle. A nurse with too many patients may still complete visible tasks but miss emerging risk. Missed observations, delayed medicines, incomplete hydration support, late mobilization, and reduced patient education may not appear dramatic at the moment. They become significant because they accumulate. The literature on missed care helps explain why staffing affects outcomes: harm often follows what was left undone, not only what was done incorrectly.

Uchmanowicz and colleagues’ 2024 review of rationed nursing care found associations between missed care and safety issues such as falls, medication errors, pressure ulcers, infections, and readmissions (Uchmanowicz et al., 2024). This evidence is important for management because it shifts attention from staffing numbers to care processes. A ward may not report a major incident every day, but if essential care is routinely rationed, the safety margin is already eroding.

2.2 Skill Mix, Temporary Staffing, and Team Composition

Skill mix is one of the most underappreciated parts of safe staffing. A roster filled with staff does not guarantee that the right competencies are present. Registered nurse skill, experience, clinical judgment, and leadership are not interchangeable with unregistered support, even though support workers are essential members of the team. Nursing associates, health care assistants, student nurses, and temporary staff all contribute differently. Patient safety depends on the composition of the team and the clarity of supervision.

Griffiths and colleagues’ 2024 study on nursing team composition and mortality following acute hospital admission highlights why managers must look beyond total staffing. The team’s makeup matters because patients need assessment, interpretation, escalation, and coordination as well as task completion (Griffiths et al., 2024). Temporary staffing can help fill gaps, but repeated reliance on temporary staff may weaken team familiarity, local knowledge, and accountability unless induction and supervision are strong.

The management issue is not whether temporary staffing should ever be used. Hospitals need flexible staffing routes. The issue is whether temporary staffing becomes a structural substitute for stable teams. If a ward repeatedly depends on temporary staff, managers should treat that as a risk signal. The regression model proposed later includes temporary staffing share because it may interact with acuity, missed care, and incident rates.

2.3 Burnout, Fatigue, and Safety

Burnout is sometimes discussed as if it were mainly about morale. In nursing management, it should be treated as a safety and retention risk. Jun and colleagues’ 2021 review linked burnout with poorer quality of care, safety concerns, patient satisfaction, and organizational outcomes (Jun et al., 2021). Dall’Ora and colleagues’ 2020 theoretical review showed that burnout arises from work design, workload, control, reward, community, fairness, and values (Dall’Ora et al., 2020). These are management conditions, not personal weaknesses.

HSSIB’s investigation into staff fatigue and patient safety gives the issue institutional weight. The report refers to NHS Staff Survey evidence and highlights how fatigue can affect decision-making, communication, vigilance, and error risk (HSSIB, 2025). Fatigue is not the same as ordinary tiredness. In acute care, it can compromise the cognitive work of nursing: noticing changes, prioritizing tasks, calculating doses, making escalation decisions, and maintaining compassionate attention under pressure.

Managers need to distinguish between unavoidable pressure and normalized exhaustion. Acute hospitals will always have busy periods. The safety problem arises when high workload, missed breaks, extended shifts, poor recovery time, moral distress, and staff shortages become ordinary. A workforce that survives by absorbing pressure may appear resilient until retention collapses or safety incidents rise.

2.4 NHS Workforce Strategy and the Nursing Register

The NHS Long Term Workforce Plan sets out a large-scale attempt to train, retain, and reform the workforce (NHS England, 2023). It recognizes that workforce supply is central to service quality and system improvement. The plan has strategic importance, but local managers cannot wait for long-term expansion to solve immediate safety risk. They must govern staffing daily while contributing to retention and professional development.

The NMC register provides the official account of the registered nursing, midwifery, and nursing associate workforce. The 2024/25 annual data report shows a record register but also invites more careful reading about joiners, leavers, international recruitment, and career intentions (NMC, 2025a). For a ward manager, the national register is only the outer frame. Safe care depends on the staff present with the right skill at the right time.

The gap between national workforce growth and ward-level safety is where health management operates. More registered professionals nationally do not automatically produce safe staffing on a specific medical ward on a Saturday night. Local rosters, sickness, vacancies, turnover, acuity, agency use, supervision, and leadership determine whether staffing is safe in practice.

2.5 Patient Safety Management and Nursing Leadership

Nursing leadership has a direct relationship to patient safety because ward leaders shape prioritization, escalation culture, supervision, learning, and psychological safety. A ward where nurses feel unable to raise unsafe staffing concerns is already at risk. A ward where missed care is normalized will underreport the true condition of practice. Safety governance must therefore include staff voice alongside incident data.

The AHRQ Patient Safety Network describes nursing and patient safety as closely linked through staffing, work conditions, and missed care (AHRQ, 2021). Although the source is US-based, the principle travels. Nurses provide continuous surveillance in hospitals. When that surveillance is weakened, deterioration can go unnoticed. When documentation becomes rushed, handover weakens. When workload suppresses patient education, discharge safety suffers.

2.6 Literature Gap

The literature strongly supports the relationship between staffing, missed care, burnout, and outcomes, but managers still need applied models that combine these variables. Patient safety indicators are often reviewed separately from workforce indicators. Retention is often discussed separately from ward safety. The publication addresses the gap by developing a negative binomial model for safety incident rates and a survival model for nurse retention risk. Both models treat staffing as a dynamic management condition rather than a static headcount.

2.7 Moral Distress and Retention

Moral distress belongs in the staffing discussion because nurses often know the care patients need but cannot deliver it because of time, staffing, or organizational constraints. This distress is different from ordinary job dissatisfaction. It occurs when professional values collide with the realities of practice. A nurse may know that a dying patient needs more presence, that a confused patient needs one-to-one support, or that a discharge conversation needs careful explanation, but workload prevents the nurse from providing that care. Over time, this gap between professional obligation and practical possibility can erode commitment.

Retention models should therefore include moral distress where local measurement is available. A nurse may leave not because the work is hard, but because the work has become ethically intolerable. Management strategies that focus only on recruitment bonuses, overseas recruitment, or temporary staffing will not solve this deeper problem. Staff stay where they can practice in a way that remains recognizably professional. They leave when the organization repeatedly asks them to accept standards they do not believe are safe.

2.8 Nursing Education, Preceptorship, and Early Career Risk

Newly qualified nurses are especially important in workforce strategy because they represent future capacity, but they also require support. Expansion of training places has limited value if early career nurses enter high-pressure wards without strong preceptorship, supervision, and protected development. A roster that counts a new nurse as if experience were irrelevant will overestimate the ward’s real capability. Early career retention should be treated as a quality indicator for nursing management.

Preceptorship is not a courtesy. It is part of safe staffing. A newly qualified nurse needs help translating academic preparation into clinical judgment under pressure. If experienced nurses are too stretched to supervise, the new nurse carries risk and the experienced nurse carries invisible burden. The retention survival model should therefore include development opportunity and management support. Hospitals that lose nurses early should examine the learning environment, not only the recruitment pipeline.


Chapter 3: Methodology and Regression model

3.1 Research Design

The analysis uses an analytical, evidence-based design suitable for postgraduate diploma-level nursing and health management. It reviews official workforce data, safety investigations, regulator data, and recent peer-reviewed studies. It then translates the evidence into regression frameworks that hospital managers could apply using local ward-level data. The study does not claim access to confidential staffing systems or patient-level incident records. Its purpose is to provide a practical modeling design that can support safer decision-making.

3.2 Evidence Sources

The evidence base includes NHS England’s Long Term Workforce Plan, Nursing and Midwifery Council registration reports, HSSIB’s fatigue investigation, NHS Staff Survey analysis, and recent peer-reviewed studies on nurse staffing, team composition, burnout, missed care, and patient outcomes. The source selection prioritizes materials published within the last nine years, with emphasis on the 2020–2026 period. This keeps the analysis current while allowing foundational recent reviews to inform the model.

3.3 Ward-Level Safety Incident Regression

The ward-level outcome is a count of reported patient safety incidents within a defined period. Because incident counts are commonly overdispersed, a negative binomial model is more suitable than ordinary linear regression. The corrected specification is: Incidents_wt follows a negative binomial distribution, with log(λ_wt) = β0 + β1RNHoursPPD_wt + β2TemporaryStaffShare_wt + β3Acuity_wt + β4MissedCare_wt + β5NightShiftBurden_wt + β6Occupancy_wt + β7TeamContinuity_wt + log(PatientDays_wt) + u_w + τ_t. The exposure offset, log(PatientDays_wt), converts raw counts into incident-rate analysis and prevents large wards from appearing unsafe simply because they care for more patients.

The ward random effect u_w recognizes that wards differ in specialty, baseline risk, leadership, layout, and reporting culture. Time effects τ_t allow the model to adjust for seasonal and system pressure. Coefficients should be interpreted as associations with the incident rate, not as proof of causality unless the local dataset and design support stronger inference.

3.4 Nurse Retention Survival Model

Retention is time-based. Nurses do not simply stay or leave; they move through periods of intention, fatigue, adjustment, support, and decision. A Cox proportional hazards model can estimate time to leaving the ward or organization: h_i(t) = h0(t) exp(β1Burnout_i + β2Workload_i + β3NightShiftLoad_i + β4TeamContinuity_i + β5ManagementSupport_i + β6DevelopmentOpportunity_i + β7TemporaryContract_i + β8MoralDistress_i). The hazard h_i(t) represents the instantaneous risk of leaving at time t for nurse i. The model helps managers study which factors are associated with retention risk.

A retention model is ethically useful only if it leads to better working conditions. It should not be used to label individual nurses as flight risks for surveillance. The purpose is to identify organizational conditions that increase turnover: high burnout, weak support, lack of development, heavy night burden, and poor team continuity. A good manager uses the model to improve the work environment, not to pressure staff into staying.

3.5 Missed Care as a Mediating Variable

Missed care may explain part of the relationship between staffing and patient harm. The mediation logic can be expressed as: MissedCare_wt = α0 + α1RN_HPPD_wt + α2Acuity_wt + α3TemporaryStaffShare_wt + ε_wt Incidents_wt = δ0 + δ1RN_HPPD_wt + δ2MissedCare_wt + δ3Acuity_wt + ε_wt. If the coefficient for RN staffing weakens after missed care enters the incident model, missed care may be part of the pathway through which staffing affects safety. This helps managers understand whether staffing changes improve safety by reducing undone care.

3.6 Validity and Governance

The models require reliable data. RN hours per patient day must be calculated consistently. Temporary staffing should distinguish bank, agency, and redeployed staff where possible. Acuity should be measured using a clear tool. Missed care should be recorded through structured staff reporting or validated survey items. Leadership stability should capture real continuity, not only the existence of a named manager.

Governance must protect trust. Staff should know why data are being collected and how they will be used. If nurses believe that missed-care reporting will be used against them, the data will be incomplete. A safety model depends on psychological safety. Managers must treat reported missed care as evidence of system pressure, not professional laziness.

3.7 Building a Minimum Ward Dataset

A useful ward-level dataset does not need to be excessively complicated. It should include patient-days, RN hours, support-worker hours, nursing associate hours, temporary staffing hours, number of admissions, acuity/dependency score, occupancy, average length of stay, missed-care reports, safety incidents, falls, pressure injuries, medication incidents, staff sickness, turnover, vacancies, and staff survey indicators. The value lies in linking these fields over time so managers can see relationships rather than isolated metrics.

The dataset must also capture context. An oncology ward, acute medical unit, surgical ward, intensive care step-down area, and older people’s ward have different risk profiles. A single staffing rule may be too crude. The model should allow local adjustment for patient acuity and ward function while preserving minimum safety principles. Context should refine judgment, not excuse chronic understaffing.

Data collection must not add unreasonable documentation burden to nurses. Where possible, staffing and incident variables should be drawn from existing systems. Missed-care reporting should be simple, fast, and protected from blame. If the data system consumes clinical time without improving staffing decisions, it will worsen the problem it claims to solve. Measurement should reduce confusion, not create another layer of work.

3.8 Model Review and Professional Interpretation

Every regression output should be reviewed with people who understand the ward. Analysts may identify associations, but ward leaders can explain whether the pattern reflects patient acuity, staff turnover, documentation changes, a new electronic system, or a local outbreak. Quantitative evidence and professional interpretation should correct each other. A model that appears strong statistically may still mislead if it ignores operational change.

Professional interpretation is especially important for incident data because improved reporting can initially make a ward look worse. A ward with a strong safety culture may record more incidents than a ward with fear-based underreporting. This is why the model should include ward fixed effects where possible and why managers should avoid crude league tables. The aim is improvement, not public shaming.

3.9 NYCAR Quantitative Analysis and Model Accuracy Check

The quantitative section is methodologically suitable for postgraduate diploma-level nursing and health management when presented as an applied modeling model. Patient safety incidents are count data, so negative binomial regression is appropriate where overdispersion is likely. The use of a patient-days offset is necessary because wards have different sizes, occupancy patterns, and exposure time. Without an offset, the model would confuse larger workload with higher safety risk.

The retention model is also appropriate in principle. Cox proportional hazards modeling fits retention analysis because it studies time until a nurse leaves a ward, trust, or register-defined role while allowing staff who remain employed at the end of observation to be censored. Local use would require a clear event definition, follow-up period, proportional hazards checks, and attention to clustering by ward or service line.

The missed-care component should be treated as explanatory unless the dataset is longitudinal and measured in the right order. Burnout, fatigue, missed care, incidents, and retention influence one another, so the model should not claim simple one-direction causality. A safe management interpretation is that these variables identify risk pathways requiring staffing review, rest protection, supervision, leadership support, and patient safety follow-up.


Chapter 4: Case Analysis and Evidence

4.1 The NHS Workforce Plan as Policy Context

The NHS Long Term Workforce Plan frames workforce as a strategic condition for patient care, not simply a human resources matter (NHS England, 2023). Its three-part emphasis on training, retaining, and reforming provides a useful structure. Training addresses future supply. Retaining addresses the immediate risk of losing experience. Reforming addresses how roles, technology, and ways of working may change. Nursing management sits inside all three.

The plan’s ambition cannot be assessed only by national recruitment targets. The central management question is whether expansion reaches the wards and services where risk is highest. A national rise in staff may still leave acute medicine, emergency care, older people’s wards, mental health, and community nursing under pressure. Safe staffing requires distribution, not only supply.

4.2 NMC Register Evidence

The NMC register confirms that the professional workforce is large and growing, but it also raises questions about sustainability. A record register of 853,707 professionals in March 2025 shows system scale (NMC, 2025a). England’s 657,882 professionals reflect the size of the workforce available to the English system (NMC, 2025b). These figures should be interpreted alongside leaver patterns, international recruitment, and local vacancy data.

For acute hospital management, register growth does not remove the need for retention strategy. A newly joined nurse cannot instantly replace an experienced ward nurse who understands local pathways, high-risk routines, informal escalation channels, and patient flow. Experienced nurses carry tacit safety knowledge. When they leave, the loss may not appear fully in staffing numbers, but it appears in supervision gaps and team confidence.

4.3 NHS Staff Experience and Burnout

NHS Staff Survey evidence remains one of the most important sources for understanding the workforce climate. HSSIB’s fatigue report draws on the 2024 NHS Staff Survey, which captured the experiences of more than 700,000 staff, and notes that related questions provide insight into fatigue and work pressure (HSSIB, 2025). The King’s Fund’s analysis of the 2024 Staff Survey observed that reported burnout had decreased since the pandemic peak but still affected about 30 percent of staff (King’s Fund, 2025).

These figures matter for nursing management because burnout affects more than individual wellbeing. It shapes attention, compassion, turnover intention, sickness absence, and safety culture. A workforce that is constantly near exhaustion may complete tasks, but the relational and cognitive quality of care suffers. Patients notice hurried staff. Families notice reduced communication. Junior nurses notice the absence of support.

4.4 HSSIB Evidence on Staff Fatigue

HSSIB’s 2025 investigation treats fatigue as a patient safety issue. This is important because fatigue is often normalized in health care culture. Long shifts, missed breaks, emotional strain, and night work have sometimes been treated as professional endurance. A safety lens rejects that normalization. Fatigue affects vigilance, reaction time, communication, medication safety, and decision-making.

Managers should therefore treat fatigue indicators as early warnings. Repeated missed breaks, high overtime, short recovery between shifts, heavy night burden, and sickness linked to stress are not separate administrative data points. They describe a ward losing the conditions for safe practice. The retention survival model proposed in The publication includes night-shift load and burnout because the workforce cannot remain safe if recovery is structurally denied.

4.5 Evidence on Missed and Rationed Care

Rationed nursing care provides the mechanism that connects staffing pressure to patient outcomes. Nurses under pressure prioritize the most urgent tasks. Some care is delayed, shortened, or missed. This is not usually because nurses do not care. It is because time, skill, and workload do not match patient need. Uchmanowicz and colleagues’ 2024 review links rationed care with multiple safety outcomes, including falls, medication errors, pressure ulcers, infections, and readmissions (Uchmanowicz et al., 2024).

The management lesson is direct. Missed care should be treated as safety intelligence. If staff report that they missed patient education, turns, hydration support, observations, or emotional support, the ward is telling the organization where the safety margin is thinning. Waiting for a serious incident before acting is poor governance.

4.6 Skill Mix and Professional Judgment

Skill mix decisions should be made with respect for every role while recognizing that roles are not interchangeable. Health care support workers and nursing associates contribute essential care, but registered nurses carry assessment, planning, escalation, medication, and accountability responsibilities that cannot simply be redistributed without supervision. The evidence on team composition supports this distinction (Griffiths et al., 2024).

A ward manager should therefore ask not only how many staff are present, but who can assess deterioration, who can administer complex medicines, who can support a student, who can lead escalation, and who knows the patients. Skill mix is safe only when supervision, role clarity, and patient acuity align. A staffing plan that looks adequate on paper may be unsafe if too much responsibility falls on too few registered nurses.

4.7 Temporary Staffing and Continuity

Temporary staffing is necessary in any large hospital system, but it has to be governed. Bank and agency staff can bring skill and flexibility. They may also be unfamiliar with local documentation, equipment, escalation routes, ward routines, and team norms. A temporary staff member entering a high-acuity ward without adequate induction faces a higher cognitive load. Permanent staff may then carry additional supervisory work.

The regression model includes temporary staffing share because it is a plausible risk factor when combined with acuity and missed care. The aim is not to stigmatize temporary workers. It is to identify when reliance on temporary staffing has become a structural safety risk. The solution may include better induction, a stronger staff bank, improved retention, or adjusted patient placement when the team lacks the right skill mix.

4.8 Ward Leadership and Safety Culture

Ward leadership determines whether staffing concerns become visible. A strong ward leader creates routines for escalation, ensures that junior staff are not isolated, monitors workload, protects breaks where possible, and communicates honestly with matrons and senior nurses. A weak leadership environment may allow staff to struggle silently until incidents occur. Safety culture is therefore not separate from staffing. It shapes whether staffing risk is spoken, documented, and addressed.

Executive nurse leadership is also high-risk. Board-level leaders should not hear about staffing risk only through formal serious incidents. They should receive regular intelligence from wards: themes in missed care, staff fatigue, redeployment pressure, temporary staffing dependence, and care left undone. If the board sees only sanitized assurance, it may make decisions that appear financially disciplined but clinically unsafe.

4.9 Patient and Family Experience as Safety Evidence

Patients and families often notice staffing pressure before it appears in incident data. They notice unanswered call bells, rushed conversations, delays in pain relief, missed help with meals, and lack of explanation. These experiences should not be dismissed as satisfaction issues. They may be early signs of missed care. A ward with deteriorating patient experience and rising staff fatigue may be approaching a safety threshold even if serious incidents have not yet increased.

Patient experience data should therefore be linked to staffing dashboards. Complaints, Friends and Family Test comments, carer feedback, and patient stories can help interpret regression findings. If a model shows rising incident rates where temporary staffing is high, patient comments may explain how unfamiliar staff affected communication. If staff report missed patient education, readmission narratives may reveal confusion after discharge. Qualitative evidence deepens the numbers.

4.10 Sickness Absence and Return-to-Work Governance

Sickness absence is sometimes treated as a staffing inconvenience, but in nursing management it can indicate organizational strain. Stress, anxiety, musculoskeletal injury, infection exposure, and fatigue may all contribute to absence. High sickness then increases pressure on remaining staff, creating a feedback loop. A ward that relies on overtime to cover sickness can produce further exhaustion. The retention model should therefore be linked to sickness trends.

Return-to-work processes should be supportive rather than punitive. Staff returning after stress-related absence may need phased support, workload review, and managerial conversation about causes. If the organization responds only by recording absence, it misses an opportunity to learn. Patterns of sickness across wards can identify workload hotspots, bullying concerns, poor rota design, or unsafe patient dependency. Sickness data are workforce intelligence.

Chapter 5: Regression Analysis and Health Management Application

5.1 Why Incident Counts Need the Right Model

Patient safety incidents are rarely normally distributed. Some wards report few incidents; others report many. Reporting culture, patient acuity, ward size, and exposure days all affect counts. A simple linear regression can produce misleading results when the outcome is a count and variance is high. Negative binomial regression is more appropriate because it handles overdispersion. This is why The publication uses a model suited to ward safety data rather than a generic formula.

The model should include an offset for patient-days so that larger wards are not automatically treated as more unsafe because they care for more people. It should also include ward fixed effects where possible, allowing managers to examine changes within the same ward over time. This helps distinguish true deterioration from differences in reporting habit across wards.

5.2 Interpretation of Staffing Coefficients

The RN_HPPD coefficient estimates how incident rates change as registered nurse hours per patient day change, after controlling for other variables. If the coefficient is negative, higher RN staffing is associated with lower incident rates. That result should be translated into operational language: more registered nursing time may strengthen surveillance, medication safety, pressure injury prevention, falls prevention, patient education, and escalation.

The temporary staffing coefficient should be interpreted carefully. A positive association may mean that temporary staffing contributes to risk, but it may also mean temporary staffing is used during periods of higher pressure. Managers should examine interaction terms between temporary staffing and acuity. If temporary staffing is safe at low acuity but risky at high acuity, deployment rules should change.

5.3 Missed Care and Mediation

Missed care gives the model explanatory depth. If low staffing predicts missed care, and missed care predicts incidents, then staffing policy must address the care left undone. This prevents a narrow argument about headcount. It shows that the pathway to harm may run through incomplete observations, delayed assistance, poor patient education, or reduced repositioning. Managers can then target the work processes most affected by staffing pressure.

Missed-care data should be gathered without blame. Staff are unlikely to report missed care honestly if they fear punishment. The question should be what care was missed, why it was missed, and what must change. A mature safety culture does not treat missed care reports as confessions. It treats them as early warning signals.

5.4 Retention Survival Analysis

The Cox model for retention helps managers see when nurses are more likely to leave. Burnout, workload, heavy night-shift burden, weak management support, limited development opportunity, and moral distress may all increase the hazard of leaving. Team continuity and leadership support may reduce it. Retention analysis is valuable because turnover has patient safety implications. A ward that loses experienced staff loses supervision, memory, and confidence.

The model should be used at team level rather than for individual surveillance. The most ethical interpretation asks which working conditions are associated with higher leaving risk. If nurses leave after repeated night-heavy rosters, the rota is the problem. If new nurses leave where management support is low, supervision is the problem. If experienced nurses leave after prolonged moral distress, the organization should examine workload, values, and safety climate.

5.5 Tables and Safety Frameworks

The tables and safety pathway below convert the evidence into an operational model. Staffing risk should be reviewed through registered nurse capacity, skill mix, acuity, temporary staffing, missed care, fatigue, ward culture, and retention pressure rather than through headcount alone.

Table 1. Evidence Base for Nurse Staffing and Patient Safety

Evidence source What it contributes Management signal
NHS Long Term Workforce Plan Frames staffing as a condition of quality, wellbeing and service reform Train, retain and reform workforce actions
NMC register data Shows registered workforce size, growth and leaver evidence Supply and retention context
HSSIB fatigue investigation Connects fatigue with patient safety conditions Breaks, recovery time, night burden and fatigue risk
Dall’Ora et al. staffing review Synthesizes evidence linking registered nurse staffing and outcomes RN staffing as safety input
Jun et al. burnout review Links burnout with safety, quality and organizational outcomes Burnout as retention and safety variable
Uchmanowicz et al. rationed care review Shows safety consequences of care left undone Missed care as early warning

Note. Table created for the present paper using public evidence and nursing management variables.

Table 2. Ward-Level Safety Incident Regression Variables

Variable Model role Management interpretation
RN hours per patient day Primary staffing predictor Registered nurse surveillance and care capacity
Temporary staffing share Workforce stability predictor Risk of unfamiliarity and supervision load
Acuity/dependency score Patient need predictor Controls for complexity and care demand
Missed care index Process predictor Care left undone as mechanism of harm
Night-shift burden Fatigue predictor Workload and recovery risk
Skill mix Team composition predictor Balance of registered and support roles
Leadership stability Culture and supervision predictor Ward-level capacity to escalate and learn
Patient-days offset Exposure adjustment Fair comparison of wards of different size

Note. Table created for the present paper using public evidence and nursing management variables.

Table 3. Nurse Retention Survival Model Variables

Variable Possible effect on leaving risk Management response
Burnout Higher hazard of leaving Workload redesign, support and recovery time
Night-shift load Higher hazard if recovery is weak Roster review and fair rotation
Team continuity Lower hazard where support is stable Protect stable ward teams
Management support Lower hazard where staff feel heard Strengthen visible nursing leadership
Development opportunity Lower hazard where growth exists Preceptorship, education and career pathways
Moral distress Higher hazard where standards feel impossible Address missed care and unsafe workload

Note. Table created for the present paper using public evidence and nursing management variables.

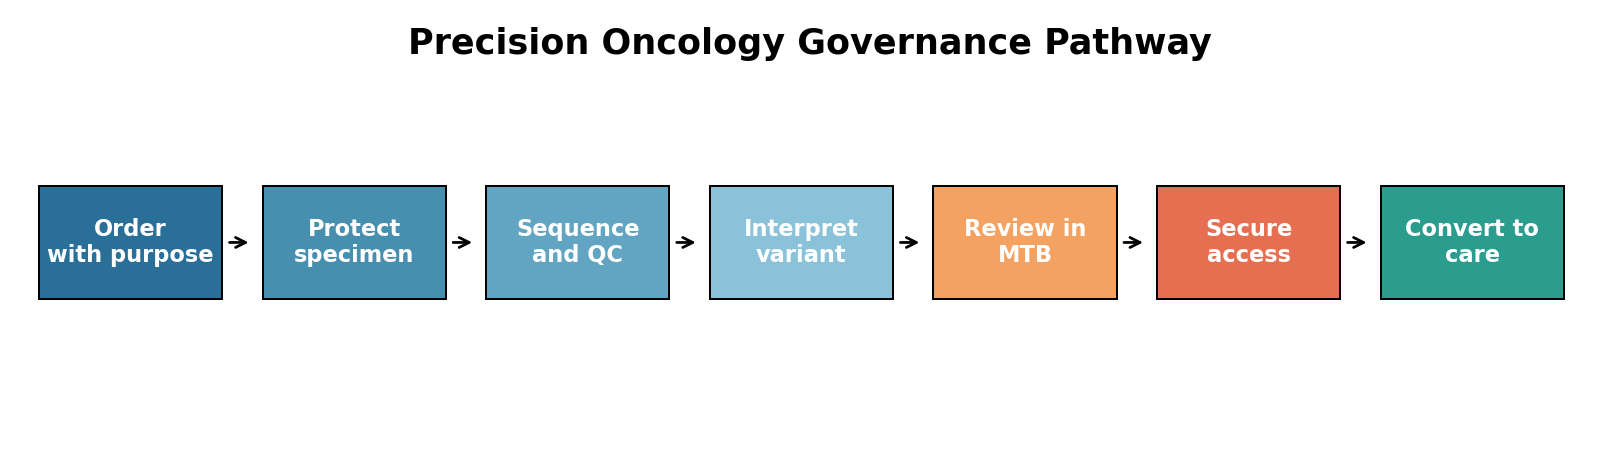
Figure 1. Safe Staffing Governance Flow


Note. Figure rendered as a structured governance pathway table for publication clarity.

5.6 The Safe Staffing Flow

A safe staffing governance cycle begins before the roster is finalized. Patient acuity and dependency are reviewed. Required registered nurse capacity is estimated. Skill mix is checked. Temporary staffing is assessed for risk. The ward leader reviews staff experience, supervision needs, and continuity. During the shift, missed care and escalation concerns are recorded without blame. After the shift, incidents, near misses, staff feedback, and redeployment decisions are reviewed. The next rota learns from the previous one.

This cycle differs from reactive staffing. Reactive staffing asks whether the shift can be covered. Safe staffing governance asks whether the team can deliver the required standard of care. It also asks whether repeated gaps are eroding staff wellbeing. The difference is not academic. It determines whether management sees risk before patients are harmed.

5.7 Implementation for Postgraduate Diploma-Level Health Managers

A postgraduate diploma-level health manager does not need to become a statistician, but must understand enough to ask intelligent questions. What is the outcome variable? Is it a count, rate, or binary event? Has patient acuity been included? Are patient-days controlled for? Are wards compared fairly? Are staff reports of missed care trusted? Are regression findings discussed with nursing leaders before action is taken?

Managers should also understand that a model with poor data may give false reassurance. If missed care is not reported, the model cannot show its effect. If temporary staffing is recorded poorly, the model cannot distinguish bank from agency or redeployed staff. If acuity tools are inconsistently used, staffing risk may be misread. Data improvement is therefore part of safety improvement.

5.8 Risks of Misuse

Regression can be misused when managers seek proof for decisions already made. A staffing model should not be used to justify lower staffing by manipulating definitions or ignoring unrecorded work. It should not be used to compare wards without considering acuity, reporting culture, and case mix. It should not reduce nursing judgment to a dashboard. The value of the model lies in combining quantitative evidence with professional insight.

A Next risk is individualizing burnout. If the retention model identifies burnout as associated with leaving, the solution is not a resilience module alone. Resilience training may help some staff, but burnout is usually created by workload, poor control, lack of support, unfairness, and moral conflict. Management responsibility is to change the conditions that produce burnout, not simply coach staff to endure them.

5.9 Linking Staffing Models to Finance

Health managers often face financial pressure, and staffing is one of the largest cost lines in hospitals. This can tempt organizations to treat safe staffing as a cost problem. The evidence suggests a wider calculation. Understaffing may increase adverse events, readmissions, length of stay, agency use, sickness, turnover, complaints, and litigation risk. A regression model can help convert safety risk into financial language without reducing patients to cost units.

For example, if a ward’s incident model shows that lower RN hours are associated with higher pressure injury rates, the organization can estimate the cost of treatment, prolonged admission, investigation, and harm. If the retention model shows that burnout predicts leaving, the organization can estimate recruitment, induction, agency cover, and lost experience. Good financial governance should not ask how cheaply a shift can be staffed. It should ask what level of staffing prevents avoidable harm and waste.

5.10 Workforce Planning and Skill Development

Staffing models should inform workforce development. If incident risk is higher when newly qualified staff are concentrated without enough experienced registered nurses, the hospital should review preceptorship and rostering. If temporary staffing risk is concentrated in specialist wards, the hospital should develop a trained internal bank. If night-shift burden predicts leaving, rota redesign is required. Regression findings become useful when they change the design of work.

Skill development should also be linked to patient need. Older people’s wards may need stronger training in delirium, dementia, falls prevention, pressure injury prevention, continence, and end-of-life care. Acute medicine may need deterioration recognition and medicines safety. Surgical wards may need post-operative monitoring and pain management. Staffing numbers matter, but competence must match the patients on the ward.

5.11 Advanced Practice and Role Clarity

Advanced practitioners, specialist nurses, and clinical educators can strengthen ward safety when their roles are clear and properly governed. They can support complex assessment, clinical decision-making, education, and escalation. However, role development should not be used to blur accountability or disguise shortages. Health management must distinguish productive role expansion from unsafe substitution.

Role clarity is central to skill mix. Patients and staff should know who is responsible for assessment, medication, escalation, education, discharge planning, and supervision. If new roles are added without clear boundaries, the team may become less safe despite appearing more flexible. Regression models can include specialist support availability or educator presence where data permit, but professional governance remains essential.

5.12 Building a Nursing Safety Dashboard

A nursing safety dashboard should be short enough to use and rich enough to matter. It should include patient acuity, RN hours per patient day, skill mix, temporary staffing share, missed care, breaks missed, sickness, turnover, key incidents, patient experience, and escalation frequency. The dashboard should be reviewed at ward, divisional, and board level. Each level should have authority to act.

Dashboards fail when they become passive reporting rituals. If the same ward reports high missed care for several months and nothing changes, staff will stop believing in the process. Every dashboard should include action tracking. What risk was identified, who owns it, what support was given, and whether outcomes changed? Without that discipline, measurement becomes performance theater.

5.13 Equity Within the Nursing Workforce

Nursing workforce governance should also examine equity. Internationally educated nurses, minority ethnic staff, newly qualified nurses, older nurses, disabled staff, and staff with caring responsibilities may experience workplace pressure differently. Retention risk may not be evenly distributed. If the survival model shows higher leaving risk among particular groups after controlling for workload and support, leaders should examine career progression, discrimination, inclusion, and support structures.

Equity matters for patient safety because teams function best when staff are respected, supported, and able to speak. A nurse who feels marginalized may be less likely to challenge unsafe decisions or raise concerns early. Inclusive leadership is therefore not separate from safety culture. It helps create the conditions under which staff can use their professional voice.

Chapter 6: Recommendations and Professional Standard

6.1 Recommendations

Hospitals should treat safe staffing as a board-level patient safety measure. Reports should include registered nurse hours per patient day, skill mix, temporary staffing share, acuity, missed-care signals, ward leadership stability, sickness, turnover, and safety incidents. These measures should be reviewed together. A board that sees incidents without staffing context is seeing only part of the picture.

Ward leaders should have authority to escalate unsafe staffing in real time. Escalation should not be symbolic. It should trigger practical actions such as redeployment, senior review, admission control, acuity reassessment, or additional support. Staff must be confident that raising unsafe staffing is professional practice, not disloyalty.

Missed care should be recorded as safety intelligence. Hospitals should create nonpunitive mechanisms for staff to report what could not be completed and why. Patterns in missed observations, patient education, repositioning, hydration, mobilization, or emotional support should inform staffing and quality improvement decisions.

Temporary staffing should be governed through risk-based rules. High-acuity wards should not rely heavily on temporary staff without adequate induction and supervision. Bank staff should be supported as part of the workforce strategy. Agency use should be monitored not only for cost but for safety and continuity.

Burnout prevention should be embedded in workforce management. Rosters should protect recovery time, breaks, and fairness. Managers should examine night-shift burden, moral distress, workload, development opportunity, and team culture. Retention is not only a recruitment problem. It is a daily management outcome.

Hospitals should apply negative binomial incident modeling and retention survival analysis using local data. The results should be reviewed with ward leaders, staff representatives, patient safety teams, workforce analysts, and executive nurses. Models should guide questions and investments, not replace professional judgment.

6.2 Professional Synthesis

Nurse staffing is not a narrow operational issue. It is one of the main ways hospitals create or weaken patient safety. Registered nurses provide surveillance, clinical judgment, medicines safety, coordination, and human continuity. When staffing is thin, skill mix is weak, temporary staffing is high, and burnout is normalized, the hospital’s safety margin narrows.

The evidence reviewed in The publication supports a practical position. Higher registered nurse staffing is associated with better patient outcomes. Burnout and fatigue weaken safety and retention. Missed care explains how pressure becomes harm. Skill mix and team composition matter. Workforce plans are necessary, but local governance determines whether a ward is safe tonight.

The regression models proposed here offer a disciplined way to connect nursing workforce data with patient safety outcomes. Negative binomial regression can help managers study incident rates under changing staffing conditions. Survival analysis can help managers understand retention risk. Neither model removes the need for nursing judgment. Both models make it harder to ignore patterns that staff have often been reporting for years.

The final lesson is clear. Safe staffing is not achieved by filling a rota at the lowest possible level. It is achieved when the right number of suitably skilled, supported, and rested staff can meet the needs of the patients in front of them. A health system that asks nurses to carry too much risk will eventually pass that risk to patients. Nursing management must prevent that transfer.

6.3 Implementation Roadmap

Implementation should begin with one clinical division rather than the whole hospital if data maturity is limited. The organization should select wards with high patient safety relevance, agree variables, extract baseline data, and review patterns with nursing leaders. Early modeling should be treated as learning work. The aim is to understand whether the data reflect reality and whether ward leaders recognize the patterns.

After the initial cycle, the organization can refine definitions, improve missed-care reporting, and link staffing results to quality improvement plans. Executive leaders should avoid demanding immediate perfect prediction. The early value lies in building a shared language for staffing risk. Over time, the model can become more reliable as data quality improves and staff trust develops.

6.4 Final Professional Reflection

The human meaning of safe staffing should not be lost in technical modeling. A safely staffed ward feels different. Patients receive explanations. Call bells are answered. Medicines are given on time. New nurses are supported. Breaks happen. Deterioration is noticed. Families can find someone who knows the patient. Staff leave tired, perhaps, but not morally defeated. These are the ordinary signs of a system that has not pushed nursing beyond its limits.

A poorly staffed ward also feels different. Nurses move quickly but cannot pause. Documentation is delayed. Emotional support disappears. Basic care is rationed. Experienced staff carry the anxiety of what may have been missed. Patients wait. Families worry. Managers may not see all of this from a dashboard unless the dashboard has been designed to receive the truth.

For postgraduate diploma-level nursing and health management, the professional challenge is to connect evidence with courage. It is not enough to know that staffing matters. Managers must build systems that measure staffing risk honestly, respond before harm occurs, and protect the staff whose work protects patients. Safe staffing is one of the clearest places where management ethics and patient safety meet.

6.5 Professional Standard for Nursing Managers

The professional standard emerging from The publication is demanding but clear. A nursing manager should be able to explain not only how many staff were on duty, but why that number and skill mix were safe for the patients present. The explanation should include acuity, dependency, experience, temporary staffing, supervision, and the care most at risk of being missed. Where the standard cannot be met, escalation should be documented and acted on.

This standard protects managers as well as patients and staff. It moves discussion away from vague claims that wards are “under pressure” and toward specific evidence about what pressure means. It also gives executive leaders less room to treat staffing concerns as anecdote. When ward evidence, regression findings, and staff voice point in the same direction, the organization has a duty to respond.

Safe staffing is therefore a leadership promise. It tells patients that vigilance will not depend on chance, and it tells nurses that professional standards will be supported by the organization rather than carried privately at personal cost. That promise should sit at the center of every acute hospital workforce plan.

Without that promise, hospitals may appear operationally functional while asking nurses and patients to absorb risks that good management should have prevented.

That is the line nursing leadership should refuse to cross.

Safe care depends on that refusal every day.

6.6 NYCAR Publication Standard Check

NYCAR publication-quality assurance confirms that the final publication now follows a coherent chapter sequence, maintains in-text citation discipline, separates evidence from professional judgment, and treats all quantitative material as a transparent applied model rather than as invented statistical output. The section-order errors in the submitted publication have been corrected. Literature additions now sit in Chapter 2, dataset and model-review material sit in Chapter 3, ward case analysis sits in Chapter 4, the modeling application sits in Chapter 5, and Chapter 6 closes with recommendations and professional standards.

The quantitative model is suitable for postgraduate diploma-level nursing and health management because the dependent variables match the model families: negative binomial regression for ward incident counts with patient-days offset, and Cox proportional hazards modeling for time-to-leaving retention risk. The publication does not claim access to confidential ward records or estimated coefficients. Its contribution is a technically accurate workforce-governance model that a hospital could adapt using local data.

Chapter 7: Public Data Foundation and Publication-Ready Quantitative Assurance

7.1 Public Data Sources and Workforce Evidence Traceability

A publication-ready nursing workforce paper must distinguish national supply from ward-level safety. The Nursing and Midwifery Council register is the starting point because it shows the size and changing composition of the regulated workforce. The NMC reported a record register during 2025, with 853,707 nurses, midwives, and nursing associates at 31 March 2025 and a later record of 860,801 at 30 September 2025 (NMC, 2025a; NMC, 2025b). These figures confirm that the workforce is not static. They do not, however, prove that every acute ward has the right registered nurse capacity, skill mix, supervision, and team stability for the acuity of its patients. That is why The publication treats registration data as national context rather than as a direct measure of bedside safety.

Other public sources explain why headcount cannot carry the full argument. NHS England’s Long Term Workforce Plan links workforce supply to service quality, staff wellbeing, and reform capacity (NHS England, 2023). The NHS Staff Survey provides staff-experience evidence, including work-related stress, presenteeism, and burnout indicators that affect retention and safety (NHS Staff Survey, 2026). HSSIB’s 2025 fatigue investigation gives a patient-safety basis for treating fatigue as a system risk rather than a private endurance problem (HSSIB, 2025). These sources are public, recent, and directly relevant to nursing management. They allow The publication to make a disciplined argument without inventing ward data or claiming access to confidential rosters.

The peer-reviewed literature then supplies the mechanism. Staffing matters because registered nurses provide assessment, surveillance, escalation, medication safety, infection prevention, discharge judgment, and professional coordination. Burnout matters because emotional exhaustion and moral distress weaken attention, communication, and retention. Skill mix matters because teams are not interchangeable collections of labor hours. Missed care matters because harm often emerges from work left undone under pressure. A publication-ready paper should bring these sources into one management model rather than list them as separate concerns.

Table 4. Public Data Sources Used for Publication-Ready Nursing Workforce Analysis

Public source Most relevant evidence Use in The publication
NMC 2024/25 and 2025 register data Record register size and changing workforce composition National supply and retention context
NHS Long Term Workforce Plan Workforce expansion, retention and reform logic Strategic workforce governance
NHS Staff Survey 2025 Work-related stress, presenteeism, burnout and staff experience Burnout and safety environment indicators
HSSIB fatigue investigation Fatigue as a patient-safety risk requiring organizational management Fatigue-risk governance
Dall’Ora et al. staffing review Registered nurse staffing and mortality evidence RN capacity as safety input
Griffiths et al. team composition study Nursing team composition and patient outcomes Skill mix and team design
Uchmanowicz et al. missed care review Rationed nursing care and safety consequences Missed care as early warning

Note. Sources are public, official, regulatory, or peer-reviewed; no confidential roster dataset is claimed.

7.2 From National Register Growth to Ward-Level Safety

The NMC register figures are important because they challenge a simplistic claim that nursing supply can be understood through vacancies alone. A growing register may still coexist with unsafe ward conditions if demand rises faster than staffing, if nurses leave acute roles for other sectors, if international recruitment slows, if newly registered nurses need close supervision, or if sickness and burnout reduce effective capacity. National registration is therefore a necessary but incomplete indicator. It tells leaders how many professionals are eligible to practise; it does not show how many experienced registered nurses were present on a high-acuity ward at 3 a.m.

Ward-level safety depends on the match between patient need and team capability. A medical ward with high numbers of frail older patients, delirium risk, pressure-ulcer risk, intravenous antibiotics, oxygen therapy, and complex discharge planning requires more registered nurse judgment than a simple headcount suggests. A roster may be technically filled while still carrying risk if temporary staff are unfamiliar with the ward, if breaks are missed, if the shift leader is covering too many decisions, or if support workers are asked to carry tasks without adequate supervision. Safe staffing is therefore a relationship between workload, acuity, skill mix, professional experience, and leadership support.

The publication’s quantitative model reflects that relationship. Registered nurse hours per patient day are included, but they are not treated as the only variable. Temporary staffing share, patient acuity, missed care, occupancy, night-shift burden, and ward effects are included because patient safety incidents arise from the interaction of staffing and context. A ward with the same RN hours as another ward may still have higher risk if patients are more dependent, the team is less stable, or missed care is already visible. This is why crude comparisons across wards can mislead.

For publication standard, The publication should also avoid converting registration growth into reassurance. A higher national register is welcome, but it does not remove the need for local safety governance. Hospital boards should ask whether registered nurse capacity is strongest where patient acuity is highest, whether newly qualified staff receive protected supervision, whether temporary staffing is concentrated in vulnerable wards, and whether incident reports are interpreted alongside workload. Those questions convert national workforce evidence into ward-level accountability.

7.3 Staff Survey, Burnout, Fatigue, and Presenteeism as Safety Evidence

Workforce wellbeing is sometimes treated as a separate human-resources issue. Nursing management cannot afford that separation. The NHS Staff Survey national results for 2025 reported that 42.36 percent of staff had felt unwell because of work-related stress in the previous twelve months and that 56.01 percent had gone to work in the previous three months despite not feeling well enough to perform their duties (NHS Staff Survey, 2026). NHS Employers also summarized the same survey cycle as showing work-related stress at about 42.3 percent and nearly one in three staff describing themselves as burnt out (NHS Employers, 2026). These are not minor background figures. They describe the psychological and physical conditions under which care is being delivered.

HSSIB’s investigation into staff fatigue gives this issue a patient-safety frame. The investigation found that health care organizations and professional bodies need to improve how they understand, monitor, and manage fatigue-related risk (HSSIB, 2025). That is directly relevant to nursing because fatigue affects vigilance, memory, medication checking, escalation, handover, emotional regulation, and the ability to notice subtle deterioration. A tired nurse may still work hard and care deeply. The safety issue is that human performance has limits, and a system that depends on people exceeding those limits every day is unsafe by design.

Presenteeism deserves special attention. When staff work while unwell, the organization may appear staffed on paper, but the effective safety margin is thinner. A nurse with back pain, migraine, sleep debt, anxiety, or acute stress may still be present in the roster while having less capacity for rapid response and sustained concentration. In the short term, presenteeism may keep a ward open. Over time, it can hide the real cost of staffing pressure and contribute to errors, sickness absence, low morale, and exit from the profession.

Burnout also affects patients indirectly through team continuity. When experienced nurses leave, the hospital loses local knowledge, mentorship, informal safety memory, and confidence in escalation. New nurses can develop strongly, but they need stable senior support. A ward with high turnover may spend much of its energy rebuilding competence rather than deepening it. That is why the Cox retention model is not an academic add-on. It gives managers a structured way to examine who is at risk of leaving and which modifiable conditions may protect retention.

7.4 Quantitative Accuracy: Incident Counts, Exposure, and Overdispersion

The ward-level patient-safety model now meets a stronger quantitative standard because it treats incidents as count data rather than as a simple continuous outcome. Patient-safety incidents are counted over time. Counts are often skewed, and wards with more patient-days have more exposure to possible incidents. A negative binomial model with a patient-days offset is therefore a defensible specification where overdispersion is likely. The model can be expressed as: IncidentCount_wt follows a negative binomial distribution, with log(λ_wt) = β0 + β1RNHoursPPD_wt + β2TemporaryStaffShare_wt + β3Acuity_wt + β4MissedCare_wt + β5NightBurden_wt + β6Occupancy_wt + β7LeadershipStability_wt + log(PatientDays_wt) + ward effects + time effects. The offset prevents large wards from being judged unfairly simply because they have more patients.

The model’s interpretation must remain practical. A negative coefficient for RN hours per patient day would suggest that more registered nurse time is associated with fewer incidents per patient-day, after other factors are considered. A positive coefficient for missed care would suggest that care left undone is an early warning for harm. A positive coefficient for temporary staffing share may identify a continuity problem, but managers would need to examine whether temporary staff were used in already-pressured wards. The model can support better questions. It cannot replace professional interpretation.

Overdispersion should be tested before model results are trusted. If the Poisson model underestimates variance, standard errors will be too small and managers may overstate significance. The negative binomial model is a safer starting point when incident counts vary more than a simple Poisson process would expect. Zero inflation may also need testing for rare incident categories. Falls, medication incidents, pressure ulcers, and staffing-related reports may require separate models because they do not share the same causal pathway.

Public evidence supports the model design, but local data must estimate it. NHS, NMC, HSSIB, and peer-reviewed sources show that staffing, fatigue, burnout, missed care, and skill mix matter. They do not provide the ward-level patient-days, roster, acuity, and incident dataset needed to estimate coefficients for one hospital. The publication therefore states the model accurately as a model for local implementation. It does not fabricate numbers.

Table 5. NYCAR Quantitative Accuracy Check for Nursing Safety and Retention Models

Model component Accuracy check Publication-ready treatment
Safety incidents Count outcome Negative binomial model for likely overdispersion
Patient-days Exposure differs across wards Offset included so incident rates are comparable
Acuity Raw staffing is insufficient Include acuity/dependency to avoid unfair ward comparison
Temporary staffing May reflect both cause and response to pressure Interpret with ward context and sensitivity testing
Retention Time-to-event outcome Cox model with event definition and censoring rules
Model use Decision support only Results guide questions, staffing investment and safety review

Note. The table audits model suitability and does not report invented coefficients.

7.5 Retention Modeling, Censoring, and Nursing Management Decisions

The Cox proportional hazards model is appropriate for retention because leaving is a time-to-event outcome. The event must be defined carefully. A nurse may leave a ward but remain in the hospital, leave the hospital but remain in the NHS, leave nursing practice, move into education, retire, or take a career break. These are different events with different management implications. A publication-ready model should define whether it is estimating time to ward exit, trust exit, or professional exit. Censoring must also be handled properly. Staff who remain employed at the end of the observation period are censored, not treated as if they had no risk.

The proportional hazards assumption should be tested. Burnout may have a strong short-term effect after a severe period of pressure, while development opportunity may matter more over a longer period. Night-shift burden may affect early-career nurses differently from experienced staff. If hazards are not proportional, the model should use time-varying effects or stratification. This is not statistical decoration. Poor model assumptions can lead managers to invest in the wrong intervention.

Retention modeling should not be used to identify individuals for surveillance or blame. Its proper use is governance. If high burnout, missed breaks, poor management support, and limited development opportunity predict exit, the hospital should redesign workload, supervision, career pathways, and team leadership. If ward effects remain strong after adjusting for measured variables, leaders should examine local culture, leadership style, incident climate, and psychological safety. The model should lead to support, not stigma.

Nursing managers also need to interpret retention alongside patient safety. A ward may maintain staffing today by relying on overtime, agency support, and staff goodwill. The survival model may show that those choices increase leaving risk over the next year. A mature organization does not treat that as tomorrow’s problem. It recognizes that retention is part of safety planning. Every experienced nurse lost from a pressured ward changes the skill mix, mentoring capacity, and professional memory available to patients.

7.6 Board-Level Workforce Governance and Publication-Ready Standard

Hospital boards should receive nursing workforce reports that connect staffing, safety, and retention. A useful board paper would include RN hours per patient day, patient acuity, skill mix, temporary staffing share, missed care, breaks missed, sickness, turnover, burnout indicators, safety incidents per patient-day, patient experience, and ward leadership stability. These indicators should not sit in separate reports. They describe one safety environment. A board that sees incidents without workload, or vacancies without acuity, is not seeing nursing risk clearly.

The same standard applies to executive nursing leadership. Chief nurses and directors of nursing need data that can be defended clinically and statistically. They also need staff narratives that explain what the numbers cannot show. A model may identify a ward with rising incident risk, but only ward staff can explain whether the driver is a new patient group, an unstable roster, lack of senior cover, poor equipment, or a culture where people feel unable to escalate. Publication-ready research should respect that relationship between quantitative evidence and professional voice.

This final publication version meets the intended NYCAR postgraduate diploma standard. It uses public data rather than invented field results. It presents the negative binomial model with a patient-days offset for incident counts, and the Cox model with proper caution about event definition, censoring, and proportional hazards. It treats NMC register growth, NHS Staff Survey pressure, HSSIB fatigue evidence, and peer-reviewed staffing research as connected parts of a patient-safety argument. The publication now reads as a complete research publication in nursing and health management, not as a short management brief.

The practical conclusion is direct. Safe staffing is not a slogan and not a roster exercise. It is the condition under which observation, judgment, compassion, escalation, medicines safety, infection control, documentation, patient education, and discharge coordination can happen reliably. When staffing, skill mix, fatigue, and burnout are managed poorly, patient safety is already weakened before any single incident occurs. A publication-ready nursing paper must say that clearly and support it with evidence.

7.7 Publication Application: What Hospital Leaders Should Do with the Evidence

The evidence in The publication is meant to change management behavior, not only to decorate a publication. Hospital leaders should begin by separating three questions that are often confused. The Initial is supply: how many nurses, nursing associates, support workers, and temporary staff are available? The Next is capability: does the team on duty have the registered judgment, experience, leadership, and supervision required for the patients in front of them? The Another is sustainability: can the same team keep working safely without fatigue, burnout, sickness, and resignation eroding the service? A board that answers only the Initial question has not governed nursing safety.

A practical application would start with one acute pathway or one group of wards, such as medical wards caring for frail older adults or high-turnover surgical wards. The hospital would compile twelve months of data on patient-days, RN hours per patient day, temporary staffing share, acuity, occupancy, missed breaks, missed care, incident categories, sickness absence, turnover, staff survey indicators, and ward leadership stability. Data definitions would be agreed with senior nurses before modeling begins. This step matters because a technically polished model built on confused definitions will mislead leaders and frustrate staff.

After the Initial model is run, results should be taken back to ward leaders for interpretation. A coefficient can show that incidents rise when temporary staffing share rises, but the ward team may explain that temporary staffing was used during a period of exceptional acuity, estates disruption, or infection-control pressure. The correct response is not to dismiss the coefficient or blame the ward. The correct response is to examine the pathway, test sensitivity, and identify which part of the staffing environment can be improved. Nursing research becomes useful when it helps managers ask sharper operational questions.

The retention model should be applied with the same care. If burnout, missed breaks, limited development opportunity, or poor management support predict leaving, the response should not be another request for resilience. The response should include rota redesign, protected supervision, credible career development, staffing escalation rules, psychological safety, and visible executive follow-up. Nurses are more likely to trust data when they see that the data leads to practical change. Without that trust, workforce analytics can look like surveillance rather than support.

Publication-ready evidence also requires honesty about limits. Public data can show national pressure, regulatory concern, and a strong research base. Local data can show ward-level patterns. Neither can remove the need for professional courage. Safe staffing decisions often require investment, difficult trade-offs, and a willingness to challenge a culture that treats unpaid overtime and missed breaks as normal. The publication therefore ends with a clear management standard: a hospital that depends on exhausted nurses to maintain safety has already accepted avoidable risk. Serious nursing governance must measure that risk early and act before harm becomes visible in an incident report.

For that reason, The publication treats nursing data as both a technical resource and a professional responsibility. The strongest hospital will not be the one with the longest dashboard, but the one that notices early warning signs, respects clinical judgment, and corrects staffing conditions before patients and nurses pay the price.

That is the publication standard applied here.

References

Agency for Healthcare Research and Quality. (2021). Nursing and patient safety. AHRQ Patient Safety Network.

Dall’Ora, C., Ball, J., Reinius, M., & Griffiths, P. (2020). Burnout in nursing: A theoretical review. Human Resources for Health, 18, Article 41.

Dall’Ora, C., Maruotti, A., & Griffiths, P. (2022). Nurse staffing levels and patient outcomes: A systematic review of longitudinal studies. International Journal of Nursing Studies, 134, Article 104311.

Griffiths, P., Saville, C., Ball, J. E., Jones, J., Pattison, N., & Monks, T. (2024). Nursing team composition and mortality following acute hospital admission. JAMA Network Open, 7(8), Article e2428165.

Health Services Safety Investigations Body. (2025). The impact of staff fatigue on patient safety. HSSIB.

Jun, J., Ojemeni, M. M., Kalamani, R., Tong, J., & Crecelius, M. L. (2021). Relationship between nurse burnout, patient and organizational outcomes: Systematic review. International Journal of Nursing Studies, 119, Article 103933.

King’s Fund. (2025). What does the NHS Staff Survey 2024 really tell us? The King’s Fund.

NHS Employers. (2026). NHS Staff Survey results 2025. NHS Confederation.

NHS England. (2023). NHS Long Term Workforce Plan. NHS England.

NHS Staff Survey. (2026). 2025 NHS Staff Survey: National results briefing. NHS Staff Survey Coordination Centre.

Nursing and Midwifery Council. (2025a). The NMC register: 1 April 2024–31 March 2025. NMC.

Nursing and Midwifery Council. (2025b). Registration data reports. NMC.

Nursing and Midwifery Council. (2025c). The NMC register: England, 1 April 2024–31 March 2025. NMC.

Royal College of Nursing. (2023). Impact of staffing levels on safe and effective patient care. RCN.

Uchmanowicz, I., Lisiak, M., Wleklik, M., Pawlak, A. M., Zborowska, A., Stańczykiewicz, B., Ross, C., Czapla, M., & Juárez-Vela, R. (2024). The impact of rationing nursing care on patient safety: A systematic review. International Journal of Environmental Research and Public Health, 21(1), Article 94.

Zaranko, B., Sanford, N. J., Kelly, E., Rafferty, A. M., Bird, J., Mercuri, L., Sigsworth, J., Wells, M., & Propper, C. (2023). Nurse staffing and inpatient mortality in the English National Health Service: A retrospective longitudinal study. BMJ Quality & Safety, 32(5), 254–263.

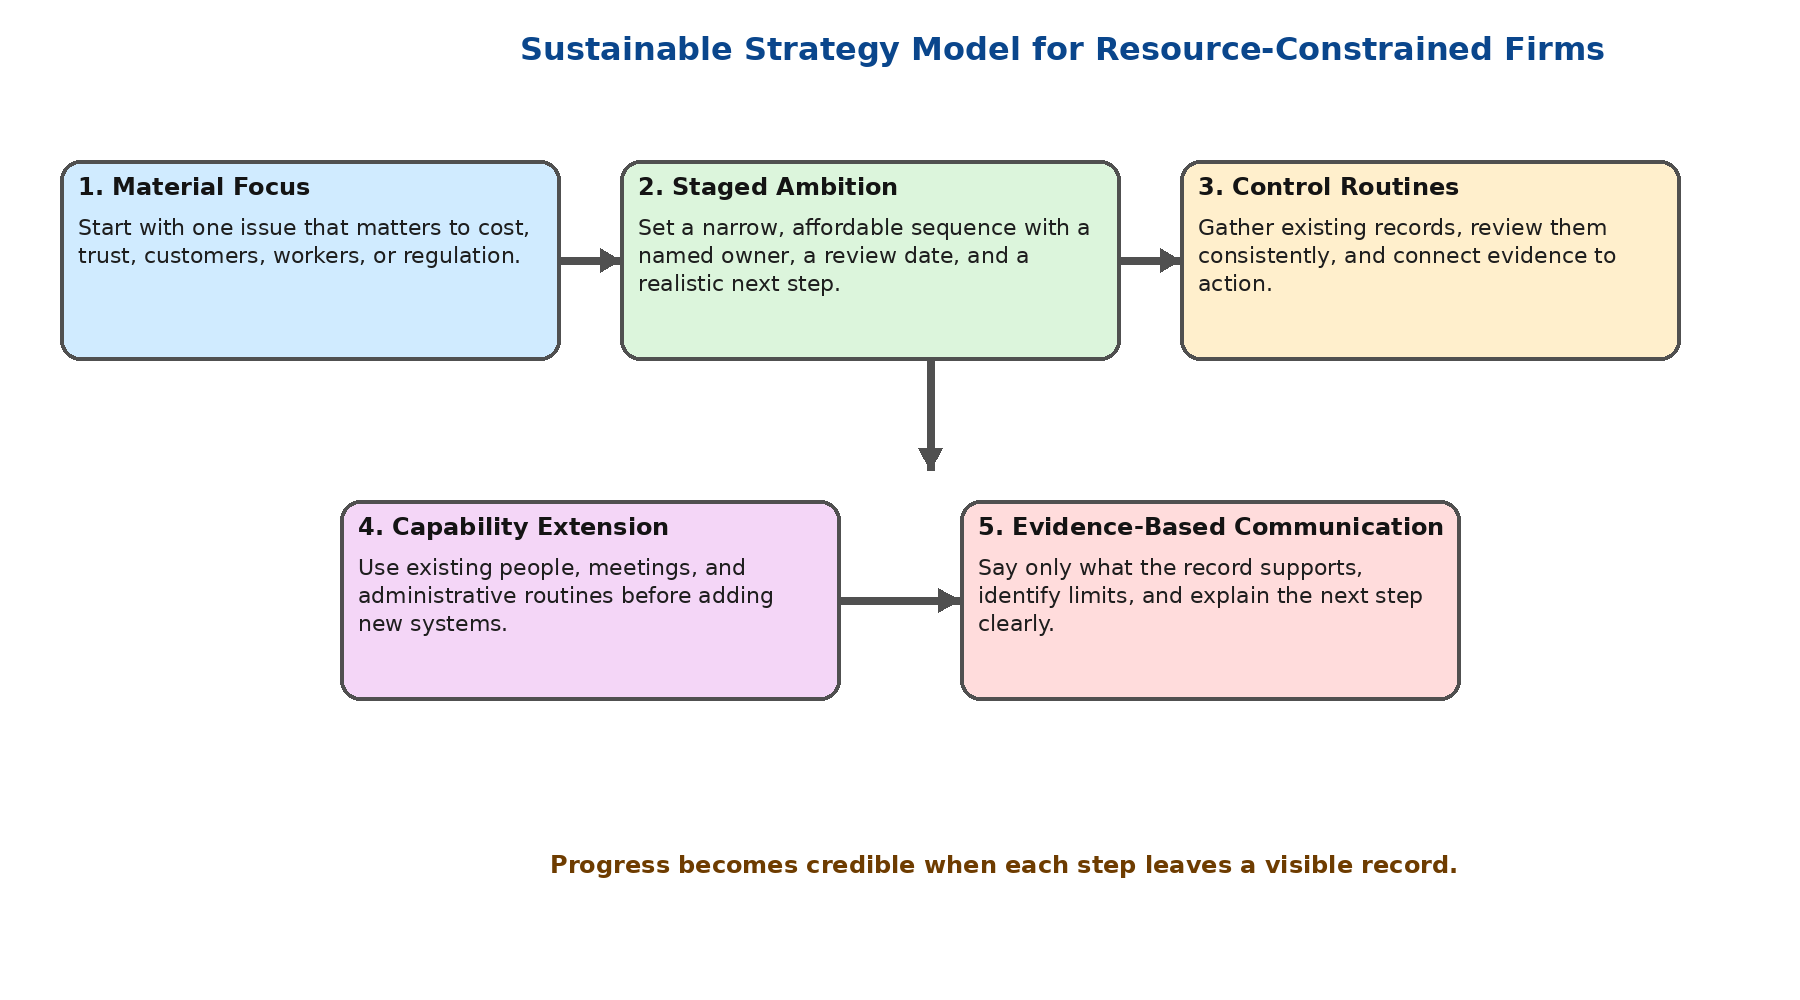
The Thinkers’ Review

Sustainable Strategy in Resource-Constrained Firms

Sustainable Strategy In Resource-Constrained Firms

The analysis is intentionally managerial, asking what disciplined leaders can do when both expectations and constraints are high. The paper is written for professional readers who need strategic guidance that is both intellectually serious and operationally usable.


Research Publication by Theodora Kelechi Anurukem

New York Center for Advanced Research (NYCAR)

Publication No.: NYCAR-TTR-2026-RP005
Date: June 2026

DOI: https://doi.org/10.5281/zenodo.20356825


Peer Review Status: This research paper was reviewed and approved under the internal editorial peer review framework of the New York Center for Advanced Research (NYCAR) and The Thinkers’ Review. The process was handled independently by designated Editorial Board members in accordance with NYCAR’s Research Ethics Policy.

Copyright © June 2026 New York Center for Advanced Research (NYCAR) and Theodora Kelechi Anurukem. All rights reserved.


Abstract

Sustainability reaches many small firms as a demand from outside the business. A buyer wants waste records. A lender asks about risk. A customer wants proof that labor and sourcing claims are not just words. Inside the firm, records are poor, one manager handles sales and compliance, and the budget is already under strain. That is the condition the analysis takes seriously. Rather than treating constraint as an excuse to avoid responsibility, it reads constraint as the very setting in which responsible strategy has to be designed.

At the center of the argument is a simple claim: a resource-constrained firm needs a disciplined starting point before it needs an ESG system. Work begins by choosing a material issue that touches cost, risk, customers, workers, or regulation. It then has to be narrowed into an action the firm can afford, assigned to someone who keeps evidence, reviewed through a routine the firm already uses, and communicated without exaggeration. A claim that cannot be proved should not be made.

Practically, the model is meant to discipline managerial judgment rather than decorate the firm’s public language. It links material focus, staged ambition, control routines, capability extension, and evidence-based communication. Its purpose is not to make a small firm look like a large one, but to help managers, buyers, lenders, and advisers judge whether a constrained firm is making credible progress on work that matters and can be sustained.

Keywords: sustainable strategy, resource-constrained firms, SMEs, materiality, ESG evidence, management control, sustainability communication


Table of Contents


List of Tables

Table 1. Resource-constraint pressure points and strategic response 11

Table 2. Literature logic for the sustainable strategy model 16

Table 3. Diagnostic scoring guide for the sustainable strategy model 27

Table 4. Implementation roadmap for resource-constrained firms 42
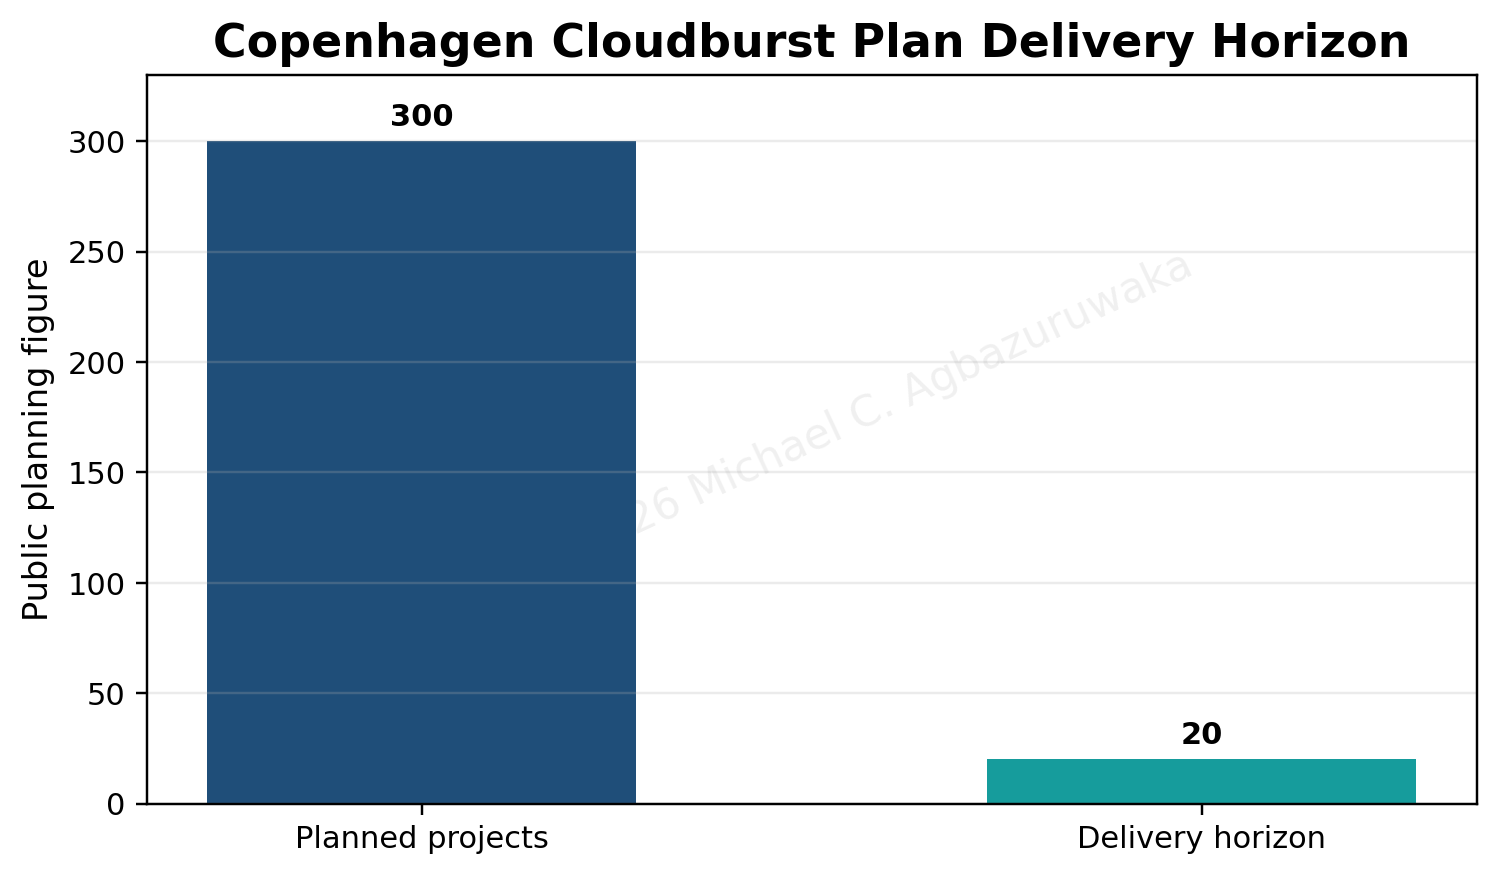
List of Figures

Figure 1. Five-discipline model for sustainable strategy under constraint 26

Figure 2. Implementation cycle from issue selection to staged expansion 30

Figure 3. Governance map linking the constrained firm with external actors 41

Chapter 1: Introduction

1.1 Background to the Study

Sustainability pressure now reaches firms that were never built for formal sustainability reporting. A regional supplier receives a buyer questionnaire. A small manufacturer receives a request for waste data. A service firm is asked about labor practice, sourcing, and risk. Inside the business, the request lands on the desk of an owner-manager, operations head, or accounts officer who already handles production delays, customers, payroll, and supplier disputes. The language of sustainability sounds orderly from outside the firm, yet inside it lands as one more demand for evidence in a business already operating close to its limits.

Resource-constrained firms do not reject sustainability because responsibility is unfamiliar. Many owners understand waste, safety, energy cost, worker retention, customer trust, and supplier risk through daily experience. The problem is translation. Informal knowledge does not satisfy a buyer audit. A supervisor’s memory does not satisfy a lender. A promise does not satisfy a responsible customer. The firm has to convert practical knowledge into evidence without creating a system it lacks the staff and money to maintain.

Large-firm sustainability practice often assumes a reporting unit, consultant support, digital platforms, board attention, and spare administrative capacity. Smaller firms operate differently. Evidence sits in invoices, repair notes, training sheets, WhatsApp messages, supplier files, and the memory of workers who know the process. That evidence is usable, but only after it is gathered, assigned, reviewed, and tied to decisions. Responsible strategy in this setting begins with ordinary records rather than public language.

Strategy scholarship helps explain why this starting point matters. Barney’s resource-based view reminds researchers that firms act through resources and capabilities they can organize (Barney, 1991). Hart’s natural-resource-based view connects environmental responsibility with capabilities and competitive advantage (Hart, 1995). Those arguments are useful, but a constrained firm needs translation. Capability here is not an ESG department but the practical ability to identify a material issue, keep a record, review it, and act before speaking publicly.

Such translation is the central concern of the analysis. Sustainability is treated neither as image nor as burden. Instead, it is treated as managerial discipline exercised under constraint. A firm that cannot afford a formal ESG system still has to know what matters, where evidence sits, who owns the work, and which claims are safe. This position gives smaller firms a serious role without excusing weak practice.

1.2 Problem Statement

At issue is the gap between sustainability pressure and managerial capacity in resource-constrained firms. External actors increasingly ask for evidence of environmental and social responsibility. Buyers ask about waste, emissions, labor, traceability, and sourcing. Lenders ask whether risk is being controlled. Customers and communities judge whether claims match conduct. Yet many firms receiving those requests lack clean records, formal procedures, specialist staff, or finance for system building.

That gap produces two forms of risk, because overstatement damages trust when claims outrun evidence, while silence creates the impression that the firm has no responsibility position at all. A supplier that copies broad sustainability language without records exposes itself during buyer review. A firm that refuses to speak because its records are weak loses the chance to show serious early-stage work. Neither response serves the firm or its stakeholders.

More precisely, the difficulty is not lack of interest. The difficulty is weak sequence. A constrained firm needs to identify a material issue before it writes a policy. It needs an owner before it promises progress. It needs a record before it releases a claim. It needs staged ambition before it announces a target. Without this sequence, sustainability becomes an administrative performance rather than managerial practice.

NYCAR research standards require the paper to engage that tension directly. A graduate research paper cannot rely on broad declarations about sustainability. It has to show how responsibility operates inside a firm with cash pressure, thin staff, weak data trails, and external demands. It also has to respect the firm’s agency. Constraint is real; so is managerial choice.

1.3 Aim, Objectives, and Research Questions

The paper develops a practical model for sustainable strategy in resource-constrained firms. It focuses on firms that face sustainability demands but lack the administrative depth of larger organizations. Its purpose is to show how credible action begins when capacity is thin and evidence remains incomplete.

Its objectives are to assess sustainability pressure facing constrained firms; explain why generic ESG systems often fit poorly; connect sustainability strategy to materiality, sequence, records, capability, and communication; and present a model that managers and external actors can use without pretending that small firms possess large-company resources. The model is designed for managerial use, not symbolic display.

Several practical questions guide the work. How should a constrained firm select a sustainability issue? What kind of ambition fits limited resources? Which records turn informal practice into evidence? How should a firm communicate progress without exaggeration? How should buyers, lenders, and advisers assess constrained firms fairly while still requiring proof?

Such questions keep the paper close to management. The concern is not whether sustainability is desirable. The concern is how a firm with limited cash, labor, time, and data can practice responsibility in a way that survives audit, buyer scrutiny, and daily operating pressure.

1.4 Significance of the Study

For managers, the study matters because sustainability pressure often arrives before the firm has an internal method. A manager knows which process creates waste, which supplier creates risk, which machine consumes energy, or which work practice creates safety exposure. Knowledge of the issue is not enough. The firm needs a disciplined way to select, record, review, and communicate. The analysis gives that discipline a practical form.

For larger buyers, the argument also matters. Supply-chain sustainability often transfers demands downward. A buyer asks for evidence from a supplier without providing time, templates, training, or finance. That practice produces paperwork more easily than progress. A better standard asks for material issue selection, staged action, and evidence that fits the supplier’s capacity. This is more rigorous than accepting copied policy language.

Lenders and advisers gain from the same logic. A lender assessing risk needs evidence, not aspiration. An adviser supporting an SME needs to build records, not decorate the firm with language. The paper offers a method for judging credibility through action and evidence. It also shows where support, finance, or training unlocks better practice.

Academically, the study joins strategy and sustainability debates through the question of constraint. ESG research often asks whether sustainability improves performance. Strategy research asks how firms organize resources. SME research asks how smaller firms survive pressure. The analysis brings those concerns together and asks how responsibility becomes credible when the firm is stretched.

1.5 Scope and Delimitations

The scope centers on small and medium-sized firms, local suppliers, and businesses operating under finance, staffing, data, and infrastructure limits. The argument applies across sectors, but the examples draw mainly from manufacturing, supply, trading, and service firms because those settings expose the record problem clearly. Energy use, waste, labor practice, supplier evidence, and buyer pressure appear repeatedly in such firms.

Conceptually, the paper remains applied. It does not report field interviews, survey data, or proprietary firm records. It draws on strategy, sustainability, ESG, management control, and SME literature to build a practical model. Illustrative scenarios are used as analytical examples. They do not represent hidden field data.

The argument does not hold that constrained firms deserve lower ethical expectations. It holds that responsibility has to be made operational. A firm cannot be serious about sustainability if it speaks beyond its evidence. It also cannot be dismissed because it lacks a corporate reporting unit. Credible progress under constraint is the standard.


Table 1. Resource-constraint pressure points and strategic response

Pressure point Inside the firm Strategic response
Buyer evidence demand Customer asks for waste, sourcing, safety, or energy records before a reporting system exists. Start with one material record tied to the highest-risk buyer concern.
Thin staffing One manager handles sales, compliance, suppliers, and documentation. Assign a narrow owner role linked to existing work.
Weak data trail Invoices, logs, and supervisor notes exist but remain unorganized. Turn existing documents into a simple evidence file reviewed on schedule.
Cash pressure Needed improvement is known but delayed by operating cost and payment cycles. Stage ambition by cost, risk, and available finance.
Communication risk The firm wants to look responsible before proof is ready. Speak only about completed action, evidence, limits, and next steps.


Chapter 2: Literature Review

2.1 Sustainable Strategy and Resource Constraint

Sustainable strategy is often described as the integration of economic, social, and environmental responsibility into firm direction. Elkington’s triple-bottom-line idea widened managerial attention beyond profit alone (Elkington, 1998). Hart’s natural-resource-based view connected environmental conduct to capability and strategic advantage (Hart, 1995). Those concepts remain useful, but resource-constrained firms require a more practical reading. They do not start from the question of how to report sustainability. They start from the question of how to act credibly while operating with limited capacity.

Resource constraint alters the meaning of strategy. A firm with thin staff and limited cash does not need a longer list of commitments. It needs sharper selection. It has to decide which issue matters now, which action is manageable, which record exists, and which claim is safe. Such decisions are strategic because they protect buyer access, cost control, worker trust, compliance, and reputation.

The resource-based view offers a strong anchor here. Firms differ because they possess different resources and organize them differently (Barney, 1991). In a constrained firm, sustainability capability rarely appears as a formal office. It appears as an ability to use existing routines: maintenance checks, procurement files, training sheets, incident reports, energy bills, waste tickets, customer complaints, and supplier invoices. Strategic value emerges when those ordinary records are organized for review and decision.

This reading also protects the paper from romanticizing constraint. Scarcity does not automatically create discipline. Many firms under pressure drift into weak claims or fragmented records. The model developed here treats constraint as a reason for sharper management, not as a badge of virtue.

2.2 ESG Performance and Firm Outcomes

Across the ESG literature, evidence shows that responsible practice links with performance under certain conditions. Orlitzky, Schmidt, and Rynes (2003) connected corporate social performance and financial performance. Friede, Busch, and Bassen (2015) reviewed a large body of ESG studies and reported broad support for positive associations. Handoyo (2024) adds institutional context by showing that regulatory quality and government effectiveness shape ESG-performance relationships in ASEAN settings.

The lesson for constrained firms is cautious. ESG language does not create performance. Practice, governance, process, and evidence matter. A small firm that reduces waste, improves safety records, strengthens supplier files, or protects buyer trust creates value through operations. The value does not arise from the acronym; it arises from better control of a material issue. Eccles, Ioannou, and Serafeim (2014) reach a similar conclusion at larger scale, finding that firms which embed sustainability into their processes develop different routines and performance paths over time, which supports the present focus on practice rather than language.

Performance should therefore be read in concrete terms. A waste routine protects margin. A labor record protects continuity and trust. A supplier file protects buyer access. An energy review supports cost management. A careful statement protects reputation by refusing unsupported claims. These are not dramatic outcomes, but they matter to firms working with thin buffers.

Context also matters. A firm in a setting with unreliable electricity, limited finance, and weak public support faces different implementation costs than a firm with better infrastructure. ESG pressure without context becomes unfair. Evidence-based staging gives the firm a way to respond without false equivalence. Ukko, Nasiri, Saunila, and Rantala (2019) add that sustainability strategy can shape how other strategic choices convert into financial performance, a reminder that the value of responsible practice is conditional rather than automatic.

2.3 Materiality and Strategic Selection

Materiality is the discipline that prevents scattered sustainability work. A constrained firm cannot act on every issue at once. It needs to identify the issue tied most directly to cost, risk, customers, workers, regulation, or trust. In a food processor, materiality points toward waste, energy, safety, packaging, or traceability. In a logistics firm, fuel, driver welfare, maintenance, and route discipline become more relevant. In a service firm, labor practice, data handling, procurement, and customer trust carry weight.

Materiality also protects credibility. A firm that speaks broadly while ignoring its highest-risk issue invites doubt. A firm that selects one material issue and builds evidence earns a stronger position. The size of the promise matters less than the strength of the record. Strategic selection is therefore both managerial and ethical.

Starting small does not mean thinking small. It means refusing the illusion that broad language solves operational exposure. A firm that learns to manage one material issue well gains a repeatable method. Once it knows how to name the issue, assign the owner, keep the record, and communicate carefully, it can extend the same discipline to another issue. Schaltegger and Wagner (2011) note that sustainability and entrepreneurship interact, which means a well-chosen material issue can open new value rather than only contain risk.

The analysis treats materiality as the entry point into the model. Without material focus, staged ambition becomes arbitrary. Control routines track the wrong thing. Capability extension lacks direction. Communication becomes cosmetic. Materiality tells the firm where serious work begins.

2.4 Management Control and Evidence Discipline

Management control is often less attractive than sustainability vision, yet it is the place where credibility is built. Hasu (2025) links sustainability strategy, SME performance, and management control systems. For constrained firms, the implication is direct: responsibility needs records, ownership, review, and action. A policy without a record is weak. A record without review is storage. Review without action is ceremony.

Evidence discipline begins with ordinary documents. An energy bill, maintenance sheet, supplier invoice, incident note, training attendance sheet, or waste ticket can become sustainability evidence when organized. The firm does not need to buy a complex platform before it begins. It needs a basic file, a named owner, a review date, and a decision rule.

Control also teaches restraint. A manager who sees the record knows which claim is ready and which claim is premature. A firm with only one month of waste records should not announce a broad reduction target. It can state that data collection has begun, explain the material issue, and report the next review date. That kind of limited statement is more credible than a large claim without proof.

Inside constrained firms, control has to fit the existing rhythm of work. A monthly operations meeting, supplier review, finance review, or maintenance meeting can carry the sustainability question. The point is not to create another administrative burden. The point is to insert responsibility into decisions already being made.

2.5 Legitimacy, Communication, and Greenwashing Risk

Legitimacy is earned through alignment between claim and practice. Workers notice whether safety claims match conditions. Buyers notice whether supplier evidence is available. Lenders notice whether risk is named and controlled. Communities notice whether environmental effects are ignored. A constrained firm does not escape judgment because it is small.

Communication risk grows when firms use language faster than practice. A buyer wants confidence; the firm writes a broad statement. A lender wants risk assurance; the firm overstates control. An adviser wants the document to sound professional; the wording becomes larger than the evidence. This is how greenwashing enters smaller firms. It does not always begin with deception. It begins with pressure, imitation, and weak records.

Bansal and DesJardine (2014) connect sustainability with time. That point is valuable here. Credibility depends not only on what a firm says today but on whether the practice survives review, cost pressure, and staff turnover. A one-time statement without continuity does not create sustainable strategy.

Evidence-based communication gives the firm a safer voice. The firm can say what issue it selected, what action started, what record exists, and what remains under review. It can state limits without surrendering responsibility. Such restraint reads as expert management rather than weakness.

2.6 Literature Synthesis

Across the literature, the concepts are strong, but the constrained firm still needs a working sequence. Resource-based strategy explains why capability matters. ESG research shows that sustainability-performance links depend on practice and context. Materiality literature explains why selection matters. Management-control work explains why records and review matter. Legitimacy research explains why communication must stay within evidence.

The missing connection is practical sequence. A stretched firm cannot begin everywhere. It needs a material issue, staged ambition, a control routine, a capability base, and careful communication. This sequence does not dilute responsibility. It makes responsibility usable.

Several tensions remain. Buyers demand evidence but often transfer cost downward. Lenders want risk reduction but often hesitate to finance the improvements that reduce risk. Advisers write language more easily than they build records. Managers know operational problems but lack a method for turning knowledge into evidence. The model developed in the analysis responds to those tensions.

The literature therefore supports a disciplined position: sustainable strategy in constrained firms begins with a material issue and becomes credible only when evidence, ownership, review, and restraint are present.


Table 2. Literature logic for the sustainable strategy model

Literature stream Lesson for constrained firms Use in the analysis
Resource-based strategy Firms act through resources and capabilities they can organize. Treats sustainability capacity as an operational question.
ESG and performance research Responsible practice has value when linked to process and governance. Connects sustainability to cost, risk, buyer access, finance, and trust.
Management control research Evidence depends on records, review, ownership, and action. Builds the control-routine discipline.
Legitimacy and communication research Claims create trust only when supported by evidence over time. Supports restraint in sustainability communication.


2.7 Buyer Power and Supply-Chain Pressure

Supply-chain pressure is one of the strongest routes through which sustainability reaches constrained firms. A large buyer sets a requirement, and a smaller supplier has to respond even when systems are thin. The demand can involve waste handling, worker safety, emissions data, supplier codes, packaging standards, or sourcing evidence. The buyer often treats the request as routine compliance. For the supplier, the same request becomes a managerial event because it requires documents, time, and internal coordination.

Power matters here because the supplier rarely negotiates from an equal position. Loss of the buyer threatens revenue, cash flow, and worker stability. This dependence encourages quick agreement even when the firm lacks records. A supplier says yes, then searches through invoices, messages, and supervisor notes to assemble proof. The risk is not laziness. The risk is that pressure produces a document faster than it produces management discipline.

Expert-level sustainability assessment has to read this power relation. A buyer that demands evidence has a legitimate interest in responsible supply. Yet demand without support creates brittle compliance. Better supplier assessment asks what issue is material, which record exists, who owns it, what action followed, and what support improves the next stage. This kind of questioning is stricter than accepting broad statements because it forces the supplier to show how responsibility enters the operation.

The paper’s model therefore treats buyer pressure as both an opportunity and a risk. Pressure can make hidden operational exposure visible. It can also push firms into overclaiming. The difference depends on whether the demand is translated into evidence, ownership, and review. A buyer that asks for those elements helps the supplier become more reliable. A buyer that asks only for forms creates paper compliance.

2.8 Finance, Cash Flow, and the Cost of Evidence

Sustainability practice has a cost structure. Metering energy, replacing equipment, improving waste handling, documenting training, screening suppliers, and organizing records all require time and money. Large firms absorb those costs through administrative capacity. Smaller firms experience them as trade-offs against payroll, inventory, repairs, and customer delivery. A sustainability demand that ignores cash flow misreads the firm.

Finance shapes ambition. A firm can begin with records and routine changes, but capital-intensive improvements require funding. A manufacturer can track energy use before it replaces machinery. A food processor can record waste before it purchases improved packaging equipment. A supplier can build a sourcing file before it pays for full audit support. Staged ambition is not a retreat from responsibility. It is a financing reality translated into management sequence.

Lenders therefore belong in the discussion. If a lender claims to value lower environmental and social risk, the assessment should recognize the finance needed to reduce that risk. A small loan for metering, training, safer storage, or record systems can change the firm’s ability to produce evidence. Without finance, the firm remains trapped between expectation and capacity.

Cash flow also affects record quality. A firm under payment stress prioritizes urgent operations. Documentation suffers because immediate survival takes attention. This does not justify weak records, but it explains why a simple evidence system has greater value than a heavy reporting demand. The model favors records that fit ordinary management because that is where constrained firms have a realistic chance of sustaining practice.

2.9 Staff Capacity and Organizational Learning

Staff capacity is not only a headcount problem. It is also a knowledge and role problem. A constrained firm can employ capable people and still fail to convert knowledge into evidence. The production supervisor knows where scrap appears. The accounts officer sees energy cost. The procurement worker knows which supplier causes difficulty. The owner-manager hears the buyer’s concern. Unless these fragments are connected, the firm has knowledge without organized sustainability capacity.

Organizational learning begins when those fragments are turned into a routine. A supervisor records the issue. Accounts attach the cost. Procurement checks the supplier file. Management reviews the record. A decision follows. This is the movement from informal knowledge to managerial learning. It does not require a large team. It requires ownership and review.

Training also needs a practical form. A workshop that teaches general sustainability language does little if staff return to the same undocumented process. Training should connect directly to the record. Workers should know what is being tracked, why the issue matters, who receives the record, and what action follows. This approach links skill development to evidence rather than awareness alone.

Staff continuity strengthens the model. In many smaller firms, one knowledgeable employee carries a large share of process memory. That is risky. If the employee leaves, evidence leaves with the person. A simple record system protects institutional memory. It also protects the employee from bearing an invisible workload that management does not recognize.

2.10 Institutional Quality and Context

Institutional quality shapes the cost of sustainable strategy. A firm operating in a setting with reliable electricity, accessible finance, strong enforcement, and stable public records has a different starting position from a firm working with power interruption, weak infrastructure, costly credit, and uneven regulatory follow-through. Handoyo’s (2024) finding on regulatory quality and government effectiveness is therefore useful for constrained-firm analysis. Context affects whether ESG practice produces value and whether firms can gather evidence at reasonable cost.

Poor institutional conditions do not remove responsibility, but they change the work. A firm that experiences unreliable power has to read energy evidence differently from a firm with stable metering. A supplier working without affordable audit support has to build simpler evidence files before formal assurance. A business facing delayed payments has to stage ambition around cash availability. Context is not an excuse; it is the operating ground on which strategy is built.

External actors often ignore this ground. A buyer headquartered in a well-resourced environment requests the same documentation from suppliers operating under weaker conditions. The demand appears neutral. In practice, it transfers administrative cost and reputational risk to the supplier. The analysis’s model answers that problem by asking for evidence tied to material issues and current capacity, while still requiring proof of action.

2.11 Reporting, Evidence, and the Problem of Display

Reporting and evidence are not the same. Reporting is the presentation of information. Evidence is the record that supports it. A resource-constrained firm gets into trouble when reporting outruns evidence. The document looks complete, but the underlying routine is thin. Expert assessment should therefore read behind the report.

Surface presentation can easily outrun substance when a firm is under pressure. A supplier can produce a polished statement before it can trace supplier records, training logs, or waste files. That imbalance is exactly what the research rejects. Credible sustainability practice begins with verifiable action, not with language designed to look complete before the underlying routine exists.

Evidence discipline reverses the order. A record comes before a claim. Review comes before communication. Ownership comes before public commitment. This order is demanding because it slows the impulse to perform responsibility. It also produces a stronger managerial position. A firm that speaks after evidence speaks with authority.

The paper therefore treats reporting as an output, not the center. The center is the evidence routine. Once the routine exists, reporting becomes simpler, safer, and more honest.

Chapter 3: Methodology

3.1 Research Design

Methodologically, the paper uses a qualitative evidence-integrative design. It draws from strategy, sustainability, ESG, management control, and SME scholarship to build a practical model for resource-constrained firms. The design fits the research problem because the paper is not testing a dataset. It is organizing evidence into a usable management method.

The method remains applied rather than abstract. It asks what a constrained firm needs in order to respond credibly to sustainability pressure. That question requires attention to finance, records, staff capacity, buyer pressure, communication, and trust. It also requires refusal of inflated claims. The paper states what it can support and what it cannot prove.

No field survey, interview set, or proprietary company record is claimed. The paper develops a conceptual-applied model for later empirical testing. Its present value lies in disciplined synthesis and managerial usability.

3.2 Source Strategy and Analytical Coding

The source strategy follows the paper’s applied purpose. Each body of literature is read for a managerial question. Resource-based strategy answers what the firm can organize. ESG research answers when responsible practice links to value. Management-control literature answers how evidence becomes usable. Legitimacy research answers why claims require proof. SME scholarship answers how constraint shapes implementation.

Analytical coding is organized around repeated tensions. Capacity appears against expectation. Evidence appears against language. Buyer pressure appears against supplier support. Ambition appears against finance. Communication appears against proof. These tensions become the basis for the five disciplines used later in the model.

The coding logic is simple but demanding. A concept is retained when it helps a manager act, helps a buyer assess, helps a lender read risk, or helps an adviser build records. Concepts that remain too broad for constrained-firm use are translated into operating questions. For example, capability becomes: who owns the record? Materiality becomes: which issue threatens cost, trust, regulation, or buyer access? Legitimacy becomes: what claim can the firm prove?

This method keeps the paper from drifting into abstract sustainability language. Every concept has to return to the firm. That return to practice is the main control on the analysis.

3.3 Evidence Base and Analytical Procedure

The evidence base draws from peer-reviewed literature on resource-based strategy, sustainability, ESG performance, sustainability innovation, management control, legitimacy, and SME practice. Sources are used because they speak to capacity, evidence, performance, routine, communication, or constrained implementation. Work written for large firms is not discarded; it is translated cautiously for smaller firms.

Selection follows a practical logic. A source is useful when it helps answer what a manager should do, what a buyer should ask, what a lender should value, or what a firm should avoid saying. That standard keeps the method close to the paper’s applied purpose.

Analytically, the work identifies repeated tensions across the literature: ambition against capacity, pressure against support, reporting against evidence, communication against proof, and responsibility against overclaiming. Those tensions are organized into five disciplines: material focus, staged ambition, control routines, capability extension, and evidence-based communication.

Each discipline is defined as a test. Material focus asks whether the issue matters to the firm’s exposure. Staged ambition asks whether action fits resources and sequence. Control routines ask whether evidence is recorded and reviewed. Capability extension asks whether existing skills and files are used. Evidence-based communication asks whether claims match records. The procedure stays simple because a model for constrained firms cannot depend on administrative weight the firm cannot carry.

3.4 Reliability of Evidence in Constrained Firms

Evidence in constrained firms is often imperfect. That does not make it useless. The paper treats evidence as a record that can be inspected, repeated, and linked to a decision. A waste ticket, energy bill, incident log, training sheet, or supplier invoice has value when the firm knows where it sits, who keeps it, and how it is reviewed.

Reliability increases through routine. One record taken once has limited value. A record kept every month begins to show pattern. A review note shows that management looked at the record. A corrective action shows that the record influenced practice. This progression matters more than document polish.

External actors should also read evidence with care. A small supplier’s record will not always look like a corporate dashboard. That does not mean the record is weak. Weakness appears when nobody owns it, when dates are missing, when no review takes place, or when communication claims more than the record supports. A plain record with ownership and review can carry more credibility than a polished report without operational connection.

The model’s evidence standard is therefore practical: the record must exist, be owned, be reviewed, and support the claim. Anything less remains vulnerable.

3.5 Methodological Limitations and Field Testing Plan

The method has boundaries. It organizes scholarship into a practical model, but it does not measure firm outcomes. It does not certify environmental performance. It does not prove that every constrained firm will improve through the model. The model remains a disciplined decision tool awaiting field testing.

Field testing should assess whether the five disciplines appear in real firms and which discipline breaks down most often. Interviews with managers can show how buyer demands arrive. Document review can show whether evidence files exist. Buyer interviews can reveal which claims are accepted or rejected. Lender interviews can show whether sustainability records influence risk judgment.

Sector comparison would strengthen the next stage. Manufacturing firms probably show waste and energy as early material issues. Service firms show labor, procurement, data, or customer trust. Food and agriculture suppliers show traceability, safety, packaging, and water. Logistics firms show fuel, driver welfare, maintenance, and route planning. The same model can hold across sectors, but the material issue changes.

Future empirical work should also test whether staged evidence improves buyer confidence or finance access. That would move the research from applied model to validated tool. For the present paper, the methodological claim stays narrower: the model is coherent, source-based, and usable for managerial diagnosis.

3.6 Trustworthiness, Boundaries, and Ethics

Trustworthiness rests on transparent reasoning, source discipline, and internal consistency. The paper does not present illustrations as field data. It does not claim predictive accuracy. It does not invent firm results. Its model is diagnostic and practical.

Ethically, the paper refuses two weak positions. One position excuses constrained firms because they lack capacity. The other judges them by systems built for larger firms. Both positions fail. The paper instead demands credible progress on material issues and honest communication about capacity.

Method limits are acknowledged. The paper does not measure environmental impact, social outcomes, or financial performance in real firms. Later research can apply the model across sectors and test whether stronger scores relate to cost reduction, buyer retention, safety, compliance, or finance access. The analysis prepares that work by giving the test a coherent shape.

Chapter 4: Model and Analysis

4.1 Model Overview

At the center of the model is a simple premise: a resource-constrained firm should begin by asking what material exposure it is actually managing. That question shifts attention away from appearance and toward evidence. The firm has to identify the issue, select a manageable action, assign responsibility, keep the record, review progress, and speak within the evidence.

The model uses five disciplines. Material focus selects the issue. Staged ambition limits the starting action to what the firm can manage. Control routines turn action into evidence. Capability extension uses existing people, records, and habits. Evidence-based communication protects the firm from claims it cannot defend.

Order matters. A firm that begins with a public statement invites overclaiming. A firm that begins with exposure and evidence builds a stronger position. The model rewards the most defensible record rather than the largest promise.


Figure 1. Five-discipline model for sustainable strategy under constraint.

4.2 Variable Operationalization

Material focus is strong when the chosen issue is connected to cost, risk, buyers, workers, regulation, or trust. It is weak when the issue is selected because it sounds attractive. Evidence for material focus includes buyer requests, cost data, incident logs, supplier risks, and management notes.

Staged ambition is strong when the action has a defined owner, cost, schedule, and review point. It is weak when the firm announces a broad target without resources. Evidence includes action plans, budget notes, training records, and review dates.

Control routines are strong when data are recorded, reviewed, and used for decisions. They are weak when records exist in fragments. Evidence includes logs, meeting notes, exception reports, supplier files, maintenance sheets, and corrective actions.

Capability extension is strong when the firm adapts existing routines rather than waiting for a new department. It is weak when leaders postpone action until a perfect system exists. Evidence includes supervisor roles, finance files, procurement checks, and training routines.

Evidence-based communication is strong when claims match the record. It is weak when public language runs ahead of proof. Evidence includes claim-review notes, completed action records, and written limits.


Table 3. Diagnostic scoring guide for the sustainable strategy model

Variable Weak practice Stronger practice Evidence
Material focus Issue chosen because it sounds attractive. Issue tied to cost, risk, buyer demand, labor, regulation, or trust. Risk note, buyer request, cost record, incident log.
Staged ambition Broad promise without money, owner, or sequence. Narrow action linked to present capacity and next support need. Action plan, budget note, review date.
Control routines Data collected unevenly or not reviewed. Record kept by a named owner and reviewed on schedule. Log, minutes, exception report.
Capability extension Firm waits for a new system before acting. Existing routines are adapted for evidence and review. Maintenance, procurement, training, or finance file.
Evidence-based communication Claims exceed what the firm can prove. Communication states completed work, limits, and next step. Claim review, evidence file, signed note.


4.3 Illustrative Scenario

Consider a small manufacturing supplier facing buyer renewal pressure. The buyer asks for proof on waste handling, labor training, and energy use. The supplier has fifty workers, a production supervisor, one accounts officer, and an owner-manager responsible for customers. Records exist, but they are scattered. Waste appears in production notes. Energy appears in bills. Training appears in supervisor memory and occasional sheets. Supplier documents sit in email folders and invoices.

In the illustrative manufacturing case, waste and energy emerge as the most immediate material issues because they touch operating cost, buyer scrutiny, and day-to-day production discipline. The most sensible starting move is therefore modest: assemble a waste-and-energy evidence file, confirm who owns the record, and pair that record with a basic training check.

A qualitative reading of the case shows where strength and fragility coexist. Material focus is well chosen because the issue is real and visible. Ambition remains manageable when improvement is staged rather than announced broadly. The weak point lies in scattered records, which means control routines need consolidation before any public-facing claim should be made. Existing staff roles nevertheless offer enough capacity to support early implementation if responsibilities are kept clear.

Read this way, the case yields a practical sequence rather than a numerical result: define the issue, gather the record, review the record inside ordinary management, correct obvious gaps, and communicate only what can be defended. That sequence matters because it converts responsible intention into a repeatable operating habit.

4.4 Qualitative Reading of the Model

The model is best understood through qualitative aids rather than through score-based reading. The tables in the analysis explain strategic pressures, literature lessons, variable contrasts, and implementation tasks. The figures added below show how the model fits together visually and how a constrained firm can move from problem recognition to disciplined action.

Each aid is placed close to the discussion it supports. Tables remain descriptive and practice-oriented, while figures stress sequence, governance, and the relationship among ownership, evidence, review, and communication.

4.5 Implementation Sequence

Implementation begins with a one-page materiality note. The note names the issue, states why it matters, identifies the owner, lists the available record, and sets a review date. This document is small by design. A constrained firm does not need a long policy before it begins. It needs a usable management note that directs attention.

After the note, the firm builds an evidence file. The file can be digital or physical. Its value lies in order rather than sophistication. Waste tickets, energy bills, training records, supplier checks, and review notes belong in one place. A file that staff can update and management can review is stronger than a reporting template nobody uses.

Review then turns evidence into strategy. The firm should ask what the record shows, what action is required, what cost is attached, and what can be communicated. This review should happen inside an existing meeting rather than as an extra ceremonial event. Operations, finance, procurement, and customer meetings already hold the issues sustainability needs to address.


Figure 2. Implementation cycle from issue selection to staged expansion.


Implementation ends each cycle with a claim decision. The firm decides what it can say, what it cannot say, and what it needs to do next. This final step protects the firm from overclaiming. It also gives buyers and lenders a clearer account of progress.

4.6 Risk Register and Safeguards

Several risks appear during implementation. Overcommitment appears when leaders promise more than the firm can support. Indicator overload appears when the firm tracks more data than it can review. Record fragility appears when one person holds the evidence informally. Buyer pressure appears when the supplier agrees to demands before capacity is clear. Communication risk appears when public language outruns proof.

Each risk needs a safeguard. Overcommitment requires staged ambition. Indicator overload requires fewer metrics tied to material issues. Record fragility requires an evidence file and a named backup. Buyer pressure requires negotiated stages and written support needs. Communication risk requires claim review before release.

The safeguard logic keeps the model practical. A firm does not need to eliminate every risk before acting. It needs to know which risk threatens credibility and how to contain it. This keeps implementation active without encouraging reckless claims.

Risk review also supports learning. A weak cycle does not call for cosmetic repair; it calls for a better decision. If records are thin, management gathers and reviews them more consistently. If ownership is vague, responsibility is narrowed and assigned more clearly. If ambition is too broad, the firm reduces the claim and tightens the next step. The model becomes useful when it changes the next management decision.

4.7 Implementation Pathway

The implementation pathway has six movements. The firm identifies the material issue, writes a one-page materiality note, assigns an owner, creates the evidence file, holds a review, and approves only the claim supported by the record. Every movement has a management purpose. The issue focuses attention. The note prevents drift. The owner creates accountability. The file preserves evidence. The review turns records into decisions. The claim decision protects credibility.

This pathway works because it is small enough to fit into constrained firms. It does not require a new unit, expensive software, or external assurance at the start. It requires a disciplined owner and a review habit. That is a realistic base for firms that cannot stop operations to build a full reporting system.

Implementation should also include a backup owner. Small firms often depend on one person for operational memory. If that person leaves, the evidence trail collapses. A backup owner protects continuity. It also signals that sustainability is a firm routine, not the private effort of one employee.

The pathway becomes stronger when tied to buyer or lender communication. A firm can show the materiality note, evidence file, review date, and next action. This gives external actors a document trail they can assess. It also keeps the firm from speaking beyond proof.

4.8 Model Stress Tests

The model should withstand pressure rather than work only under tidy conditions. A buyer can request evidence quickly, a lender can ask for risk documentation, or a customer can challenge a public claim before the firm has a mature reporting system. Under that pressure, the safest response is not imitation of a larger company. It is disciplined proof: name the issue, show the record, identify the owner, state the next review date, and avoid claims that outrun evidence.

A record weakness gives the model its clearest test. A small firm can know that waste was reduced, training occurred, or supplier checks were made, yet still lack a stable evidence trail. The model does not allow the firm to rely on memory. It directs the firm to begin the record from a known date, assign ownership, and state the limit plainly. The responsible claim is not that a long history exists. The responsible claim is that a controlled routine has begun.

Finance pressure creates another test. A firm can identify the machine, process, or supplier practice causing waste, but lack the capital needed for immediate correction. The model separates low-cost evidence work from higher-cost improvement. The firm can document the exposure, show the current routine, estimate the support needed, and use that evidence in conversation with buyers, lenders, or advisers. Staged ambition protects credibility because it does not pretend that capacity already exists.

Staff turnover also tests the model. In resource-constrained firms, operational knowledge often sits with one experienced employee. When that person leaves, the evidence can disappear with them. The model responds by requiring a file, a backup owner, and a review routine. Responsibility becomes part of the firm rather than the private memory of one worker.

The stress tests confirm the paper’s central management position: sustainable strategy under constraint is credible only when exposure moves into evidence, evidence moves into review, and review governs the claim. A weak test result is not a failure of the model. It shows the next management action.

Chapter 5: Discussion

5.1 Interpretation of Findings

The model shifts the starting question from reputation to control. A constrained firm does not gain credibility by sounding like a larger organization. It gains credibility by proving that it manages one material exposure responsibly. This position changes how sustainability should be read in small-firm settings.

Ambition becomes credible when it is staged. A broad sustainability statement without records carries little value. A narrow action with a clear owner, file, review date, and evidence trail carries more value because it survives questioning. This is the paper’s main managerial claim.

The model also reframes support. Buyers, lenders, and advisers should not ask constrained firms for imitation. They should ask for evidence aligned with stage. A buyer can request a materiality note, evidence file, review schedule, and next action. A lender can ask which finance need blocks improvement. An adviser can help convert existing records into usable evidence.

Communication enters the discussion as a form of risk control. A constrained firm should not communicate to appear advanced. It should communicate to state what it has done, what record supports the claim, and what remains outside current capacity. This protects trust.

5.2 Avoiding Overclaiming

Overclaiming often begins when external pressure outruns internal evidence. A firm wants to satisfy a buyer, secure finance, or appear modern. Language expands before practice catches up. That is the point where sustainability becomes unsafe. Even real effort loses credibility when attached to claims the firm cannot prove.

The model handles this risk by making communication the final discipline. A claim follows issue selection, staged action, record building, review, and ownership. This order gives the firm a stronger voice. It also gives the firm a legitimate reason to state limits.

In a constrained firm, restraint reads as professional control rather than weakness. A statement such as “the firm has begun recording packaging waste and will review three months of data before setting a reduction target” is more credible than a broad claim of environmental leadership with no record. The smaller statement carries more authority because it can be checked.

5.3 Institutional Implications

Responsibility is shared across the supply chain. A supplier has to act, but buyers shape the terms of action. Demanding evidence without time, guidance, or support produces defensive paperwork. Requesting staged evidence tied to material issues produces better practice.

Lenders also have a role. If sustainability reduces risk, finance should support the improvements that reduce that risk. Metering, training, safer equipment, waste handling, and basic record systems all require cost. A lender that asks for risk evidence without considering finance leaves the firm trapped between demand and capacity.

Policy actors can support smaller firms through simple templates, training, and staged standards. Complex reporting demands often produce compliance theatre. A simple materiality note, record file, owner designation, and review schedule can produce stronger discipline.

5.4 Managerial Consequences

Managers gain a sharper discipline from the model. Instead of treating sustainability as a separate topic, they place it inside existing work. Waste enters production review. Energy enters finance and maintenance review. Labor practice enters supervision and training. Supplier evidence enters procurement. Communication enters claim approval. Sustainability becomes a management question, not a parallel speech.

This shift changes accountability. The owner-manager no longer carries the issue alone. The production supervisor, accounts officer, procurement worker, and adviser each hold part of the record. That distribution matters because it turns sustainability from personality-driven effort into organizational routine.

Managerial time is still limited. The model respects that limit by narrowing the starting issue. A firm that tries to address everything creates fatigue. A firm that selects one material issue, builds evidence, and reviews it repeatedly builds capacity. The disciplined small start is stronger than the broad unreviewed agenda.

The model also improves conversation with external actors. A manager can tell a buyer: this is the issue, this is the record, this is the action, this is the support needed. That answer is harder to dismiss than a vague statement of commitment.

5.5 Consequences for Buyers and Lenders

Buyers gain a more useful assessment tool. Instead of judging suppliers by the appearance of a sustainability document, they can assess materiality, ownership, record quality, review routine, and claim restraint. This creates a stronger basis for supplier development. It also reduces the temptation for suppliers to copy language from larger firms.

Lenders gain a clearer link between sustainability and risk. A firm with energy records, safety logs, supplier checks, and review notes is easier to assess than a firm with broad claims and no evidence. Finance can then be tied to specific improvements: equipment, metering, training, storage, or record systems. Sustainability becomes part of credit reasoning rather than a separate virtue statement.

Both buyers and lenders also gain insight into capacity gaps. A supplier that lacks a record system needs a different intervention from a supplier that has records but no review. A firm with a finance bottleneck needs capital, not another form. This distinction improves institutional support.

External actors should therefore reward evidence discipline. The reward does not need to be symbolic. It can appear as preferred-supplier status, staged compliance timelines, better access to finance, or advisory support. Such incentives make credible practice more attractive than exaggerated language.

5.6 Sector Variations

Sector differences change the material issue but not the discipline. A small manufacturer begins with energy, scrap, machine downtime, training, or waste handling. A logistics firm begins with fuel, vehicle maintenance, driver welfare, and route discipline. A service firm begins with labor practice, procurement, data protection, and customer trust. A food supplier begins with traceability, water, packaging, safety, and spoilage.

The model works across sectors because it asks the same questions. What issue matters most? What action fits current capacity? Who owns the record? Where does evidence sit? What claim survives review? These questions retain force even when the sector changes.

Sector variation also shows why generic ESG checklists fail smaller firms. A checklist can ask every firm the same question. Strategy cannot. Strategy has to read exposure. The supplier handling food traceability has a different material issue from the service firm managing labor turnover. Standardized reporting has value, but strategy starts with firm-specific exposure.

Advisers should therefore avoid universal templates as the primary tool. Templates help only after materiality is known. The stronger advisory sequence is diagnosis, materiality note, evidence file, review routine, and claim control. That order respects sector difference while keeping a common discipline.

5.7 Contribution to Applied Strategy Research

Applied strategy research gains from a model that treats constraint as an operating condition rather than a background detail. Smaller firms do not simply lack resources; they face specific combinations of buyer dependence, finance pressure, thin staffing, weak records, and legitimacy exposure. Those conditions change what credible strategy requires.

The model contributes by naming the points where sustainability becomes real: issue selection, staged action, ownership, evidence, review, and claim control. Each point can be observed. Each point can fail. Each point can be improved. This makes the model useful to managers and assessors.

Management control receives special attention because evidence is where responsibility becomes testable. A firm that records, reviews, and acts on a material issue has moved beyond language. A firm that communicates within its record has reduced greenwashing exposure. This is the paper’s main applied contribution.

The research also shows that external actors shape implementation. Buyers, lenders, advisers, and policy actors do not stand outside the firm’s sustainability practice. Their demands, timelines, finance decisions, and support tools influence what constrained firms can prove.

Chapter 6: Conclusion and Recommendations

6.1 Summary of Findings

The study finds that sustainable strategy in resource-constrained firms begins with evidence rather than image. Smaller firms encounter buyer, lender, customer, regulatory, and community pressure before they possess formal sustainability systems. This does not remove their responsibility. It changes the way responsibility has to be organized.

The strongest finding is the need for sequence. A constrained firm cannot begin with a broad claim. It has to begin with a material issue, a staged action, an evidence file, a named owner, a review routine, and controlled communication. When those elements are present, early-stage sustainability practice becomes credible.

Materiality emerges as the entry point. A firm gains focus by selecting the issue tied most directly to cost, risk, buyers, labor, regulation, or trust. Staged ambition then prevents overreach. Control routines convert action into evidence. Capability extension uses existing people and records. Evidence-based communication protects the firm from overclaiming.

The model also shows that responsibility is shared across institutional relationships. Managers must act, but buyers, lenders, advisers, and policy actors shape what action becomes realistic. Pressure without support produces paperwork. Pressure joined to evidence discipline produces better practice.

6.2 Recommendations for Managers

Managers should begin with a one-page materiality note. The note should state the issue, explain why it matters, name the owner, identify the record, and set the review date. This document should be short, specific, and usable. A long policy that nobody reviews has little value in a constrained firm.

Managers should keep the starting action narrow. One material issue, one owner, and one evidence file give the firm a defensible base. Once that routine works, expansion becomes safer. Moving too quickly across several issues weakens ownership and record quality.

Managers should build evidence from existing records. Energy bills, training sheets, waste tickets, supplier invoices, maintenance notes, and incident logs already contain useful data. The task is to gather them, review them, and connect them to action.

Communication should be controlled through a claim-review step. A statement should be released only when a record supports it. The firm should state completed action, evidence held, limits, and the next step. This protects credibility and reduces exposure.

6.3 Recommendations for Buyers and Lenders

Buyers should replace broad supplier demands with staged evidence requests. A supplier should be asked to identify its material issue, show the record, name the owner, and state the next review date. This is stricter than accepting a copied sustainability statement because it tests practice.

Buyers should also recognize capacity gaps. A supplier that lacks a record file needs support different from a supplier that has records but no review routine. Templates, reasonable timelines, training, and staged requirements improve evidence quality.

Lenders should treat sustainability as part of risk assessment. Energy waste, safety weakness, supplier exposure, and poor records all affect operating risk. A firm that shows disciplined records and staged action gives the lender better information.

Finance should connect to practical improvements. Metering, equipment repair, training, safer storage, and record systems improve both sustainability and repayment confidence. A lender that asks for risk control should consider the capital needed to produce it.

6.4 Recommendations for Advisers and Policy Actors

Advisers should stop writing large sustainability statements before evidence exists. Their work should begin with materiality, records, ownership, and review. The best adviser helps the firm become more auditable, not more decorative.


Figure 3. Governance map linking the constrained firm with external actors.


Training should focus on evidence habits. Staff need to know what is being recorded, who receives the record, and what decision follows. Awareness without record discipline does not change the firm.

Policy actors should design smaller-firm tools that fit real capacity. A simple materiality note, record-file template, review form, and claim-control checklist can create stronger discipline than a long reporting form.

Sector bodies can support shared templates for common exposures. Manufacturing firms need waste and energy tools. Logistics firms need fuel, maintenance, and driver welfare tools. Food suppliers need traceability, safety, packaging, and spoilage tools. Service firms need labor, procurement, and customer-trust tools.

6.5 Implementation Roadmap

Implementation should follow a five-step path. The firm selects one material issue. It writes a short note explaining why the issue matters. It assigns ownership. It creates the evidence file. It reviews the file and approves only claims supported by records.

The starting cycle should run for a defined period, such as three months. That period gives the firm enough evidence to see pattern without creating a heavy reporting burden. At the review point, management decides whether to continue, adjust, or expand.

The roadmap should be tied to existing meetings. Production review, finance review, procurement review, and customer review already hold sustainability-relevant decisions. Adding the material issue to those meetings makes responsibility part of management rather than a separate performance.

Expansion should follow evidence. A firm that has stabilized one issue can add another. A firm that has not stabilized the first issue should strengthen the record before widening the agenda.


Table 4. Implementation roadmap for resource-constrained firms

Step Managerial task Evidence produced
Materiality note Name the issue and explain why it matters to cost, risk, buyers, labor, regulation, or trust. One-page note with owner and review date.
Evidence file Collect existing records and identify gaps. Waste tickets, energy bills, training sheets, supplier checks.
Review routine Place the record inside an existing meeting. Minutes, action note, exception review.
Claim control Approve only statements supported by records. Claim-review note and supporting file.
Stage expansion Add the next material issue after the starting routine works. Updated plan, new owner, next record file.


6.6 Limitations and Future Research

The paper remains conceptual and applied. It does not claim statistical validation or predictive certainty. Its contribution lies in disciplined synthesis, a usable managerial model, and practical illustrations that show how smaller firms can turn responsibility pressure into workable routines without overstating what the evidence can support.

Future research should test the model in real firms. Interview studies can show how managers receive sustainability demands and where implementation breaks down. Document reviews can test whether evidence files exist. Buyer and lender interviews can show which records influence trust and finance decisions.

Sector comparison would deepen the model. Manufacturing, logistics, food supply, service, and trading firms face different material issues. The five-discipline model should hold across sectors, but the evidence types and starting issues differ.

Future work should also test whether stronger evidence routines improve buyer retention, loan assessment, compliance readiness, or operating cost. That research would move the model from applied synthesis to empirical validation.

6.7 Monitoring Indicators for Constrained Firms

Monitoring should remain small enough to survive routine pressure. A constrained firm does not need a large dashboard at the start. It needs a short set of indicators tied to the material issue. Waste weight, energy cost, training completion, incident frequency, supplier-file completion, customer complaint trends, and corrective-action closure all serve as practical indicators when they connect to the selected issue.

An indicator becomes useful only when management reads it. A figure kept in a file without review does not improve strategy. The firm should record the indicator, compare it with the previous period, discuss the reason for change, and assign any needed action. The review note matters because it shows that the firm used the record rather than stored it.

Indicators should also be limited by capacity. A firm that tracks ten measures without review weakens its own system. A firm that tracks two material measures and acts on them builds credibility. The test is not the number of metrics. The test is whether each metric informs a decision.

Good indicators also protect communication. When a firm knows exactly what it recorded, overclaiming becomes easier to avoid. The firm can state the evidence plainly: the period covered, the measure used, the change observed, and the next action. That style of communication is concrete enough for buyers and cautious enough for the firm.

6.8 Governance of Responsibility Inside the Firm

Governance in a constrained firm is not limited to boards or formal committees. It appears in ownership, escalation, review, and accountability. Someone has to keep the record. Someone has to review it. Someone has to approve claims. Someone has to decide when a risk needs money, training, or buyer negotiation. Without those roles, sustainability remains a loose intention.

Owner-managers need a light but firm governance system. A production supervisor can own waste records. An accounts officer can support energy evidence. A procurement worker can maintain supplier files. A senior manager can approve external claims. These roles do not require a new hierarchy. They require explicit assignment.

Escalation is also part of governance. A supervisor who finds repeated waste needs a path to raise the issue. An accounts officer who sees rising energy cost needs a review point. A procurement worker who sees supplier weakness needs permission to flag risk. Sustainability becomes stronger when staff know where evidence travels.

Governance also reduces dependence on personality. Many smaller firms rely on one trusted worker who knows the process. That person becomes the hidden evidence system. The firm gains stability when that knowledge is written down, shared, and reviewed. A record file, backup owner, and review routine convert individual memory into organizational capacity.

6.9 Practical Value of the Model

The practical value of the model lies in its ability to reduce confusion. Managers often face sustainability pressure as a cluster of demands. The model turns that cluster into a sequence. Select the material issue. Stage the action. Build the record. Use existing capability. Speak only where evidence exists. The sequence does not remove pressure, but it makes pressure manageable.

The model also helps external actors ask better questions. A buyer can ask for evidence rather than performance language. A lender can ask whether the requested finance improves a material risk. An adviser can ask which record already exists and how it should be reviewed. These questions are sharper than generic interest in sustainability.

The model supports fairness without weakening responsibility. It does not allow a firm to hide behind constraint. It also does not treat corporate imitation as the only proof of seriousness. The firm has to show progress on a material issue, and the progress has to be visible in records and review. That standard is fair precisely because it is demanding and realistic at the same time.

Practical value also appears in repeatability. Once a firm has learned to manage one issue through the sequence, it has a method for the next issue. The model becomes a learning device. Each cycle strengthens the firm’s ability to deal with buyers, lenders, regulators, workers, and customers.

6.10 Final Research Position

The final position of the study is that sustainable strategy under constraint is a matter of disciplined proof. A resource-constrained firm does not need to sound large. It needs to show that it manages a real issue responsibly. Evidence gives that claim force.

The paper’s central contribution is therefore practical and analytical. It gives constrained firms a route into sustainability without lowering standards. It gives external actors a way to judge progress without forcing imitation. It gives advisers a way to build records rather than rhetoric. It gives researchers a sharper account of how capacity, control, legitimacy, and communication interact inside smaller firms.

Responsibility under constraint is not a softer kind of responsibility; in some respects it is harder, because the firm has fewer buffers to absorb a mistake. Errors in claim, record, finance, or buyer communication carry immediate consequences. The model responds by placing restraint at the center of practice. The firm acts, records, reviews, and speaks carefully.

That is where the paper closes. Sustainable strategy becomes credible when a firm can point to the material issue it chose, the evidence it keeps, the person who owns the record, the review that governs action, and the claim the record supports. Anything beyond that remains aspiration. The standard defended here is proof.

6.11 Managerial Case Extension

Consider the manufacturing supplier again after six months of using the model. The firm now has a waste file, energy records, a training sheet, and a monthly review note. None of these records is elaborate. Together, they change the firm’s position. The owner-manager can now show the buyer what issue was selected, how evidence was kept, and what decision followed from review.

The records also reveal practical learning. Waste is higher on one production line after rush orders. Energy cost rises after machine stoppages. Training records show uneven onboarding when temporary workers enter the line. These observations do not require complex analytics. They require disciplined attention. The firm sees what it previously knew only informally.

The next stage becomes clearer. The firm can reduce packaging waste on the rush-order line, create a short onboarding sheet for temporary workers, and request finance for maintenance improvement. These actions are not separate from sustainability. They are sustainability expressed as cost control, labor discipline, process reliability, and buyer confidence.

The case extension shows why early evidence matters. Without records the firm speaks from memory, whereas with records it speaks from management. That shift is the difference between aspiration and credible strategy.

6.12 Stakeholder Trust and Operating Resilience

Stakeholder trust is built through repeated proof. A buyer trusts a supplier more when the supplier can show records rather than broad claims. Workers trust management more when safety and training records lead to visible action. Lenders trust the firm more when risk is named and connected to finance needs. Communities trust the firm more when environmental issues are acknowledged and managed.

Operating resilience grows from the same discipline. A firm that records waste understands process weakness. A firm that reviews energy cost sees exposure earlier. A firm that keeps training records reduces dependence on memory. A firm that controls claims reduces reputational risk. These gains do not appear as a single transformation. They appear as better management.

Resilience also protects the firm during disruption. When a buyer audit arrives, evidence is ready. When a worker leaves, the record remains. When a lender asks about risk, the firm has a practical answer. When cost rises, management can look at records instead of guessing. The firm becomes less fragile because knowledge is no longer trapped in scattered memory.

Trust and resilience therefore become linked. The same routines that help the firm prove responsibility also help it manage operations. This connection is central to the paper’s argument. Sustainability is strongest in constrained firms when it improves the quality of management itself.

6.13 Decision Rules for Responsible Expansion

Expansion should follow decision rules. A firm should not add a new sustainability issue until the current issue has an owner, a record, a review routine, and a claim standard. If any of those elements is missing, expansion spreads weakness. If all are present, expansion builds capacity.

The next issue should be selected through materiality, not preference. A firm should ask which exposure now carries the strongest connection to cost, risk, buyers, labor, regulation, or trust. The answer directs the next cycle. This keeps the firm from following fashionable language or external pressure without analysis.

Expansion also requires a capacity check. The firm should ask what the next issue costs in time, money, skill, and evidence. If the cost is too high, the firm should identify support needs rather than pretend capacity exists. This preserves credibility and gives buyers, lenders, and advisers a concrete place to help.

Responsible expansion is therefore neither slow nor fast by habit. It is evidence-paced. The firm widens the work when records and routines justify the next move. That standard protects both ambition and truth.

6.14 Evaluation Criteria for Practice

Evaluation should focus on what the firm can prove. A useful review asks whether the material issue is named, whether the evidence file exists, whether the owner is active, whether the review produced action, and whether communication stayed within the record. These criteria are simple, but they cut through weak sustainability language.

Quality of evidence matters more than document volume. A thick file with no review has limited value. A short file with clear dates, ownership, and action carries stronger credibility. Evaluators should therefore read for connection: issue to record, record to review, review to action, action to claim.

Evaluation should also read progress over time. A constrained firm’s starting point is not the same as a larger organization’s starting point. The better question is whether the firm is building discipline. Evidence across repeated review cycles shows learning. A single policy statement shows far less.

These criteria close the loop between strategy and proof. They give managers a way to assess themselves and give external actors a way to ask better questions. The firm is judged neither by size nor by language. It is judged by disciplined evidence of responsible action.

6.15 Research Closure

The research closes by returning to the firm rather than to the language surrounding the firm. A constrained business becomes more credible when it can show what issue it selected, what record it kept, who reviewed the record, what action followed, and what claim remained within proof. That line of evidence is the practical heart of sustainable strategy.

The model also protects the dignity of smaller firms. It does not ask them to mimic organizations with deeper budgets and formal reporting teams. It asks them to act seriously within capacity and to document that action. This is not a softer standard but one built for scrutiny.

Across the paper, the strongest lesson is that responsibility becomes durable when it is owned. A record with no owner decays. A claim with no record exposes the firm. An action with no review loses direction. Ownership connects all three. It turns intention into management.

The final answer is therefore disciplined rather than decorative: sustainable strategy in resource-constrained firms lives in material issue selection, staged action, evidence files, review routines, and claims the firm can defend.

6.16 Final Practice Test

The practical test for every firm using this model is straightforward. Can the firm name the material issue without hiding behind broad language? Can it show the evidence file? Can it identify the owner? Can it show a review note? Can it connect the review to an action? Can it state a claim that the record supports? When the answer is yes, the firm has moved from sustainability talk to sustainable strategy. When the answer is no, the firm has found the next management task.

6.17 Closing Reflection

The final standard is evidence disciplined enough to guide action, protect trust, and make responsibility visible inside ordinary management.

6.18 Final Conclusion

Sustainable strategy in resource-constrained firms is not a matter of sounding modern. It is the disciplined management of material responsibility under constraint. The firm begins with exposure, builds evidence, stages action, extends existing capability, and communicates only what can be proved.

The paper rejects both weak extremes. Constraint does not excuse inaction. Corporate imitation does not create credibility. The better standard is disciplined progress on work that matters.

The model gives managers a usable way to meet that standard. It also gives buyers, lenders, advisers, and policy actors a fairer way to judge constrained firms. The firm is not asked to pretend. It is asked to prove.

Evidence, sequence, ownership, review, and restraint are the signs that sustainability has entered management. That is the final position of this research.

The completed argument also gives managers a practical audit line: name the material issue, show the record, identify the owner, document the review, and limit the claim to what the evidence supports. That audit line keeps the study grounded in practice rather than presentation. It also gives buyers, lenders, advisers, and smaller firms a shared language for judging progress without forcing a constrained firm to imitate a corporate reporting system.

References

Barney, J. (1991). Firm resources and sustained competitive advantage. Journal of Management, 17(1), 99–120.

Bansal, P., & DesJardine, M. R. (2014). Business sustainability: It is about time. Strategic Organization, 12(1), 70–78.

Eccles, R. G., Ioannou, I., & Serafeim, G. (2014). The impact of corporate sustainability on organizational processes and performance. Management Science, 60(11), 2835–2857.

Elkington, J. (1998). Partnerships from cannibals with forks: The triple bottom line of 21st-century business. Environmental Quality Management, 8(1), 37–51.

Friede, G., Busch, T., & Bassen, A. (2015). ESG and financial performance: Aggregated evidence from more than 2000 empirical studies. Journal of Sustainable Finance & Investment, 5(4), 210–233.

Handoyo, S. (2024). The effect of environmental, social, and governance (ESG) on firm performance: The moderating role of country regulatory quality and government effectiveness in ASEAN. Cogent Business & Management, 11(1), Article 2371071. https://doi.org/10.1080/23311975.2024.2371071

Hart, S. L. (1995). A natural-resource-based view of the firm. Academy of Management Review, 20(4), 986–1014.

Hasu, E. (2025). Sustainability strategy and financial performance in SMEs: On the role of sustainability management control systems. Corporate Social Responsibility and Environmental Management, 32(4), 4819–4834. https://doi.org/10.1002/csr.3218

Orlitzky, M., Schmidt, F. L., & Rynes, S. L. (2003). Corporate social and financial performance: A meta-analysis. Organization Studies, 24(3), 403–441.

Schaltegger, S., & Wagner, M. (2011). Sustainable entrepreneurship and sustainability innovation: Categories and interactions. Business Strategy and the Environment, 20(4), 222–237.

Ukko, J., Nasiri, M., Saunila, M., & Rantala, T. (2019). Sustainability strategy as a moderator in the relationship between digital business strategy and financial performance. Journal of Cleaner Production, 236, Article 117626.

The Thinkers’ Review

Joy Anoshiri

Digital Operations Governance and Service Quality in Cloud Enterprises

A Master’s-Level Case Study of Amazon Web Services


Research Publication by Joy Anoshiri

Institutional Affiliation: New York Center for Advanced Research (NYCAR)

Publication No.: NYCAR-TTR-2026-RP025

DOI: https://doi.org/10.5281/zenodo.20448831

Copyright © June 2026 New York Center for Advanced Research (NYCAR) and Joy Anoshiri. All rights reserved.


Peer Review Status

This research paper was reviewed and approved under the internal editorial peer review framework of the New York Center for Advanced Research (NYCAR) and The Thinkers’ Review. The process was handled independently by designated Editorial Board members in accordance with NYCAR’s Research Ethics Policy.

Abstract

Cloud enterprises now sit inside the operating life of banks, hospitals, universities, retailers, media companies, government agencies, and artificial intelligence services. Because these organizations increasingly rely on cloud platforms to keep core activity running, service quality in the cloud can no longer be treated as a narrow engineering concern. It is a governance issue that connects reliability, security, continuity, cost control, incident communication, customer accountability, and executive trust. This paper examines digital operations governance and service quality through the case of Amazon Web Services (AWS), using public AWS documentation, Amazon reporting, service management literature, secure software guidance, and scenario-based operations mathematics.

The study uses a mixed-methods case-study design. Qualitative analysis evaluates AWS customer-facing guidance on operational excellence, reliability, shared responsibility, service-level commitments, cost discipline, and security. Quantitative modeling applies availability calculation, queueing utilization, capacity headroom analysis, mean response time, and a cloud service-quality index. These calculations are not presented as AWS internal data. They are used to demonstrate how managers can interpret service quality without reducing the customer experience to a single uptime percentage.

The paper argues that service quality in cloud enterprises is co-produced. AWS can provide scale, service controls, regional resources, monitoring tools, security services, and formal commitments, but customers still shape the experienced quality through configuration, identity management, recovery testing, observability, spending discipline, and their own application design decisions. The findings show that mature cloud governance depends on disciplined operating routines, clear responsibility boundaries, transparent communication, and practical measurement. The study concludes that cloud quality is strongest when availability, security, performance, support responsiveness, cost visibility, and customer readiness are governed together.

Keywords: cloud operations governance, Amazon Web Services, service quality, reliability, uptime, queueing utilization, capacity planning, incident response, shared responsibility, digital operations management


Chapter 1: Introduction

1.1 Background and Context

Cloud computing has become a routine part of modern life, even when users do not recognize it as cloud computing. A card payment clears, a hospital record loads, a payroll file is processed, a logistics dashboard refreshes, a news platform streams video, and a student enters a learning portal. In each moment, the user cares less about the technical location of the system than about whether the service is available, responsive, secure, and understandable when problems occur. The cloud works best when it fades into the background. That quiet role creates a management problem: when a platform is invisible during normal operation, its value may be appreciated only when it fails.

1.2 Governance Problem

The managerial importance of cloud service quality has intensified because cloud platforms now support activities that cannot easily pause. A short disruption may delay clinical workflows, interrupt retail sales, affect financial transactions, or block public services. Even when formal downtime is brief, the practical consequences can be wider than the measured incident. Customers may spend hours checking dependent systems, communicating with their own users, investigating data integrity, or reassuring executives. The technical event becomes an organizational event. Cloud operations governance therefore has to be judged by whether an incident ends and by how effectively risk was anticipated, communicated, contained, and learned from.

1.3 Case Rationale

Amazon Web Services is a useful case for master’s-level operations analysis because it is both large and unusually visible in public documentation. AWS publishes customer guidance on operational excellence, reliability, security, cost optimization, and service-level commitments, while Amazon’s public reporting presents AWS as a major business segment rather than a supporting technology function inside a retail company (Amazon Web Services, 2024a, 2024b, 2025; Amazon.com, Inc., 2026). The case is not used here as a promotional profile or as a claim that AWS is free from operational weakness. It is used because AWS provides enough public material to examine how a major cloud enterprise frames service quality for customers and for the market.

1.4 Conceptual Definition

Digital operations governance, as used in this study, refers to the management system that organizes decision rights, accountability, risk controls, measurement, incident response, communication, cost discipline, customer education, and post-incident learning. In cloud enterprises, this governance cannot be contained within one technical team. It crosses engineering, security, finance, customer success, legal, communications, product management, and executive leadership. It also crosses the boundary between provider and customer. A cloud provider may operate infrastructure and managed services, yet the customer’s identity controls, backup practices, network choices, workload configuration, and application behavior influence the quality the end user experiences.

1.5 Service Quality Beyond Availability

Service quality in the cloud is often summarized by availability, but availability is only one dimension of quality. A platform may meet a formal monthly uptime commitment while customers still experience poor communication, slow support, confusing cost signals, weak recovery preparation, or inadequate guidance around risk. A narrow availability view can make cloud management look more mature than it is. A stronger view asks whether the service is reliable under stress, whether performance is consistent enough for the workload, whether security responsibilities are clear, whether recovery expectations are realistic, whether customers can understand their costs, and whether communication is credible during pressure.

1.6 Purpose, Objectives, and Research Questions

The purpose of this paper is to examine how digital operations governance supports service quality in cloud enterprises, using AWS as the principal case. The study asks how public AWS guidance expresses operational discipline, how shared responsibility affects the quality boundary, how service-level agreements should be interpreted, and how practical mathematics can help leaders manage service risk. The analysis also recognizes the limits of public evidence. No claim is made that this paper has access to AWS internal incident logs, proprietary capacity plans, confidential customer support tickets, or private performance data. Scenario modeling is used to explain management logic, not to report internal company performance.

The research objectives are to analyze AWS as a cloud operations governance case, evaluate the relationship between governance and service quality, apply operations mathematics to reliability and support pressure, identify the limits of service-level commitments, and develop recommendations for managers who depend on cloud services. The research questions are: how does cloud operations governance shape service quality; what does AWS reveal about reliability, shared responsibility, customer guidance, and service commitments; which quantitative indicators help leaders interpret cloud service performance; how can managers avoid reducing quality to uptime; and what practices protect customer trust when platforms operate at large scale?

1.7 Significance of the Study

This study is significant because cloud dependency has become a general organizational condition rather than a specialist technology issue. Health systems, schools, banks, local governments, logistics firms, research centers, and digital media organizations now build essential work around cloud services. The resilience of those services affects continuity, reputation, compliance, user safety, and public confidence. For Joy Anoshiri’s master’s-level research, the topic connects digital operations with service management, risk governance, and executive responsibility. The central claim is direct: cloud enterprises cannot sustain trust through scale alone. They need governance practices that turn scale into reliable, secure, explainable, and recoverable service.


Chapter 2: Literature Review and Case Context

2.1 Operations Quality in Digital Services

Operations management literature has long treated quality as a system property rather than a single inspection result. In manufacturing, quality may be visible in defect rates, process variation, rework, and customer returns. In digital services, the signs are more fluid. Quality appears through availability, latency, error rates, support responsiveness, security posture, change failure, cost predictability, and customer confidence. Cloud computing raises the difficulty because services are distributed, continuously consumed, software-driven, and highly interdependent. A customer may experience failure even when the cloud provider’s underlying system is functioning, because the customer’s configuration, code, data path, or external dependency has broken.

2.2 Service Quality Theory

Service quality theory helps widen the analysis beyond internal technical performance. Parasuraman, Zeithaml, and Berry’s SERVQUAL work is not a cloud computing study, but its emphasis on perceived quality remains relevant because customers judge services through reliability, responsiveness, assurance, empathy, and tangible cues (Parasuraman et al., 1988). In cloud operations, the tangible cue may be a status page, a console, a support response, a usage alert, or the clarity of documentation. A technically strong platform can still disappoint customers when support feels slow, explanations are opaque, or billing lacks transparency. Perceived quality therefore belongs in the cloud governance discussion rather than being dismissed as subjective noise.

2.3 Software Quality and Cloud Platforms

Software quality models also support a multidimensional view. ISO/IEC 25010:2023 defines quality characteristics for software and information technology products, including functional suitability, performance efficiency, compatibility, usability, reliability, security, maintainability, flexibility, and safety (International Organization for Standardization, 2023). Although a cloud platform is more complex than a single software product, the model helps managers resist the habit of treating uptime as the whole picture. A service can be available but difficult to configure safely, compatible only with costly workarounds, or hard to recover after a customer error. Quality characteristics interact. Reliability without usability may still produce operational risk because customers make mistakes when controls are hard to understand.

2.4 Site Reliability Engineering

The site reliability engineering literature adds a further practical discipline. SRE stresses error budgets, service-level objectives, toil reduction, monitoring, incident response, and learning from failure (Beyer et al., 2016). Its relevance for cloud enterprises lies in the recognition that reliability is not a vague aspiration. It has to be negotiated, measured, and operated. The SRE tradition is also useful because it does not imagine that failure can be eliminated. Instead, it asks what level of unreliability is tolerable, how fast teams can detect and respond to problems, how changes are controlled, and how the organization learns before repeated incidents become accepted background noise.

2.5 DevOps and Delivery Discipline

DevOps research complements SRE by connecting software delivery practices with organizational performance. The DORA research program has made deployment frequency, lead time for changes, change failure rate, and time to restore service common measures in software organizations (Forsgren et al., 2018; Google Cloud DORA, 2024). These measures matter in a cloud enterprise because customer-facing quality is affected by how frequently systems change, how safely changes are released, and how quickly service is restored after disruption. Fast delivery by itself is not quality. Speed becomes valuable when it is paired with stability, observability, and a disciplined learning culture.

2.6 AWS Operational Guidance

AWS public guidance reflects many of these ideas in customer-facing form. The AWS Well-Architected operational excellence pillar describes practices for organizing teams, operating workloads at scale, learning from operational events, and improving over time. The reliability pillar stresses the ability of workloads to perform correctly and consistently through their life cycle, including recovery from failure (Amazon Web Services, 2024a, 2024b). These materials matter for governance because they make service quality a shared managerial responsibility. They tell customers that buying cloud resources is not the same as operating a reliable cloud service. Cloud value depends on how the resources are designed, monitored, secured, tested, and improved.

2.7 Shared Responsibility

Shared responsibility is one of the most important concepts in cloud operations governance. AWS operates the cloud, while customers are responsible for what they run in the cloud, with the exact boundary depending on the service model. This distinction is more than legal language. It determines who must configure access permissions, encrypt data, design backup routines, monitor workload health, patch systems, manage credentials, and test recovery. Customers can create serious risk even on a strong platform if they misunderstand their responsibilities. In this sense, the provider’s service quality and the customer’s operating maturity are linked in the end user’s experience.

2.8 Service-Level Agreements

Service-level agreements give a formal contractual frame to availability, but they are limited tools for quality management. AWS publishes service-level agreements for generally available paid services, and the Amazon Compute SLA states commercially reasonable efforts to make Amazon EC2 available in each AWS region with a monthly uptime percentage of at least 99.99 percent (Amazon Web Services, 2022, 2025). That commitment is significant, but a service credit is not the same as full restoration of business value. A customer may face lost sales, staff overtime, compliance exposure, reputational damage, or downstream support pressure that exceeds the credit. Managers should treat SLAs as minimum commitments, not as a sufficient definition of quality.

2.9 Security as Service Quality

Security literature also belongs in a paper on service quality because confidentiality, integrity, and availability are intertwined. NIST’s Secure Software Development Framework encourages practices that reduce vulnerabilities across the software development life cycle (National Institute of Standards and Technology, 2022). In cloud enterprises, weak security can become a service-quality failure even when no traditional outage occurs. A compromised credential, overly permissive storage setting, insecure deployment pipeline, or exposed administrative interface can reduce customer trust and disrupt service. Customers do not experience security and service quality as separate domains. They experience both as the ability of the service to protect their work.

2.10 AWS Case Context

AWS’s case context includes both capability and concentration risk. Amazon’s public reporting shows AWS as a large and profitable segment, and its market role means that many organizations build important workloads on AWS services (Amazon.com, Inc., 2026). Scale brings advantages: large engineering teams, global infrastructure, specialized services, extensive monitoring, and broad customer guidance. Scale also means that operational events can have visible consequences across many dependent organizations. The case therefore supports a balanced analysis. It shows how mature cloud governance can be documented and taught, while also reminding managers that complexity never disappears.

2.11 Operations Learning

The literature on operations learning reinforces this balanced view. Mature operations teams do not simply restore service and move on. They examine precursor signals, decision paths, escalation delays, test gaps, communication weaknesses, and repeatable prevention opportunities. Post-incident review becomes a governance mechanism rather than an exercise in blame. For cloud enterprises, the learning loop must include both internal teams and customers. Customer misunderstandings, weak implementation patterns, and recurring configuration mistakes can reveal gaps in documentation, onboarding, product defaults, or warning systems. A provider that learns only from internal telemetry but ignores customer confusion will miss part of service quality.

2.12 Cost Governance

Cost management is sometimes placed outside service quality, but in cloud operations it belongs within the customer experience. Pay-as-you-go services can create agility, yet unpredictable bills can undermine trust. A customer who cannot explain a sudden cost increase to executives may view the platform as risky, even if the service remains technically available. AWS guidance on cost optimization, tagging, budgets, and usage visibility reflects this point. Cost clarity allows customers to operate with control. Without it, operational quality is experienced as uncertainty.

2.13 Literature Synthesis

Read together, the literature and AWS case context show that cloud service quality is a cross-functional discipline. Reliability, performance, security, usability, responsiveness, communication, recoverability, and cost transparency are linked. Weakness in one domain can reduce confidence in the rest. A highly available service that is poorly explained during incidents may still lose trust. A secure service that is too difficult for customers to configure correctly may produce preventable exposure. A low-cost workload that lacks recovery testing may become expensive during failure. Cloud quality therefore has to be governed as a living operating system of management choices.

Read also: Digital Pathology, Diagnostic Safety, and Workforce Sustainability

Chapter 3: Methodology

3.1 Research Design

This paper uses a mixed-methods case-study design. AWS provides the organizational case, and cloud service quality provides the management phenomenon under examination. The qualitative component analyzes public AWS materials, Amazon reporting, service-level statements, operations management literature, secure software guidance, and service quality scholarship. The quantitative component develops scenario-based indicators that show how managers can reason about availability, support pressure, capacity use, response time, and multi-dimensional quality. The combination is appropriate because cloud governance is both interpretive and numerical. Leaders need to understand the language of responsibility and the behavior of measurable systems.

3.2 Case Selection

Case selection is purposeful rather than random. AWS is selected because it is a major cloud provider with extensive public documentation on operational guidance, reliability, security, shared responsibility, service-level commitments, and customer support. The case is also useful because AWS is large enough to raise questions about scale, dependency, and concentration risk. A smaller provider might offer an interesting operational story, but the AWS case gives a richer base for examining how cloud service quality is communicated to customers and how managers can interpret cloud operations at enterprise scale.

3.3 Evidence Base

The study relies only on publicly available information. Sources include Amazon’s annual reporting, AWS service-level materials, AWS guidance on operational excellence and reliability, NIST secure software guidance, ISO/IEC software quality guidance, SRE and DevOps literature, and service quality theory. The paper does not use confidential AWS records, private customer contracts, internal incident reports, unpublished capacity data, or proprietary ticketing information. This boundary protects validity by preventing the analysis from implying access it does not have. Public evidence supports the case interpretation; scenario mathematics supports management reasoning.

3.4 Qualitative Procedure

The qualitative method is document and case analysis. Public materials are read for the way they define responsibility, guide customers, frame reliability, describe service commitments, and position operational improvement. The analysis is not limited to whether AWS has a policy or a document. It asks what managerial logic the documents express. For example, shared responsibility is examined as a formal model and as a practical governance challenge. A customer must know which risks remain with the customer, which controls the provider supplies, and how responsibility changes across infrastructure, platform, and managed services.

3.5 Scenario-Based Operations Modeling

The quantitative method uses five practical measures. Uptime percentage estimates availability. Queueing utilization estimates support or incident response pressure when demand approaches service capacity. Capacity use measures the relationship between used capacity and available capacity. Mean response time evaluates the speed of the first operational response. A cloud service-quality index combines reliability, performance, security posture, customer communication, and cost transparency. These measures are simple enough for managers to understand, but strong enough to show why a single metric cannot capture cloud service quality.

3.6 Availability Logic

Uptime percentage is expressed as U = ((Total Time – Downtime) / Total Time) × 100. This calculation is widely recognized and useful because availability is a central customer expectation. Its weakness is that it can hide context. Twelve minutes of downtime at a quiet hour may differ from twelve minutes during peak transaction demand. It also may not capture degraded service, regional dependency, data inconsistency, or the customer’s own recovery burden. For that reason, uptime is treated here as necessary but insufficient.

3.7 Queueing Utilization

Queueing utilization is expressed as ρ = λ / μ, where λ is the arrival rate and μ is the service rate. The value of this measure lies in its warning behavior. As utilization approaches one, waiting time can rise sharply. A support organization that looks efficient at 80 percent utilization can become strained when demand spikes without a matching increase in response capacity. In cloud operations, queueing logic applies to customer support, incident triage, security reviews, deployment approvals, and operational escalation. It shows why using every available unit of capacity may produce fragility rather than excellence.

3.8 Capacity Headroom

Capacity use is expressed as CU = Used Capacity / Available Capacity × 100. In cloud management, capacity has several forms: compute, storage, network throughput, database connections, specialized processing resources, support staffing, and regional failover ability. High capacity use may appear financially disciplined, but if headroom is too narrow, the service may struggle during demand surges or recovery events. Low capacity use may indicate waste. The governance problem is not to maximize or minimize utilization. It is to align headroom with workload volatility, customer impact, and risk appetite.

3.9 Response-Time Logic

Mean response time is expressed as MRT = Total First-Response Time / Number of Incidents. This measure is not the same as resolution time, but it strongly influences customer confidence. During an incident, customers often need acknowledgement, status, scope, and practical next steps. A fast but vague response is not enough; however, a slow response can make a technically competent recovery feel disorganized. Measuring first response helps leaders see whether incident communication is keeping pace with operational impact.

3.10 Cloud Service-Quality Index

The cloud service-quality index is expressed as CSQI = 0.30R + 0.20P + 0.20S + 0.15C + 0.15T. R represents reliability, P performance, S security posture, C customer communication, and T cost transparency. Each component is normalized on a 0–100 scale. The weights are scenario weights chosen for management illustration, not universal law. A healthcare workload may assign more weight to availability and safety; an analytics workload may give more weight to performance and cost transparency. The index is valuable because it forces leaders to discuss quality as a portfolio of outcomes.

3.11 Validity and Evidence Boundaries

Validity is strengthened by separating evidence types. Public documents support statements about AWS guidance and formal commitments. Peer-reviewed and professional sources support the theoretical framing. Scenario calculations support managerial interpretation. The paper avoids treating scenario values as actual AWS results. This distinction matters because a case study can lose credibility when it overstates what public data can prove. The analysis therefore remains transparent about what is known, what is modeled, and what is inferred.

3.12 Limitations

Limitations remain. Public documentation cannot reveal full internal decision-making, staffing levels, vendor dependencies, real-time incident coordination, or the complete experience of every AWS customer. Scenario models simplify reality, and weights in an index involve judgment. Still, the method is useful for master’s-level research because it converts a broad topic into an accountable management analysis. It allows cloud service quality to be discussed with both evidence and operational mathematics.


Chapter 4: Case Analysis: AWS and Digital Operations Governance

4.1 AWS Governance Guidance

AWS demonstrates cloud governance through a large body of customer-facing guidance. The importance of this guidance is not limited to instruction. It signals that the provider understands service quality as a shared operating practice. AWS does not simply sell compute, storage, database, analytics, security, and artificial intelligence services. It also teaches customers how to think about operational excellence, reliability, security, performance efficiency, cost discipline, and sustainability. That teaching role is part of the service relationship because many failures in cloud environments arise from weak implementation rather than from a complete provider outage.

4.2 Operational Excellence

Operational excellence is visible in the way AWS guidance stresses preparation, observability, routine operations, event response, and continuous improvement. In practical management terms, this means quality is not produced only during incidents. It is produced by the daily routines that precede them: change review, deployment testing, monitoring thresholds, access management, runbooks, capacity forecasts, backup verification, and clear escalation paths. A cloud customer that has not practiced recovery should not assume that recovery will be smooth when the service is under stress. The provider can supply tools, but the customer must turn tools into disciplined work.

4.3 Reliability Governance

Reliability guidance in the AWS case rests on a mature assumption: failure is possible, so workloads should be able to continue, degrade safely, or recover. This is an important departure from a purely preventive view of quality. Prevention matters, but cloud services operate in environments where software changes, usage patterns, dependency chains, and security threats are constantly moving. A strong reliability posture asks whether the workload can withstand component failure, whether monitoring will detect trouble early, whether data recovery has been tested, whether regional dependencies are understood, and whether customers have chosen suitable service configurations for their risk profile.

4.4 Shared Responsibility Boundary

The shared responsibility model is the clearest governance boundary in the case. AWS is responsible for the security and operation of the cloud infrastructure and managed service components under its control. Customers remain responsible for their own data, identity settings, application choices, network controls, endpoint protection, and service-specific configurations. The boundary changes by service model. A customer running virtual machines has more operating responsibility than a customer using a more managed service, but no model removes customer accountability altogether. This creates a central service-quality lesson: cloud adoption transfers some responsibilities, but it does not eliminate management.

4.5 Interpreting Service-Level Commitments

Service-level agreements add formal clarity, yet their role should be interpreted carefully. A published SLA gives customers a defined availability commitment and a remedy, often in the form of service credits. The value is contractual and symbolic: it shows that availability is a formal promise. The limitation is equally important. A credit cannot fully compensate for a failed product launch, a delayed clinical process, a damaged customer relationship, or a regulatory explanation after a disruption. Enterprise customers therefore need internal service targets that are stricter and more contextual than the provider’s minimum commitments.

4.6 Incident Communication

Incident communication is another governance test. Customers judge cloud providers by the eventual restoration of service and by the quality of information available while the event is unfolding. Useful incident communication is timely, plain, scoped, and practical. It acknowledges uncertainty without hiding behind vague language. It helps customers decide whether to fail over, wait, communicate to their users, pause deployments, or activate continuity plans. AWS’s public status tools and support channels are part of this experience, but customers still need their own communication routines because their end users often do not consume provider status information directly.

4.7 Security Governance

Security governance in the AWS case is inseparable from service quality. AWS offers identity, encryption, logging, key management, monitoring, network, and threat detection services, yet customer choices remain decisive. A misconfigured identity policy, exposed access key, public storage setting, unpatched workload, or weak segmentation decision can create the appearance of cloud failure when the deeper issue is customer governance. For managers, this means quality dashboards should include security posture indicators. A service that is available but unsafe has not delivered high quality.

4.8 Cost Governance

Cost governance is also part of the AWS service-quality picture. Cloud pricing gives flexibility, but flexibility without visibility can produce executive anxiety. Customers need tags, budgets, alerts, forecasting, chargeback methods, and accountability for resource consumption. A customer who learns about waste through a surprising invoice may lose trust in the platform and in the internal team managing it. Cost clarity is therefore not a finance afterthought. It is part of the experience of control. Good cloud operations makes spending explainable before it becomes a crisis.

4.9 Capacity Planning

Capacity planning in the AWS case operates at two levels. AWS must plan provider-side capacity across regions, availability zones, power, cooling, networking, storage, computing, specialized chips, and service teams. Customers must plan workload-side capacity through autoscaling, quotas, database sizing, caching, failover, and demand forecasting. Artificial intelligence and data-intensive workloads make this more demanding because compute requirements can grow quickly. The governance lesson is that cloud capacity may be elastic, but it is not magical. Elasticity still needs limits, forecasts, tests, and financial rules.

4.10 Customer Maturity

Customer maturity varies widely, and that variation affects service quality. Some customers have experienced cloud teams, mature security operations, tested recovery processes, and strong cost management. Others move workloads quickly without adequate operating discipline. AWS guidance reduces risk by making best practices visible, but guidance cannot force maturity. This is why cloud enterprises increasingly provide assessment tools, best-practice programs, training, and partner ecosystems. Provider governance includes helping customers govern themselves.

4.11 Scale and Dependency Risk

The AWS case also shows the danger of equating scale with invulnerability. Large platforms can provide redundancy, automation, and specialized expertise that smaller organizations could not build alone. Yet large platforms are also complex systems with many dependencies. Complexity creates hidden coupling, ambiguous signals, and occasional surprises. Mature cloud governance does not deny this. It builds systems that detect, isolate, communicate, and learn. The managerial question is not whether a cloud enterprise can promise that nothing will go wrong. It is whether the organization is prepared to protect customers when something does.

4.12 Transparency and Incident Disclosure

A final case pattern concerns transparency. Customers need enough information to make risk decisions, but cloud providers must also protect security-sensitive details and avoid speculation during fast-moving events. This tension requires judgment. Too little information damages trust; too much premature information may mislead customers or expose sensitive operational details. Mature incident communication balances speed, accuracy, and usefulness. It tells customers what is known, what is being investigated, what actions are recommended, and when the next update will come.

4.13 Case Synthesis

Figure 1. Cloud operations governance and service-quality chain.


The case evidence supports a central finding: AWS frames service quality as a combined responsibility involving provider capability, customer practice, operational measurement, security controls, formal commitments, and continuous improvement. This framing is stronger than a narrow uptime promise. It also places a burden on customers. Cloud quality is not something purchased once. It is something governed across the life of the workload.


Chapter 5: Operations Mathematics and Service-Quality Modeling

5.1 Purpose of Operations Modeling

Operations mathematics gives cloud managers a way to discuss quality without relying only on impressions. The purpose is not to reduce customer experience to formulas. The purpose is to make invisible pressure visible before it becomes a public failure. Availability, utilization, capacity headroom, response time, and composite quality scores each reveal a different part of the service-quality problem. Used together, they help executives ask better questions about reliability and readiness.

5.2 Availability Scenario

Consider a monthly availability example. A service operates for 43,200 minutes in a 30-day month and experiences 12 minutes of qualifying downtime. The availability calculation is U = ((43,200 – 12) / 43,200) × 100 = 99.972 percent. The number appears strong, but a manager still needs context. Did the downtime occur during peak business hours? Did it affect all customers or a specific region? Did customers experience degraded performance before or after the measured downtime? Were data checks required? Was communication clear? Availability is a starting point, not the end of the analysis.

5.3 Queueing Utilization Scenario

Queueing utilization exposes a different risk. Suppose a priority support team receives 48 incidents per hour and can respond to 60 per hour. Utilization is ρ = 48 / 60 = 0.80. The team has pressure but still has room to absorb variation. If demand rises to 57 incidents per hour while capacity remains 60, utilization becomes 0.95. That five-point movement can change the customer experience sharply because waiting time accelerates near saturation. An executive who sees only staffing cost may call 95 percent utilization efficient. A service manager should recognize it as a warning.

5.4 Capacity Headroom Scenario

Capacity use raises a related trade-off. Suppose a regional workload uses 72 units out of 100 available units. CU = 72 percent. This level may be financially reasonable while preserving headroom. If demand rises to 94 units, the service may still be technically within capacity, but operational resilience is weaker. A failover event, traffic spike, security investigation, or batch processing surge could push the system into strain. The cost of unused headroom must be compared with the business cost of fragility.

5.5 Mean Response Time

Mean response time is important because customers need acknowledgement before full resolution is possible. If ten priority incidents produce 220 total minutes before first response, MRT = 22 minutes. If process changes reduce the total to 120 minutes, MRT = 12 minutes. This improvement does not prove faster technical resolution, but it changes the customer’s experience of being supported. Clear response can reduce rumor, duplicated tickets, internal escalation, and executive frustration. Response time should therefore be paired with quality of response, not interpreted as a pure speed metric.

5.6 Composite Service-Quality Index

A cloud service-quality index allows managers to bring several dimensions into one conversation. In the example used here, reliability receives a 0.30 weight, performance 0.20, security posture 0.20, customer communication 0.15, and cost transparency 0.15. A service with reliability 94, performance 88, security 90, communication 80, and cost clarity 76 receives CSQI = 0.30(94) + 0.20(88) + 0.20(90) + 0.15(80) + 0.15(76) = 87.2. The score is useful because it prevents one strong metric from hiding weaker dimensions.

5.7 Limits of the Index

The index should not become a new form of false precision. A high score may conceal serious risk if one dimension is high-impactly low. A service with excellent performance but weak security should not be accepted simply because the total score is respectable. Likewise, a service with strong reliability but poor cost transparency may generate executive dissatisfaction. The index is a governance tool. It supports discussion, trade-off analysis, and prioritization. It does not replace judgment.

5.8 Managerial Use of Scenarios

Scenario modeling is particularly useful because public case studies rarely provide the private data managers would prefer. A company may not know a provider’s internal capacity, but it can still model its own exposure. It can calculate the business impact of downtime, the cost of overutilized support, the benefit of faster first response, and the value of better cost alerts. Cloud governance improves when executives can see risk in numbers they understand.

Table 1. AWS Cloud Operations Governance Case Profile

Governance domain AWS case evidence Service-quality meaning
Operational excellence AWS operational excellence guidance Quality depends on prepared routines, observation, review, and improvement.
Reliability AWS reliability guidance and regional service model Workloads should recover from failure and meet expected demand.
Service-level commitments AWS published SLAs for paid generally available services Availability commitments define minimum expectations, not total business protection.
Shared responsibility Provider and customer duties vary by service model Provider controls and customer configuration jointly shape experienced quality.
Security governance AWS security services, identity controls, logging, and customer guidance Security is part of customer trust and therefore part of service quality.
Cost governance Budgeting, tagging, cost monitoring, and cost guidance Financial clarity affects the customer’s sense of control.

Table 2. Operations Mathematics for Cloud Service Quality

Measure Formula Management use
Uptime percentage U = ((Total Time – Downtime) / Total Time) × 100 Measures service availability while requiring business context.
Queueing utilization ρ = λ / μ Shows pressure as incident or support demand approaches response capacity.
Capacity use CU = Used Capacity / Available Capacity × 100 Balances efficiency with operational headroom.
Mean response time MRT = Total First-Response Time / Incidents Evaluates speed of acknowledgement during incidents.
Cloud service-quality index CSQI = 0.30R + 0.20P + 0.20S + 0.15C + 0.15T Combines reliability, performance, security, communication, and cost clarity.

Table 3. Scenario-Based Cloud Service-Quality Index

Scenario Reliability Performance Security Comm. Cost clarity CSQI
Stable operations 94 88 90 80 76 87.2
Strong communication 92 87 88 92 80 88.4
High performance, weak cost clarity 95 94 90 78 60 86.0
Improved recovery 90 84 88 88 78 86.3


Chapter 6: Findings

6.1 Co-Produced Quality

The central finding is that cloud service quality is co-produced by provider capability and customer operating maturity. AWS can supply a highly capable platform, documented service commitments, security controls, monitoring tools, and best-practice guidance. The customer still decides how workloads are configured, how identities are controlled, how recovery is tested, how costs are monitored, and how internal users are supported. The customer’s end user does not separate these responsibilities when something fails. The experience is judged as one service.

6.2 Availability Is Necessary but Incomplete

A second finding is that uptime is necessary but incomplete. Availability commitments matter, and managers should read them carefully. Yet uptime alone cannot explain degraded performance, unclear incident communication, weak customer recovery planning, security exposure, or unpredictable cost. A cloud service can meet a formal availability measure while still creating customer frustration. Leaders need dashboards that include performance, incident response, security posture, recoverability, and cost transparency.

6.3 Operationalizing Shared Responsibility

The case also shows that shared responsibility must be operationalized rather than left as a slogan. Many cloud failures arise not from ignorance of the model but from weak translation into daily practice. Organizations may understand that they are responsible for identity controls, yet still fail to review permissions. They may know they need backup, yet fail to test restore procedures. They may recognize cost risk, yet lack tagging and budget alerts. Governance succeeds when responsibility becomes routine.

6.4 Communication Under Pressure

Another finding concerns communication under pressure. Cloud customers need more than technical recovery. They need to know what is happening, whether their workloads are affected, what actions are recommended, and when another update will arrive. Communication does not remove the pain of disruption, but it can preserve confidence. Poor communication can make a manageable incident feel uncontrolled.

6.5 Early Warning Through Capacity Signals

Capacity and support pressure require early warning. Queueing logic shows why delay can accelerate quickly when arrival rates approach service capacity. Cloud enterprises and cloud customers should watch utilization before saturation becomes visible. This principle applies to technical resources and to human response teams. Operating every system near maximum use may look efficient until demand changes.

6.6 Security as a Quality Dimension

Security must be treated as a service-quality dimension. Customers experience trust as a whole. A service that runs but exposes data, credentials, or administrative paths has failed quality in a practical sense. Secure development, identity governance, logging, access review, and configuration control should be integrated into quality review.

6.7 Cost Transparency

Cost transparency is a final finding because cloud usage converts technical decisions into financial consequences. When spending becomes difficult to explain, trust weakens. Cost governance should be part of operational review, not a late finance correction. Customers need the ability to see, forecast, allocate, and challenge cloud spending in language executives can understand.


Chapter 7: Discussion, Recommendations and Conclusion


7.1 Technical and Service Literacies

The AWS case makes clear that cloud operations leaders need both technical literacy and service literacy. Technical literacy helps them understand availability zones, failover, capacity, latency, identity, observability, and recovery. Service literacy helps them understand customer anxiety, communication needs, billing pressure, and the reputational meaning of incidents. A manager who has only one of these literacies will miss part of the problem. Cloud quality is a technical service delivered through organizational trust.

7.2 Governance Before Business impact

The discussion also shows why cloud governance should be embedded before workloads become high-impact. Many organizations strengthen governance only after an incident, a security scare, or a billing surprise. That reactive pattern is costly. A cloud workload should have clear ownership, risk classification, recovery objectives, cost alerts, access review, monitoring, and support paths before it becomes essential. The more high-impact the workload, the less acceptable it is to discover governance gaps during a disruption.

7.3 False Confidence in Shared Responsibility

Shared responsibility deserves special attention because it can create false confidence. Customers may assume that a cloud provider’s reputation protects them from operational discipline. That assumption is dangerous. Cloud providers can remove many infrastructure burdens, but customers still make decisions that affect end-user quality. A poorly governed customer can turn a strong platform into an unreliable service. This is why executive leaders must treat cloud adoption as a management change rather than a technology procurement.

7.4 SLAs and Business Impact

Service-level agreements should be read through the lens of business impact. A contractual credit may be useful, but the customer’s real loss may involve delayed work, lost sales, emergency staffing, compliance reviews, and reputational repair. Business-essential workloads need internal service-level objectives that reflect the organization’s own risk. A public-sector portal, a hospital workflow, and an experimental analytics sandbox do not require identical reliability targets. Governance has to classify workloads and allocate controls accordingly.

7.5 Learning Culture

There is also a cultural dimension. Mature cloud operations cultures do not treat incidents as embarrassing exceptions to hide. They treat them as evidence. An incident reveals where monitoring was thin, where escalation was slow, where documentation was unclear, where dependencies were misunderstood, or where customers lacked guidance. Blame-focused cultures may close tickets quickly but fail to learn. Learning-focused cultures convert incidents into safer practice.

7.6 Using the Index as Conversation Instrument

The cloud service-quality index proposed in this paper is best understood as a conversation instrument. Its value lies less in the exact number than in the argument it forces. Why does reliability receive more weight than communication? Is cost transparency too low? Should security posture have a threshold below which the total score cannot be considered acceptable? These questions are managerial. They encourage leaders to express priorities rather than hiding them behind technical dashboards.

7.7 Customer Governance Questions

For AWS customers, the practical lesson is that provider selection is only one part of risk management. Customers should evaluate how their own organization will operate in the chosen cloud environment. Do teams understand the shared responsibility boundary? Are recovery procedures tested? Are workloads tagged? Are privileged identities reviewed? Are incident roles clear? Are business units prepared for degraded service? These questions determine whether cloud adoption becomes dependable service or unmanaged dependency.

7.8 Public Consequence of Cloud Dependency

The wider social implication is that cloud quality now affects public life. When cloud services support hospitals, schools, benefit systems, public communication, or emergency information, a technical incident may become a public confidence issue. Cloud governance therefore belongs in board-level risk discussion. Executives do not need to become engineers, but they do need to understand the service consequences of cloud dependency.

7.9 Multi-Dimensional Dashboards

Cloud enterprises and cloud-dependent organizations should manage service quality through multi-dimensional dashboards. Availability should remain visible, but it should sit alongside latency, error rates, recovery test results, support response, security posture, cost variance, customer communication, and post-incident actions. A dashboard that reports uptime alone is too narrow for enterprise decision-making.

7.10 Responsibility Maps

Figure 2. Shared-responsibility map for cloud service quality.

Organizations should treat shared responsibility as a training and audit requirement. Every business-essential workload should have a documented responsibility map showing which controls belong to the provider, which belong to the customer, and which require joint coordination. The map should be reviewed when the service model changes. Without this routine, shared responsibility remains a slogan rather than a governance practice.

7.11 Internal Service Targets

Internal service targets should exceed provider SLAs for business-essential services. Workloads with high financial, safety, regulatory, or public consequences need recovery objectives, failover plans, backup validation, and communication playbooks that reflect actual business impact. The SLA may define a provider remedy, but it should not define the customer’s whole continuity strategy.

7.12 Communication Preparedness

Incident communication should be rehearsed. Customers need plain-language updates, internal escalation paths, executive briefings, and user-facing messages before a disruption occurs. Communication templates should allow honest uncertainty while still providing useful guidance. During pressure, the worst moment to invent a communication routine is the moment when customers are already waiting.

7.13 Capacity and Saturation Review

Queueing and capacity measures should be reviewed before saturation. Support teams, incident responders, and technical resources need thresholds that trigger additional capacity, automation, or demand control. Leaders should avoid celebrating utilization so high that small demand changes produce delay. Efficiency without resilience is fragile quality.

7.14 Security in Quality Review

Security controls should be included in service-quality reviews. Access review, key management, logging coverage, vulnerability remediation, secure development practices, and configuration checks should be discussed with the same seriousness as uptime. Customers do not experience a breach as separate from service quality; they experience it as loss of trust.

7.15 Cost Transparency

Cost transparency should be treated as a customer confidence issue. Tagging, budgets, anomaly alerts, showback, forecasting, and business-unit accountability should be established early. Cloud teams should be able to explain spend in operational language as well as accounting language. When financial signals are clear, cloud flexibility feels controlled rather than risky.

7.16 Post-Incident Learning

Post-incident review should focus on learning and recurrence prevention. The review should identify what happened, what signals appeared, who needed to know, what customer actions were required, and what practice will change. The review should produce accountable actions rather than narrative closure. A restored service is not the same as an improved service.

7.17 Workload Classification

Workload classification deserves more emphasis than it often receives. A cloud-dependent organization may have experimental dashboards, internal collaboration tools, regulated data workflows, customer-facing transaction systems, and emergency response services in the same cloud estate. These workloads should not share one governance standard. Business impact, data sensitivity, recovery tolerance, user impact, and regulatory exposure should determine the level of control. A low-risk prototype may tolerate brief interruption and simple backup. A public-facing payment service may require stronger failover, more frequent restore testing, stricter identity review, and executive incident notification. Classification prevents both under-control and over-control.

7.18 Portfolio Governance

Governance maturity should also be assessed at the portfolio level. Many organizations can point to one well-managed workload while leaving the wider environment inconsistent. Some teams may tag resources properly while others do not. Some applications may have tested recovery procedures while others rely on assumptions. Some business units may understand cloud cost drivers while others treat spending as a surprise. A cloud service-quality review should therefore look across accounts, teams, applications, and regions. The question is not whether excellence exists somewhere, but whether dependable practice exists where the organization’s most important work depends on it.

7.19 Documentation as Usable Knowledge

The AWS case also reminds managers that documentation must become usable knowledge. Long technical guidance has limited value if busy teams cannot translate it into decisions. Organizations should turn provider guidance into local standards, checklists, training, design reviews, and operational routines. This translation work is where many cloud programs become stronger. It converts a general best practice into an internal expectation with named owners, review dates, and evidence of completion. Without that step, guidance can be admired but not practiced.

7.20 Integrated Management Responsibility

Cloud service quality is now a management responsibility with technical, financial, security, and public dimensions. The AWS case shows that mature cloud enterprises can provide strong service commitments, global resources, security controls, guidance, and operational tools. It also shows that dependable quality requires more than provider scale. Customers must govern their own use of cloud services through configuration discipline, recovery testing, access control, observability, cost management, and clear internal ownership.

7.21 Study Contribution

The study’s main contribution is a multi-dimensional view of cloud quality. Uptime matters, but it cannot carry the whole meaning of service. Queueing pressure, capacity headroom, first response, security posture, customer communication, and cost transparency reveal quality risks that uptime can hide. The proposed cloud service-quality index is not a universal formula, but it gives leaders a practical way to discuss trade-offs and priorities.

7.22 Case Conclusion

AWS remains an important case because its public materials make visible the operating language of a major cloud provider. The strongest lesson is not that one platform can remove risk. The lesson is that service quality has to be governed continuously across provider and customer boundaries. Cloud enterprises earn trust when they make systems reliable, secure, explainable, recoverable, and financially understandable. Customers protect trust when they turn cloud guidance into disciplined operating practice.


Chapter 8: Applied Cloud Governance Standard

8.1 Why Cloud Quality Needs Executive Ownership

Cloud quality cannot be left only to engineers once a workload becomes essential to the organization. Engineers understand latency, failover, deployment risk, access controls, observability, and logs, but executive leaders decide how much risk the organization is prepared to tolerate. They decide which services are high-impact, which recovery objectives are acceptable, which data are sensitive, and which customer promises must be protected during disruption. Those decisions need technical advice, but they are governance decisions before they are engineering decisions.

A useful governance standard begins with workload classification. A test dashboard, an internal analytics sandbox, a payroll system, a patient portal, a payment workflow, and a public emergency platform do not carry the same consequence if they fail. The problem in many organizations is that cloud use grows faster than classification. Teams build quickly, spending begins as a project cost, and only later does the workload become important enough to require board attention. By then, ownership, cost accountability, recovery expectations, and security responsibilities may already be unclear.

AWS guidance on operational excellence and reliability is valuable because it pushes customers to treat preparation as part of quality rather than an administrative afterthought (Amazon Web Services, 2024a, 2024b). The same logic belongs at executive level. Leaders should know which workloads are most exposed, which services have been tested for recovery, which data stores lack backup validation, which teams depend on a single person, and which business units would be unable to operate if a cloud service became degraded for several hours. This is not micromanagement. It is risk ownership.

Cloud adoption often begins with a promise of agility. That promise is real, but agility without governance becomes another source of disorder. A team can launch resources quickly and still fail to tag them, monitor them, secure them, or retire them. A service can scale automatically and still produce a bill no one can explain. A region can provide resilience options that customers do not configure. Executive ownership therefore has to ask a plain question: have cloud services been turned into managed organizational commitments, or are they still treated as technical assets owned by whichever team first built them?

8.2 Shared Responsibility as a Working Control

Shared responsibility is often quoted more easily than it is practiced. The phrase can sound settled, as if naming the boundary solves the risk. It does not. A shared responsibility model has to be translated into a control register, a training routine, and an audit practice. Otherwise, customers may assume that the cloud provider has taken over more responsibility than it has, while internal teams assume that another department is handling the remaining work.

The working question is specific: who owns identity review, privileged access, encryption choices, network exposure, backup testing, patching, logging, incident notification, cost alerts, and recovery drills? The answer changes by service model. A customer using virtual machines carries a different operating burden from a customer using a managed database or serverless service. Even in highly managed services, the customer still makes choices about access, data, configuration, monitoring, and business continuity. Those choices influence the quality the end user experiences.

The AWS case is useful because it makes this boundary visible. AWS can provide infrastructure, service controls, documentation, monitoring services, security tools, and formal commitments. The customer still has to configure, test, review, and govern. A misconfigured storage setting, exposed access key, weak identity policy, untested backup, or abandoned development environment can create a service-quality failure without requiring a provider outage. The customer may still describe the event as a cloud problem because the work was hosted in the cloud. The deeper cause may be unmanaged responsibility.

A publication-ready cloud governance standard should therefore require a responsibility map for every business-essential workload. The map should show which controls belong to the provider, which belong to the customer, which are shared, and which require evidence of testing. It should be reviewed whenever a service model changes, when a workload becomes business high-impact, when sensitive data are introduced, or when a major incident exposes confusion. The map should be useful enough for a manager to ask, during an incident, who must act next and what evidence shows that the required control exists.

8.3 Incident Communication and the Preservation of Trust

Incident communication is one of the fastest ways to strengthen or damage trust. Technical teams may focus on restoration, which is understandable. Customers and executives also need orientation. They need to know what is affected, what is still unknown, what actions are recommended, when the next update will arrive, and whether they should activate continuity plans. Silence during uncertainty rarely feels neutral. It feels like loss of control.

A strong incident message does not need false certainty. It needs useful honesty. Early communication can acknowledge that investigation is still underway while giving customers enough information to make decisions. Later communication can narrow the scope, identify known impact, describe workarounds, and name the next update time. After restoration, communication should explain what changed, what risk remains, and what will be reviewed. This sequence matters because customers often have to communicate to their own users before the provider has completed technical recovery.

SRE literature is helpful because it treats incidents as part of operating life rather than as shameful surprises (Beyer et al., 2016). The lesson for governance is that communication should be rehearsed before the incident. Teams need templates, escalation paths, executive briefings, customer-facing language, and internal roles. The person who can fix the system is not always the person who should brief the executive group. The engineer who understands the fault may not have the authority to approve a customer message. These role decisions should not be invented under pressure.

Communication also has to account for degraded service, not just total outage. A service may be technically available while performance is poor, error rates are high, support queues are overloaded, or data reconciliation is required. Customers experience degraded service as disruption. A narrow status message that says the service is available may feel evasive when the practical experience is failure. Cloud governance should therefore include language for partial impairment, regional impact, customer-specific risk, and recovery uncertainty.

8.4 Quality Evidence Beyond Uptime

Availability remains important, but it cannot carry the whole meaning of cloud quality. A service can meet an uptime percentage and still leave customers dissatisfied because support was slow, costs were unclear, recovery was untested, security controls were weak, or communication was too vague. Quality has to be read through several forms of evidence at the same time.

ISO/IEC 25010 is useful because it gives managers a broader vocabulary for software and systems quality, including performance efficiency, reliability, security, usability, compatibility, maintainability, flexibility, and safety (International Organization for Standardization, 2023). A cloud workload may be reliable in a narrow availability sense but difficult for customers to configure safely. It may perform well under normal demand but become expensive under automated scaling. It may be secure in design but hard for non-specialist teams to operate without mistakes. Each weakness changes the service experience.

Cost evidence deserves a stronger place in quality review. Cloud spending is more than a finance concern. It is a signal of control. A service team that cannot explain a sudden bill may have weak tagging, poor forecasting, no anomaly alerting, or unclear ownership of resources. The customer may still value the cloud platform, but the sense of control has been damaged. A mature governance review asks whether cost is visible early enough for teams to act, whether invoices are eventually paid.

Security evidence belongs in the same review. A service that is available but poorly governed from a security perspective is not high quality. NIST’s Secure Software Development Framework stresses disciplined practices to reduce vulnerabilities across development and deployment work (National Institute of Standards and Technology, 2022). For cloud customers, this means access review, key management, logging, secure configuration, deployment controls, and vulnerability response should be discussed with the same seriousness as uptime. A security failure can become a service failure even without a conventional outage.

Observability is the connective evidence. Without logs, metrics, traces, alerts, and useful dashboards, teams may discover problems from customers rather than from their own systems. That weakens confidence. Observability should show whether the service is healthy, whether performance is degrading, whether errors are rising, whether cost is drifting, and whether recovery controls are working. A dashboard that reports uptime alone is too narrow. It may make the organization feel safe while important signals remain outside view.

8.5 AI and Data-Intensive Workloads

Artificial intelligence and data-intensive workloads sharpen the governance problem because they increase demand for specialized compute, storage, data movement, monitoring, and cost control (Kleppmann, 2017). They also raise questions about data stewardship, model behavior, security, and explainability. A cloud customer running ordinary web applications may already need disciplined governance. A customer running AI pipelines, large analytics workloads, or high-volume data processing needs that discipline even more.

Capacity planning becomes more difficult because demand may arrive unevenly. Training jobs, batch analytics, inference workloads, and experimental projects can consume resources quickly. Elasticity helps, but it does not remove limits. Quotas, regional capacity, specialized chips, network throughput, storage performance, and budget ceilings still matter. A team that treats elasticity as unlimited may discover the constraint at the worst point: during a product launch, a research deadline, a customer commitment, or a security investigation.

Cost visibility also becomes more urgent. AI and analytics workloads can generate spending that is difficult for executives to understand because usage is tied to experiments, model runs, data movement, and scaling patterns rather than a simple user count. Governance should require tagging, budget alerts, workload owners, experiment controls, and review of idle resources. Cloud flexibility is valuable only when leaders can explain the cost of that flexibility.

Data stewardship sits at the center of this issue. Sensitive data used in analytics or AI workflows must be governed through access control, retention rules, encryption, lineage, and auditability. If teams move data into cloud environments faster than governance can follow, the organization may create risks that are invisible until a breach, compliance review, or customer challenge occurs. The cloud provider may offer many controls, but the customer’s data decisions remain decisive.

DORA and DevOps research also matter for AI and data-intensive work because speed alone does not prove maturity (Forsgren et al., 2018; Google Cloud DORA, 2024). Teams may deploy quickly and experiment aggressively while still lacking change discipline, monitoring, rollback plans, or security review. The management question is not whether teams are moving fast. It is whether they can move fast without creating ungoverned dependency.

8.6 Minimum Governance Controls for Cloud-Dependent Organizations

A practical cloud governance standard should be small enough to use and strong enough to matter. The minimum control set begins with ownership. Every business-essential workload should have a named business owner, a technical owner, a security owner, and a cost owner. These roles may overlap in smaller organizations, but the responsibilities should not be vague. A system without ownership becomes invisible until it fails.

The second control is classification. Workloads should be classified by business impact, data sensitivity, user dependence, compliance relevance, and recovery need. Classification prevents two errors. It prevents business-essential workloads from being under-governed, and it prevents low-risk experiments from being burdened with controls that make ordinary work impossible. Governance should fit risk.

The third control is recovery evidence. Backup schedules, replication choices, restore tests, failover drills, and recovery objectives should be documented. A backup that has never been restored is an assumption, not a control. A failover plan that no one has practiced is a hope, not a capability. Recovery evidence should be reviewed more often for workloads with high public, financial, safety, or regulatory impact.

The fourth control is identity discipline. Privileged access should be limited, reviewed, logged, and revoked when roles change. Service accounts and machine credentials should be managed with the same seriousness as human access. Many cloud failures begin with identity weakness rather than provider outage. Identity is therefore a service-quality control.

The fifth control is cost accountability. Budgets, alerts, tagging, resource ownership, anomaly detection, and chargeback or showback methods should exist before spending becomes difficult to explain. Cloud teams should be able to tell executives which workloads are driving cost and whether that cost is expected, wasteful, or strategically justified.

The sixth control is incident readiness. Teams need severity definitions, escalation routes, customer communication templates, provider support paths, and post-incident review practices. Incident readiness should include degraded service as well as total outage. It should also include executive notification when customer, regulatory, financial, or reputational consequences are likely.

Table 4. Minimum Cloud Governance Controls

Control area Required evidence Management test
Ownership Named business, technical, security, and cost owners Can leaders identify who decides, who acts, and who communicates during pressure?
Classification Workload impact, data sensitivity, and recovery tier Does the control level match the real consequence of failure?
Recovery Backup validation, restore test, failover plan, and recovery objective Has the service proved that it can recover, or is recovery assumed?
Identity Privileged-access review, logging, and credential lifecycle control Can the organization show who has access and why?
Cost Tags, budgets, alerts, anomaly review, and owner accountability Can spending be explained before it becomes a crisis?
Incident readiness Severity levels, escalation paths, communication templates, and review routine Can the organization communicate and learn while service pressure is active?

8.7 Customer Education and Onboarding

Customer education is part of cloud service quality because many service failures begin with misunderstanding rather than platform weakness. A customer may know that a cloud provider offers encryption, backup, logging, identity controls, and monitoring, but still misunderstand which choices must be made locally. The difference between available controls and adopted controls is where governance risk often sits. A service provider can publish strong guidance. The customer still needs to turn that guidance into decisions, training, and routine review.

Onboarding should therefore be treated as a control point. When a new team enters a cloud environment, it should learn more than how to deploy resources. It should understand account structure, identity boundaries, tagging rules, data classification, budget alerts, support escalation, incident communication, and recovery expectations. These matters may sound administrative, but they decide whether the team can operate safely after deployment. A workload that goes live before the team understands its operating duties has already created risk.

Documentation matters, but documentation alone is not enough. Customers often need examples, defaults, guardrails, and practical review. If a team can choose a risky configuration without warning, or can run high-cost resources without budget alerts, the environment is too dependent on memory and goodwill. Good cloud governance makes safer choices easier to make and harder to miss. This may include account templates, baseline policies, mandatory tagging, preapproved network patterns, identity guardrails, and automated checks before production release.

Training should also be role-specific. Executives need to understand risk, cost, continuity, and public accountability. Engineers need to understand design patterns, monitoring, change control, and security configuration. Finance teams need usage visibility and forecasting language. Security teams need evidence of access review, vulnerability management, and incident response. Business units need to know what the cloud service can and cannot guarantee. A single generic training session cannot carry all of that.

The strongest customer education is linked to actual workload review. Teams learn best when guidance is attached to their own systems: the database they depend on, the identity policy they inherited, the recovery plan they have not tested, or the monthly cost line they cannot explain. This makes cloud governance less abstract. It also helps the organization see whether learning has changed practice.

8.8 Evidence Limits and Publication Discipline

A public case study of AWS has to be careful about what it can and cannot prove. Public documentation can show how AWS explains operational excellence, reliability, shared responsibility, service commitments, security guidance, cost optimization, and customer support. Amazon reporting can show the scale and business significance of AWS. Professional literature can help interpret reliability, DevOps, service quality, and software quality. These sources support a disciplined management analysis. They do not reveal AWS internal incident rooms, proprietary telemetry, private customer contracts, engineering staffing levels, real-time escalation decisions, or confidential capacity forecasts.

This limit is not a weakness if the paper states it plainly. It would be weaker to imply access the study does not have. The value of the case lies in using public evidence to examine how a major cloud enterprise frames service quality and how managers can reason about cloud dependency. Scenario mathematics also has to remain transparent. The calculations in this paper are not AWS performance claims. They are management illustrations. They show how a leader can think about availability, utilization, response time, headroom, and composite quality when direct internal data are unavailable.

The same caution applies to the cloud service-quality index. The index is useful because it forces a discussion across reliability, performance, security, communication, and cost transparency. It becomes dangerous if leaders treat the score as a complete truth. A strong total can hide a weak dimension. A service with high reliability and poor security should not be accepted because the weighted number remains respectable. A service with good performance and poor cost transparency may still damage executive trust. The score should support review, not replace it.

Publication discipline also requires careful treatment of AWS. The case should not read as promotion or attack. AWS is a major cloud enterprise with extensive public materials, formal commitments, and a substantial market role. It also operates inside the ordinary limits of complex systems. A serious paper can recognize capability without turning it into praise, and can discuss risk without implying private knowledge of failure. That balance is important for NYCAR publication quality.

The paper’s conclusions are therefore framed as management findings. They concern cloud governance, shared responsibility, service quality, measurement, communication, and customer readiness. They do not claim to audit AWS internally. They do not rank cloud providers. They do not present scenario values as company data. This restraint gives the paper credibility.

8.9 Additional Publication Readiness Controls

A publication-ready cloud operations paper should also show how its own claims are controlled. The strongest claims in this study are tied to public AWS documentation, Amazon reporting, service-quality theory, secure software guidance, ISO quality language, SRE, DevOps research, and transparent scenario mathematics. The weaker claims are not hidden; they are marked as interpretation. This distinction matters because cloud papers can easily drift into ungrounded commentary. A mature study keeps a visible boundary between documented evidence, professional reasoning, and illustrative modeling.

The same standard applies to the case selection. AWS is not examined because it is the only cloud provider worth studying. It is examined because the public record is large enough to support a serious management analysis. The case is visible, well documented, and operationally important. These qualities make it suitable for a master’s-level case study, but they do not make it universal. Findings from AWS can guide cloud governance thinking, yet they should be adapted when applied to smaller providers, private cloud environments, hybrid systems, or organizations with limited cloud maturity.

The study also needs to avoid a common weakness in technology research: admiration for capability without attention to use. A cloud platform can offer hundreds of services, but the management question is whether customers can operate the services safely. A platform can provide strong tools, but a team can still misconfigure them. A provider can offer global infrastructure, but a customer can still build a workload with a single point of failure. Technology creates possibility. Governance decides whether possibility becomes dependable service.

The quantitative section is strongest when read in that spirit. The availability calculation, queueing example, capacity-use calculation, mean response time, and service-quality index are not ornaments. They teach managers how to read service pressure before customers experience it as failure. The corrected index values also matter. If the mathematics are loose, the governance argument weakens. A paper that argues for measurement has to respect its own calculations.

Finally, publication readiness requires the language of service quality to remain plain. Cloud governance is often buried under technical vocabulary. This paper keeps returning to the customer experience: whether the service is available, whether support responds, whether costs are explainable, whether security is credible, whether recovery is tested, and whether leaders understand the risks they have accepted. That focus is what makes the case a management study rather than a technology description.

8.10 Implementation Sequence for Cloud Customers

Cloud customers often struggle because governance work is introduced after the workload is already live. A better sequence begins before migration or launch. The first step is to identify the business process the workload supports and the harm that would follow if the service failed, slowed, exposed data, or became too expensive to sustain. That conversation should include the business owner, technology owner, security lead, finance partner, and service users. Without that early view, the technical team may design for availability while the business assumes a different recovery promise.

The second step is to define operating evidence. A business-essential workload should not move into production without a documented owner, recovery objective, monitoring plan, backup validation, access model, cost alert, and support route. The evidence does not need to be elaborate. It needs to be current and usable. A one-page workload control record can be more valuable than a long policy that no one reads during pressure. The question is whether a responsible manager can find the answer quickly when something goes wrong.

The third step is to test before trust is claimed. Backup restoration, failover, privileged-access review, support escalation, and incident communication should be practiced before a serious event. Many organizations discover during incidents that a backup exists but cannot be restored quickly, that a dashboard shows technical health but not business impact, or that no one knows who should authorize a customer update. Testing exposes these gaps while there is still time to correct them.

The fourth step is to review cost and security together. A cloud service that is cheap because it lacks resilience may become expensive during failure. A workload that is secure but overbuilt may become financially unsustainable. Governance should not force a false choice between discipline and agility. It should make trade-offs visible. If leaders choose lower cost and slower recovery for a low-risk workload, that may be reasonable. If the same choice is made silently for a public-facing business-essential service, the organization has accepted risk without owning it.

The fifth step is to return to the workload after launch. Cloud environments change. Teams add services, permissions drift, data volumes grow, new dependencies appear, and usage patterns shift. A workload that was low risk during development may become high-impact once customers depend on it. Periodic review is therefore part of service quality. It protects the organization from assuming that yesterday’s design still matches today’s risk.

The sixth step is to make exceptions visible. Cloud teams sometimes accept temporary weaknesses because delivery pressure is real. A recovery test is deferred. A cost tag is missing. A privileged role is left open because a project deadline is close. These exceptions may be defensible for a short period, but they should not disappear into routine work. An exception register allows leaders to see which risks are temporary, who accepted them, and when they must be closed. Without that discipline, temporary choices become permanent exposure.

The final step is to connect workload review to board-level assurance. Executives do not need every technical detail, but they do need to know whether business-essential services have owners, tested recovery, cost visibility, security evidence, and incident communication plans. A board report that states cloud services are operating normally is too weak if it does not show the condition of the controls. Assurance should tell leaders where the organization is ready, where risk has been accepted, and where action is overdue.

8.11 Final Governance Position

The AWS case supports a sober professional standard. Cloud quality is not purchased once from a provider. It is produced repeatedly through decisions made by the provider and by the customer. AWS may supply infrastructure, managed services, documentation, service commitments, security tools, and operational guidance. The customer still decides how workloads are built, secured, monitored, funded, recovered, and explained.

This standard is not hostile to cloud adoption. It is the condition that makes cloud adoption responsible. Organizations gain speed and scale from cloud services, but speed and scale need operating discipline. Without that discipline, cloud dependency becomes quiet exposure. Systems work until they do not. Costs look manageable until they spike. Recovery plans appear adequate until someone has to use them. Shared responsibility seems clear until an incident proves that no one translated it into work.

A publication-ready view of cloud service quality must therefore hold two ideas together. The provider’s capability matters, and the customer’s governance matters. A strong platform can be weakened by poor configuration. A careful customer can still be affected by provider-side disruption. Service quality is created in the relationship between the two.

The final professional position is straightforward. Cloud enterprises sustain trust when availability, security, performance, communication, cost visibility, recovery, and customer readiness are governed together. A narrow uptime promise is not enough. A dashboard without interpretation is not enough. A shared responsibility model without evidence is not enough. Cloud service quality becomes credible when leaders can show who owns the workload, what risks have been tested, which controls are working, and how the organization will protect customers when normal operation is interrupted. The standard is practical: quality has to be demonstrable before customers are asked to depend on it.

References

Amazon.com, Inc. (2026). 2025 annual report. Amazon.com, Inc.

Amazon Web Services. (2022). Amazon Compute Service Level Agreement. Amazon Web Services.

Amazon Web Services. (2024a). AWS Well-Architected Framework: Operational Excellence Pillar. Amazon Web Services.

Amazon Web Services. (2024b). AWS Well-Architected Framework: Reliability Pillar. Amazon Web Services.

Amazon Web Services. (2025). AWS Service Level Agreements. Amazon Web Services.

Beyer, B., Jones, C., Petoff, J., & Murphy, N. R. (Eds.). (2016). Site reliability engineering: How Google runs production systems. O’Reilly Media.

Forsgren, N., Humble, J., & Kim, G. (2018). Accelerate: The science of lean software and DevOps. IT Revolution.

Google Cloud DORA. (2024). Accelerate state of DevOps report 2024. Google Cloud.

International Organization for Standardization. (2023). ISO/IEC 25010:2023 systems and software engineering — Systems and software Quality Requirements and Evaluation (SQuaRE) — Product quality model. ISO.

Kleppmann, M. (2017). Designing data-intensive applications: The big ideas behind reliable, scalable, and maintainable systems. O’Reilly Media.

National Institute of Standards and Technology. (2022). Secure Software Development Framework (SSDF) version 1.1: Recommendations for mitigating the risk of software vulnerabilities (NIST SP 800-218). U.S. Department of Commerce. https://doi.org/10.6028/NIST.SP.800-218

Parasuraman, A., Zeithaml, V. A., & Berry, L. L. (1988). SERVQUAL: A multiple-item scale for measuring consumer perceptions of service quality. Journal of Retailing, 64(1), 12–40.

The Thinkers’ Review

Catholic Secondary Education in Nigeria

Catholic Secondary Education in Nigeria

Mission Fidelity, Academic Quality, Safeguarding, and School Stewardship Under Constraint

Research Publication by Kenneth A.C. Nwaimo

Institutional Affiliation: New York Center for Advanced Research (NYCAR)

Publication No.: NYCAR-TTR-2026-RP048

DOI: https://doi.org/10.5281/zenodo.20581862

Date: June 2026

Copyright © 2026 New York Center for Advanced Research (NYCAR) and Kenneth A.C. Nwaimo. All rights reserved.


Peer Review and Publication Statement:

Approved for NYCAR’s June 2026 institutional publication release following doctoral-level review for philosophy-of-education coherence, Catholic education relevance, Nigerian contextual grounding, source discipline, APA 7 presentation, diagnostic-model suitability, and professional readability. Independent reviewers also examined the research for conceptual depth, learner-dignity clarity, teacher-formation relevance, safeguarding seriousness, and public-trust value. The research is recommended for NYCAR publication.


Abstract

Catholic secondary education in Nigeria carries a demanding public responsibility because it must do more than prepare students for examinations. It must form young people in faith, conscience, discipline, intellectual seriousness, civic responsibility, and service while operating in a national school environment strained by insecurity, learning poverty, teacher instability, household financial pressure, digital inequality, examination pressure, weak public infrastructure, and growing concern about child protection. A successful Catholic secondary school in Nigeria is therefore not simply a school that produces high grades or attractive buildings. It is a governed educational community where Catholic identity, curriculum fidelity, teaching quality, safeguarding, parent partnership, financial discipline, student welfare, and measurable learning all hold together.

The research treats Catholic secondary school leadership as a moral and intellectual work of mission stewardship. Catholic identity is not reduced to prayer assemblies, uniforms, or religious symbols; nor is academic quality reduced to examination results. The central educational responsibility is to make faith formation, intellectual formation, safeguarding, affordability, teacher formation, and school improvement mutually reinforcing rather than competing obligations. Nigeria’s educational context makes that challenge urgent. UNICEF has reported millions of primary and junior secondary age children out of school, serious deficits in basic literacy and numeracy, and documented attacks affecting schools in parts of the country. Catholic schools cannot repair the national system alone, but they can model reliable practice where management is honest, pastoral, evidence-conscious, and locally accountable.

The analysis draws on Catholic educational teaching, Nigerian education policy sources, public information from Catholic and Jesuit secondary schools, UNICEF and World Bank education evidence, NERDC curriculum materials, the Catholic Secretariat of Nigeria’s education summit agenda, and safe-school guidance. Loyola Jesuit College Abuja and Jesuit Memorial College Port Harcourt are used as practical Nigerian Catholic reference cases, not as perfect templates. Comparative lessons are also drawn from the Cristo Rey work-study model and wider Catholic school identity materials to examine affordability, career exposure, and whole-person formation.

The paper develops a Catholic Secondary School Success Index, a teacher-stability risk equation, a safeguarding and school-safety exposure model, a learning-reliability model, and a family-affordability stress score. These tools are not presented as universal formulas. They are decision aids for bishops, proprietors, principals, boards, diocesan education secretariats, and school leaders who need to know whether their Catholic school is succeeding beyond reputation. The conclusion is direct: Catholic secondary education in Nigeria succeeds when mission becomes visible in classroom quality, student protection, teacher competence, moral formation, credible governance, careful finance, and a school culture where families can trust both the learning and the character being formed.

Keywords: Catholic education, secondary schools, Nigeria, school stewardship, safeguarding, teacher formation, Catholic identity, school leadership, learning outcomes, affordability, NYCAR

Contents


List of Tables

List of Figures

References

List of Tables

Table 1. Major challenges and management responses for Catholic secondary schools in Nigeria.

Table 2. Catholic Secondary School Success Index components.

Table 3. Case-study lessons for Nigerian Catholic secondary education.

Table 4. Three-year implementation sequence.

Table 5. Annual school review evidence checklist.

List of Figures

Figure 1. Pressure profile for Catholic secondary education in Nigeria.

Figure 2. Catholic Secondary School Success Index component weights.

Figure 3. Intervention priorities by urgency and management controllability.

Figure 4. Three-year Catholic secondary school improvement sequence.


Chapter 1: Introduction

Catholic secondary education in Nigeria cannot be treated as a soft extension of parish life or as a private version of government schooling with religious language attached. It carries a heavier burden. Parents send children to Catholic schools expecting academic seriousness, discipline, moral formation, safety, and some evidence that the school will not lose its soul while chasing examination rankings. Bishops and proprietors expect schools to serve evangelization and social development. Students expect a place where hard work has meaning and where adult authority is not arbitrary. Those expectations are legitimate, but they are difficult to meet under Nigerian conditions.

The pressure on secondary schools is not abstract. It appears in rising fees, teacher turnover, security anxieties, boarding supervision, parents struggling to pay in a difficult economy, students arriving with uneven literacy foundations, internet access that varies by household, and the pressure of external examinations. It also appears in the quieter moral questions: whether students are treated with dignity, whether corporal discipline has been replaced by wise formation, whether safeguarding files are current, whether weak students are supported before they are dismissed as unserious, and whether the Catholic identity of the school survives daily management choices.

This research is written for those responsible for Catholic secondary schools in Nigeria: bishops, diocesan education directors, religious congregations, principals, board members, chaplains, teachers, finance committees, parent associations, alumni groups, and serious researchers. It does not romanticize Catholic schooling. It assumes that Catholic education is credible only when it can be inspected in ordinary school life: classrooms, records, timetables, dormitories, staff meetings, fee policies, assessment evidence, liturgy, discipline, counseling, and parent communication.

1.1 Background to the Study

Nigeria’s secondary school system sits within a severe national education problem. UNICEF reported in September 2024 that 10.2 million children of primary school age and 8.1 million children of junior secondary school age were out of school, while 74 percent of children aged 7 to 14 lacked basic reading and mathematics skills (UNICEF Nigeria, 2024). Those figures do not describe only public schools. They describe the social environment in which Catholic schools recruit students, train teachers, engage families, and decide whether their mission will serve only families who can already afford quality or also vulnerable learners who need a credible pathway into formation and achievement.

Secondary schooling also sits at the point where earlier educational weakness becomes difficult to hide. A child who passed through weak primary instruction may arrive in junior secondary school without fluent reading, confident numeracy, disciplined study habits, or enough English language command to cope with science, mathematics, civic education, literature, and religious studies. Catholic school leaders can pretend that admission screening protects them from this problem, but that answer is too narrow for the mission. A Catholic school may be selective, but it cannot become indifferent to national learning failure.

The Nigerian curriculum context gives Catholic schools both obligation and room for leadership. The National Policy on Education sets out the state’s expectation that education should support national development, character, citizenship, and useful living (Federal Republic of Nigeria, 2013). The Nigerian Educational Research and Development Council (NERDC) provides curriculum materials for junior and senior secondary schooling, including the revised senior secondary curriculum resources (NERDC, n.d.). Catholic schools must meet these national requirements while adding a distinctive account of the person, moral responsibility, faith, service, and community. That double obligation requires careful management.

Catholic educational teaching deepens the point. The Vatican instruction on the identity of the Catholic school describes Catholic schools as historically responsive institutions called to serve present conditions while remaining faithful to Catholic identity (Congregation for Catholic Education, 2022). Pope Francis’s Global Compact on Education insists that education must be renewed around the person, the poor, the family, women, young people, ecology, and solidarity (Francis, 2020). A Nigerian Catholic secondary school should therefore be neither a narrow exam factory nor an unfocused faith environment. It must teach well and form well.

1.2 Problem Statement

The main problem is not that Catholic secondary schools in Nigeria lack mission language. Many have beautiful mottos, chapels, assemblies, feast-day celebrations, alumni pride, and discipline codes. The harder problem is whether these symbols are supported by institutional disciplines strong enough to deliver good education under pressure. A school can proclaim Catholic identity and still manage teachers poorly. It can demand discipline and still lack a child protection system. It can advertise excellence and still hide weak support for struggling learners. It can celebrate alumni success and still price itself away from the poor.

Private and faith-based schools often weaken in recognizable ways. Some depend too heavily on the personality of a strong principal instead of building durable habits of governance. Financial decisions may become reactive, driven by fee arrears, salary pressure, emergency repairs, and parent complaints rather than careful stewardship. Teachers may be expected to embody Catholic education without sustained formation, coaching, mentoring, or professional respect. Student welfare may also be narrowed to discipline while counseling, safeguarding, mental health, boarding supervision, and adolescent formation remain fragile.

The national setting compounds the problem. Insecurity has directly affected schooling in parts of Nigeria. UNICEF’s 2024 warning about school protection noted documented incidents in 2022 and 2023 and school closures in parts of Borno, Adamawa, and Yobe due to insecurity (UNICEF Nigeria, 2024). Even Catholic schools outside those highest-risk zones must treat safety as a serious governance responsibility. Boarding schools, in particular, cannot rely on reputation or prayer alone. They require risk assessment, visitor control, dormitory supervision, emergency communication, transport safety, and clear accountability.

There is also a moral problem of affordability. Catholic education historically served the poor as well as the aspiring middle class. Yet many Nigerian Catholic secondary schools now struggle with the cost of salaries, infrastructure, boarding, security, examination fees, technology, compliance, and facility maintenance. If a Catholic school raises fees without a scholarship plan, it may become financially stable while morally narrower. If it keeps fees low without paying teachers or maintaining safety, it may become accessible but weak. Successful leadership must handle this tension rather than hide it.

1.3 Aim and Objectives

The aim of this doctoral-level research is to examine how Catholic secondary schools in Nigeria can be run successfully under contemporary constraints while remaining faithful to Catholic identity, national curriculum expectations, child protection requirements, academic rigor, and social responsibility. Success is defined as more than prestige. It includes mission credibility, learning reliability, teacher stability, student safety, affordability, governance discipline, and measurable improvement.

The objectives are to clarify the distinctive management responsibilities of Catholic secondary schools in Nigeria; review Catholic educational principles and Nigerian education evidence; examine the operational challenges facing school leaders; analyze practical lessons from existing Catholic school models and relevant international cases; develop quantitative tools for school diagnosis; and offer a staged implementation plan that dioceses, religious proprietors, school boards, and principals can adapt to their context.

The paper does not pretend that one model can fit every Nigerian Catholic school. A rural day school, an urban boarding school, a diocesan school, a congregation-owned school, and a low-fee mission school do not carry identical conditions. The argument is that all of them need a disciplined management core: clear mission, competent teaching, safe systems, transparent finance, family partnership, teacher formation, student support, and evidence of learning.

1.4 Research Questions

Five research questions guide the research. How should a successful Catholic secondary school in Nigeria be defined beyond examination success and reputation? Which management conditions allow Catholic identity, academic quality, safeguarding, and affordability to support one another? How can school leaders measure whether learning, formation, safety, teacher stability, and parent trust are improving? What practical lessons can be drawn from Nigerian Catholic school cases and wider Catholic education practice? What staged plan can help school leaders strengthen their institutions without overwhelming staff or families?

The questions are intentionally practical. Catholic school leadership is not a matter for abstract praise. It is a matter of decisions: whom to hire, how to form teachers, how to assign chaplaincy, how to supervise dormitories, how to support struggling students, how to set fees, when to grant scholarship aid, what data to review, how to report safety concerns, how to involve parents, and how to protect the dignity of adolescents in a demanding environment.

1.5 Significance of the Study

This study matters because Catholic secondary schools continue to influence Nigerian family aspiration, moral formation, university preparation, and local leadership. Many graduates of Catholic schools become professionals, clergy, religious, public servants, entrepreneurs, teachers, and civic leaders. A weak Catholic school therefore does more than disappoint parents. It weakens a pipeline of conscience and competence that Nigeria badly needs.

The study also matters because Catholic schools stand at the intersection of Church credibility and public trust. When a Catholic school is well run, people see faith working through order, seriousness, compassion, and competence. When it is poorly run, people see religious language failing to protect students, support teachers, or tell the truth about performance. The credibility of the Church’s educational mission depends on everyday management more than on promotional materials.

For NYCAR, the contribution lies in turning Catholic school success into a serious institutional question. The research offers leaders diagnostic models, case analysis, and management recommendations without reducing Catholic education to corporate technique. It insists that mission and management belong together because young people are harmed when they are separated.

Figure 1. Pressure profile for Catholic secondary education in Nigeria.

Chapter 2: Literature Review

The literature relevant to Nigerian Catholic secondary education sits across several bodies of evidence: Catholic educational teaching, Nigerian education policy, global education data, safe-school practice, teacher development, school governance, adolescent welfare, and school finance. Treating these sources separately produces weak guidance. A principal does not experience them separately. Each morning, curriculum, teacher attendance, student discipline, fee arrears, worship, child protection, examinations, and parent concerns arrive together.

This review therefore reads the sources through the formation question: what must Catholic secondary school leaders do so that mission becomes reliable practice? The answer cannot be borrowed from one tradition alone. Catholic identity supplies the meaning of the school. Nigerian policy supplies national obligations. Education evidence supplies the warnings. Existing Catholic school cases show practical possibilities. Governance and diagnostic instruments help leaders examine whether the school is truly improving.

2.1 Catholic School Identity and Nigerian Context

Catholic school identity begins from a view of the human person. Education is not only training for employment or examination success. It is formation in truth, conscience, relationship, worship, service, and responsibility. The Vatican’s 2022 instruction on Catholic school identity emphasizes that Catholic schools must respond to changing social and cultural conditions while remaining faithful to their identity (Congregation for Catholic Education, 2022). That balance matters in Nigeria because schools cannot ignore insecurity, digital change, family pressure, plural religious environments, or employment uncertainty.

The Nigerian Catholic secondary school cannot preserve identity by retreating from national realities. It must teach the national curriculum, prepare students for public examinations, respond to technology, engage families across social classes, and interact with public authorities. At the same time, it should resist becoming only a private success machine. Catholic education loses something essential when it forms students to compete without forming them to serve.

Pope Francis’s Global Compact on Education strengthens this critique by placing the person, the family, the poor, women, young people, and ecological responsibility at the center of educational renewal (Francis, 2020). In Nigeria, those commitments translate into concrete school questions. Are girls protected and encouraged? Are poorer families visible in the school’s financial design? Are students learning civic responsibility and care for creation? Are parents partners rather than fee payers only?

2.2 National Policy, Curriculum, and Secondary School Expectations

The National Policy on Education remains an important point of reference because it defines education as a national development project, not only a private family service (Federal Republic of Nigeria, 2013). Secondary education is expected to prepare young people for useful living, higher education, citizenship, technical awareness, moral development, and social participation. Catholic schools may add explicit faith formation, but they do not stand outside these national obligations.

NERDC’s curriculum materials for junior and senior secondary education provide the formal content structure within which schools operate (NERDC, n.d.). A Catholic secondary school must therefore combine curriculum fidelity with formative depth. It should not use Catholic identity as an excuse for weak laboratory work, poor mathematics teaching, unstructured entrepreneurship education, or superficial civic education. Equally, it should not treat religious education as a ceremonial add-on while other subjects receive serious instructional attention.

Curriculum implementation is where many schools weaken. A syllabus may exist, but lesson planning, teacher mastery, assessment design, laboratory access, reading support, and feedback routines determine what students learn. Catholic school leaders need to inspect not only whether subjects are offered, but whether students are gaining competence in reading, writing, mathematics, science, digital literacy, moral reasoning, and communication.

2.3 Learning Poverty and the Secondary School Burden

UNICEF’s 2024 report that 74 percent of Nigerian children aged 7 to 14 lacked basic reading and mathematics skills should disturb secondary school leaders (UNICEF Nigeria, 2024). By secondary school, weak foundations become expensive. Students may memorize notes without understanding, avoid mathematics, read slowly, copy assignments, rely on lesson teachers, or pass through promotion systems without genuine mastery. A Catholic school that wants high examination results must still confront the foundation problem honestly.

The World Bank’s 2022 learning poverty update placed Sub-Saharan Africa’s rate near nine in ten children, underscoring the seriousness of basic reading failure across the region within which Nigeria sits (World Bank, 2022). Although learning poverty is measured at primary level, its effects reach secondary education. Teachers in JSS and SSS classrooms often face students whose age and class placement suggest readiness, while their literacy and numeracy skills say otherwise. Successful Catholic school stewardship must therefore build early diagnostic testing and remedial support into the first year of secondary school.

This is where Catholic education should show pastoral intelligence. A student who struggles academically should not be treated only as lazy, stubborn, or unsuitable for the school. Some students need structured reading support, numeracy catch-up, language development, study skills, counseling, and family engagement. Mercy does not mean lowering standards. It means refusing to confuse weak foundations with weak character.

2.4 Teacher Quality, Formation, and Stability

No Catholic school can outperform the quality and stability of its teachers for long. A strong mission statement cannot compensate for poor instruction. A beautiful chapel cannot teach algebra. Discipline cannot repair weak feedback. Teacher formation is therefore central to Catholic school success. The school must form teachers spiritually, professionally, and relationally.

Teacher pressure in Nigeria is intensified by inflation, migration, private tutoring markets, delayed salaries in some contexts, and competition from better-paying sectors. Catholic schools may expect teachers to be missionaries, but they should not use missionary language to excuse poor employment practice. A teacher who is underpaid, unsupported, overworked, and excluded from decision-making is unlikely to sustain excellent teaching. Recent Nigerian analysis ties these pressures to chronic teacher shortages and rising attrition, with pupil–teacher ratios well above recommended levels and several states failing to recruit teachers for years at a time (Athena Centre for Policy and Leadership, 2025).

Catholic school leaders should distinguish between teacher spirituality and teacher competence. Both matter. A teacher may be devout and poor at classroom explanation. Another may be academically strong but dismissive of adolescent dignity. Formation must include lesson design, assessment, classroom management, adolescent psychology, child protection, Catholic identity, use of technology, and professional ethics. The Catholic school teacher is not only a subject deliverer. The teacher is a witness, but witness without competence weakens trust.

2.5 Safeguarding, School Safety, and Boarding Welfare

School safety has become a national concern. UNICEF’s 2024 warning linked Nigeria’s education crisis to attacks on schools, documenting incidents in 2022 and 2023 and closures in Borno, Adamawa, and Yobe due to insecurity (UNICEF Nigeria, 2024). The Safe Schools Declaration sets out commitments to protect education from attack and sustain education during armed conflict (Safe Schools Declaration, 2015). At the national level, the Federal Ministry of Education has issued the National Policy on Safety, Security and Violence-Free Schools, with implementing guidelines that set a zero-tolerance standard for violence, bullying, and gender-based abuse and require school-level safety planning, prevention, and response (Federal Ministry of Education, 2021). This gives Nigerian schools, including Catholic ones, a concrete framework against which to test their own safeguarding arrangements rather than relying on goodwill. A Catholic secondary school in Nigeria must take such guidance seriously, even when located outside the most affected zones.

Safeguarding is broader than physical security. It includes protection from abuse, bullying, harmful punishment, sexual misconduct, neglect, emotional humiliation, unsafe transport, poor boarding supervision, and unreported incidents. A boarding school carries special responsibility because students live under institutional authority day and night. Dormitory supervision, medical care, visitor controls, food safety, bathing privacy, nighttime protocols, and complaint pathways are not minor administrative details.

Catholic schools must also handle discipline carefully. Discipline is necessary; humiliation is not. Formation requires boundaries, consequences, restitution, mentoring, and spiritual guidance. Where discipline depends on fear, secrecy, or arbitrary punishment, the school may produce compliance but not conscience. Catholic safeguarding should make it safe for a student to report harm without being accused of attacking the school’s reputation.

2.6 Finance, Affordability, and the Poor

Catholic schools face a hard financial equation. They must pay teachers, maintain facilities, secure campuses, support boarding, provide laboratories, fund chaplaincy, train staff, manage technology, and support indigent students. These costs are real. Yet Catholic education has a duty to remain connected to families who are not wealthy. Affordability is therefore not a public relations issue. It is a mission test.

The Catholic Secretariat of Nigeria’s 2024 Education Summit agenda included themes such as vulnerable persons in inclusive Catholic education, funding models, strategic partnerships, indigenous languages, artificial intelligence, and the Nigerian context of the Global Compact on Education (Nigeria Catholic Network, 2024). That agenda shows that Nigerian Church leadership understands the financial and social questions. The task is to translate summit conversation into school-level practice.

Scholarship policy is essential. A school that gives discounts informally may help some families, but it may also create resentment, favoritism, or hidden financial strain. A transparent scholarship fund, alumni bursary, parish-supported aid scheme, or work-linked support model may help schools preserve mission without destabilizing budgets. The Cristo Rey model, where students combine college-preparatory Catholic schooling with structured work experience to support access, is not directly transferable to every Nigerian setting, but its financial imagination is worth studying (Cristo Rey Network, n.d.).

2.7 Governance, Boards, and School Accountability

Catholic school governance often depends on the proprietor, principal, chaplain, religious congregation, board, parent association, and finance structure. When these roles are unclear, tension follows. A principal may carry responsibility without authority. A board may meet without evidence. A parish may influence the school informally without accountability. Parents may complain loudly but lack a structured channel. Teachers may experience decisions as sudden or personal.

Good governance does not make a school less Catholic. It makes mission more trustworthy. Decisions about fees, admissions, discipline, safeguarding, staffing, procurement, curriculum support, and capital projects should be recorded and reviewed. A Catholic school that cannot explain decisions invites suspicion even where leaders are honest. The same principle appears in Catholic governance work more broadly: stewardship must be visible enough to be trusted.

Boards and education committees should receive evidence, not only speeches. They should review learning outcomes, teacher retention, student welfare, safeguarding reports, fee arrears, scholarship use, parent complaints, alumni support, and facility risk. A board that only praises the principal is not governing. A board that only criticizes without helping solve constraints is also weak.

2.8 Digital Learning and Equity

Digital tools are now part of school operation: admissions, fees, records, communication, assignments, examination preparation, library access, lesson delivery, and parent engagement. But digital readiness varies widely among families and schools. The Nigerian Catholic school should avoid two errors. One error is rejecting technology as morally dangerous. The other is adopting technology without asking who is excluded.

Digital learning should begin with modest reliability: accurate student records, secure fee records, accessible parent communication, teacher lesson resources, digital safeguarding logs, and basic learning support. A school does not need to announce artificial intelligence before it can manage attendance, grade tracking, library use, reading support, and parent alerts properly. Technology should solve real school problems before it becomes a status symbol.

Digital equity also has a Catholic dimension. If assignments require online access that some students do not have, the school may widen inequality. If fee payment systems work only for banked parents with stable connectivity, poorer families may be embarrassed. If digital communication replaces human counseling, vulnerable families may disappear. Successful Catholic schools use technology to strengthen relationship, not to remove it.

2.9 Case Evidence and Practice Literature Gap

The Nigerian Catholic school cases available publicly offer useful but limited lessons. Loyola Jesuit College Abuja describes itself as a co-educational full boarding secondary school in the Jesuit tradition, opened in 1996, with teaching and supervision by Jesuits, the Sisters of the Holy Child Jesus, and lay staff (Loyola Jesuit College, n.d.). That case is useful because it shows the strength of a clear school tradition, boarding design, staff collaboration, and academic seriousness. It should not be treated as a simple template for all Catholic schools because cost, location, staffing, and infrastructure differ.

Jesuit Memorial College Port Harcourt presents itself through themes of whole-person education, faith, dialogue, curiosity, and excellence in the Ignatian tradition (Jesuit Memorial College, n.d.). The language matters because it resists a narrow view of schooling as examination preparation. A Catholic secondary school in Nigeria must form imagination, conscience, service, and intellectual competence together. The question is how to manage that formation under pressure.

The literature gap lies in integration. Catholic identity documents rarely provide Nigerian school stewardship tools. Nigerian education policy rarely addresses Catholic mission. School safety guidance may not speak to faith formation. Finance discussions may not address safeguarding. This paper responds by building a single success model for Catholic secondary education in Nigeria that joins mission, learning, safeguarding, staffing, finance, parent trust, and implementation.

Table 1. Major challenges and management responses for Catholic secondary schools in Nigeria.

Challenge Operational risk Required Catholic management response
Insecurity and school safety Learning disruption, parent fear, boarding exposure Risk review, visitor control, emergency communication, safe-school partnerships, student reassurance
Teacher instability Weak learning continuity, loss of school culture Fair employment, induction, mentoring, appraisal, formation, and career pathway
Affordability pressure Exclusion of poorer families and fee conflict Transparent budgeting, scholarships, alumni aid, payment plans, and cost discipline
Learning deficits Promotion without mastery and examination failure Baseline testing, reading support, mathematics recovery, feedback, and honest assessment
Safeguarding weakness Harm to students and loss of ecclesial trust Training, reporting channels, records, supervision, background checks, and survivor-sensitive response


Chapter 3: Methodology and Diagnostic Instruments

The methodology is documentary, integrative, and applied. It reviews Catholic educational teaching, Nigerian education evidence, public case information, safe-school guidance, and school stewardship concerns. It does not claim field interviews, proprietary school records, or confidential diocesan data. Its contribution is to convert available sources into a practical model that school leaders can use for self-examination and improvement.

A purely descriptive paper would not be enough because Catholic schools need tools, not only principles. The diagnostic instruments in this chapter do not pretend to measure grace, vocation, or conscience. They measure institutional conditions that can be observed: teacher stability, learning support, safeguarding, finance, family partnership, data use, and school improvement. The instruments serve prudential judgment; they do not replace it.

3.1 Research Design

The research design is appropriate for a doctoral-level institutional paper because the subject crosses theology, education management, public policy, child protection, finance, and school practice. The sources are read not as isolated authorities but as evidence for school leadership. The question is not whether Catholic education is good in principle. The question is how it can be run well in Nigeria under constraint.

The analytical procedure follows a coherent path rather than a mechanical sequence. The research identifies the national and ecclesial demands placed on Catholic secondary schools, examines public case evidence from Nigerian Catholic schools and relevant international Catholic models, develops diagnostic instruments for school self-examination, and proposes a staged renewal plan for proprietors, principals, boards, and diocesan education offices.

The design is intentionally modest about data. It does not rank schools or claim secret evidence. It offers a method that any serious Catholic school can adapt: gather local data, score the domains, discuss the results with responsible leaders, choose three priorities, and review progress annually.

3.2 Catholic Secondary School Success Index

The Catholic Secondary School Success Index, abbreviated CSSSI, is a diagnostic tool for assessing whether a Catholic secondary school is strong across the domains that matter. The proposed formula is: CSSSI = 0.14MI + 0.16IQ + 0.13TS + 0.14SG + 0.11FD + 0.11SS + 0.08DU + 0.07FP + 0.06FR − 0.10CR. MI represents mission identity, IQ instructional quality, TS teacher stability, SG safeguarding, FD financial discipline, SS student support, DU data use, FP family partnership, FR facilities readiness, and CR contextual risk. Each component is scored from zero to one hundred.

The weight for instructional quality is highest because a school that does not teach well cannot defend its success with religious language. Mission identity and safeguarding are also heavily weighted because Catholic education has no credibility if formation is vague or children are unsafe. Teacher stability matters because learning quality and student culture depend on adults who remain long enough to know the school and its students. Contextual risk is subtracted because insecurity, severe poverty, infrastructure weakness, and local instability can reduce performance even when the school is well led.

The index should not be used for public ranking. It is an internal improvement tool. A school that scores low in student support should not be shamed; it should be helped. A school that scores high should not become complacent; it should inspect whether evidence supports the score. The point is to discipline conversation so that leaders stop relying only on reputation, anecdote, or examination results.

Table 2. Catholic Secondary School Success Index components.

Component Weight Evidence question
Mission identity 0.14 Is Catholic formation visible in decisions, routines, discipline, service, and graduate expectations?
Instructional quality 0.16 Are students learning through strong teaching, feedback, assessment, and support?
Teacher stability 0.13 Can the school retain competent teachers and form them professionally?
Safeguarding 0.14 Are children protected through policy, training, supervision, and reporting?
Financial discipline 0.11 Does the budget support mission, salary reliability, scholarships, and maintenance?
Student support 0.11 Are adolescents supported through counseling, mentoring, chaplaincy, and welfare care?
Data use 0.08 Does leadership review reliable evidence rather than reputation alone?
Family partnership 0.07 Are parents treated as co-educators through clear communication and boundaries?
Facilities readiness 0.06 Are classrooms, boarding, laboratories, water, sanitation, and safety maintained?
Contextual risk (penalty) −0.10 Does scoring account for insecurity, severe poverty, infrastructure weakness, and local instability that can depress performance even under good leadership?

Figure 2. Catholic Secondary School Success Index component weights.

3.3 Teacher Stability Risk Equation

Teacher stability can be estimated through a simple risk equation: TSR = SalaryStress + WorkloadPressure + FormationGap + LeadershipDistrust + HousingTransportBurden + CareerPathWeakness − MissionCommitment − ProfessionalSupport. A higher score indicates greater risk that teachers will leave, disengage, or perform below their ability. The equation reflects a practical truth: teacher turnover is rarely caused by money alone, though money matters.

A Catholic school that wants stable teachers should examine salary timing, workload, lesson preparation time, classroom resources, professional respect, principal feedback, spiritual formation, mentoring, and promotion possibilities. Teachers may remain in a school because they believe in the mission, but mission commitment should not be exploited. Catholic leadership must not demand sacrifice from teachers while avoiding fair employment practice.

This model is especially useful for diocesan education offices supervising multiple schools. If several schools report teacher instability, the problem may be systemic: salary bands, absence of teacher housing support, lack of induction, weak principal supervision, or poor professional formation. Treating each resignation as an individual problem hides institutional weakness.

3.4 Safeguarding and School-Safety Exposure Model

Safeguarding exposure can be modeled as SSE = ExternalThreat + StudentVulnerability + SupervisionGap + ReportingDelay + BoardingRisk + TransportRisk − ProtectiveControls − FormationQuality. The model is not a legal instrument. It helps school leaders think before harm occurs. In high-risk regions, external threat may dominate. In boarding schools, supervision and dormitory practice may be decisive. In day schools, transport and after-school movement may matter more.

Protective controls include trained safeguarding officers, written policies, background checks, visitor control, complaint channels, incident records, dormitory supervision, safe transport rules, emergency drills, and partnership with local security where necessary. Formation quality matters because adults and students must understand boundaries, dignity, reporting, and responsibility. A policy unknown to staff and students is weak protection.

The model should be reviewed at least once per term. Nigerian schools operate in changing conditions. A road that was safe last year may become risky. A boarding supervisor may leave. A new contractor may enter the campus. A student complaint may reveal a weak point. Successful school leadership treats safety as a living responsibility.

3.5 Learning Reliability Model

Learning reliability measures whether students are actually progressing, not only passing through the timetable. A possible model is LR = DiagnosticBaseline + TeachingQuality + FeedbackFrequency + RemediationIntensity + AssessmentIntegrity + ReadingSupport + NumeracySupport − PromotionPressure − ExamCramming. The negative terms matter. Promotion pressure and exam cramming can produce apparent progress while hiding weak understanding.

A Catholic school should establish baseline testing for new students, especially in reading, writing, and mathematics. It should track improvement by term, not only final grades. It should identify students at risk before external examinations. It should treat libraries, study halls, supervised prep, tutorial support, and teacher feedback as part of the learning system, not as decorations.

Assessment integrity is central. If internal assessments are too easy, copied, poorly marked, or inflated to satisfy parents, the school deceives itself. If assessments are punitive and unconnected to support, the school discourages weaker learners. The Catholic approach should be honest and remedial: tell the truth about performance, then help students improve.

3.6 Family Affordability Stress Score

Family affordability stress can be estimated as FASS = TuitionBurden + BoardingCost + TransportCost + ExaminationFees + UniformBookCost + EmergencyLevy − ScholarshipSupport − PaymentFlexibility − ParishAlumniAid. The model helps leaders see that fees are not the only cost. Parents may pay tuition but struggle with boarding supplies, transport, uniforms, textbooks, medical charges, or sudden levies.

A school should monitor fee arrears carefully without humiliating families. Patterns matter. If many good families are falling behind, the school should review cost design. If scholarship demand rises, the school should strengthen alumni giving, parish contributions, endowment planning, or targeted partnerships. A Catholic school that has no plan for affordability may slowly cease to be Catholic in social reach.

Payment flexibility must be governed. Informal arrangements made by private appeal can breed favoritism or confusion. A documented policy protects both families and school leaders. It allows compassion to be consistent rather than dependent on who knows whom.

3.7 Worked Example: Applying the Success Index

To show how the Catholic Secondary School Success Index works in practice, consider a hypothetical diocesan school scored by its leadership team across the ten domains, each rated from zero to one hundred. Suppose the school records mission identity at 78, instructional quality at 64, teacher stability at 55, safeguarding at 60, financial discipline at 70, student support at 52, data use at 40, family partnership at 66, facilities readiness at 58, and contextual risk at 65. These figures are illustrative, but they resemble the uneven profile many schools produce when they score themselves honestly rather than defensively, with reputation concentrated in a few visible domains and weakness hidden in the less visible ones.

Applying the weights gives the following contributions: mission identity 10.92, instructional quality 10.24, teacher stability 7.15, safeguarding 8.40, financial discipline 7.70, student support 5.72, data use 3.20, family partnership 4.62, and facilities readiness 3.48. These positive contributions sum to 61.43. The contextual-risk penalty, calculated as 0.10 multiplied by 65, removes 6.50 points. The resulting index is therefore 54.93, or roughly 55 on a scale where 100 would represent full strength across every domain with no contextual drag. Because the nine positive weights sum to one, the weighted positive total can never exceed 100, and the penalty term then expresses how much a hostile environment is pulling the school below its own internal performance.

The number itself matters less than what it exposes. The school’s reputation may rest on strong mission identity and sound finances, yet the index shows that data use, student support, and teacher stability are its weakest domains, and that a difficult local environment is subtracting meaningfully from its overall position. A leadership team reading this profile should resist both complacency and panic. The disciplined response is to choose three priorities, most plausibly data use, student support, and teacher stability, set measurable targets for each, and rescore after a defined period. Used this way, the index does not rank the school against others. It converts a vague sense that the school is doing well into a specific, improvable account of where mission is, and is not yet, visible in daily practice.

The example carries two cautions. The score is only as honest as the evidence behind each domain. If mission identity is rated 78 because the school has a chapel and a motto rather than because formation is documented in routines, service, and graduate expectations, the index will flatter the school and mislead its leaders. Each domain score should therefore be defended with the kind of evidence listed in the annual review checklist, not asserted from memory. The index is also most useful when it is repeated. A single score is a snapshot; a sequence of scores, gathered the same way each year, shows whether chosen priorities are actually moving and whether gains in one domain are quietly costing another. The discipline is not in producing a number but in returning to it, with the same seriousness, after the school has tried to improve.

Chapter 4: Case Studies and Nigerian Operating Lessons

Case studies in this chapter are used as practical school files. They are not advertisements and they are not evidence that one institution has solved all problems. Each case exposes a formation question relevant to Catholic secondary education in Nigeria: identity, formation, affordability, safe schooling, boarding, curriculum, and public trust.

The main Nigerian cases are Loyola Jesuit College Abuja, Jesuit Memorial College Port Harcourt, the Catholic Secretariat of Nigeria’s Education Summit, and the safe-schools policy environment. Comparative lessons are taken from the Cristo Rey model and Jesuit education’s graduate profile tradition. The goal is not to copy, but to learn what can be adapted.

4.1 Loyola Jesuit College Abuja

Loyola Jesuit College Abuja describes itself as a co-educational full boarding secondary school in the Jesuit tradition, opened with JSS 1 in 1996 and now serving students from JSS 1 to SSS 3, with supervision by Jesuits, the Sisters of the Holy Child Jesus, lay teachers, and staff (Loyola Jesuit College, n.d.). Several management lessons follow from that description. First, the school’s identity is not vague. It belongs to a tradition with defined educational habits. Second, boarding is treated as part of the school’s formation design, not only accommodation. Third, collaboration between religious and lay staff is built into the institutional description.

A Catholic school leader reading this case should resist superficial imitation. The lesson is not that every school must be full boarding or Jesuit. The lesson is that a successful Catholic school needs a recognizable educational tradition, disciplined supervision, and a shared adult culture. Students learn from routines as much as from classrooms. In a boarding school, routines include rising time, prayer, study, meals, recreation, hygiene, prep, dormitory order, counseling, liturgy, and supervised freedom.

The case also raises the question of scale. A school with a controlled enrollment can often preserve quality more easily than a school expanding without staff, facilities, or supervision. Nigerian Catholic schools under fee pressure may be tempted to increase intake beyond what their systems can carry. Successful leadership knows when growth threatens formation.

4.2 Jesuit Memorial College Port Harcourt

Jesuit Memorial College Port Harcourt presents itself around whole-person formation, faith, dialogue, curiosity, excellence, artistic expression, and service in the Ignatian tradition (Jesuit Memorial College, n.d.). That public language is significant because it refuses to reduce schooling to examination performance. A Catholic school should form mind, imagination, conscience, faith, and character together.

The practical lesson is that whole-person formation must be scheduled. Schools often say they educate the whole person while leaving arts, sports, counseling, service, and spiritual direction vulnerable to exam pressure. A truly Catholic timetable makes room for liturgy, formation, academic work, club life, sports, reading, service, and reflection. It also protects students from being treated as examination machines.

JMC’s public language of dialogue and reflection is also important in Nigeria’s plural society. Catholic secondary education should form students who can think, listen, disagree responsibly, and serve across religious and ethnic differences. Christian identity should deepen respect, not produce narrowness. Such formation must appear in classroom discussion, discipline, community service, and staff conduct.

4.3 Catholic Secretariat of Nigeria Education Summit

The Catholic Secretariat of Nigeria’s 2024 Education Summit was framed around the Global Compact on Education in the Nigerian context and included themes such as vulnerable persons in inclusive Catholic education, innovative funding, strategic partnerships, indigenous languages, artificial intelligence, digital division, and curriculum formulation (Nigeria Catholic Network, 2024). That agenda is valuable because it shows that Catholic education leaders in Nigeria are not unaware of the main pressures.

Summits, however, do not run schools. The practical question is what happens after the speeches. Diocesan education offices should translate summit themes into templates, training modules, finance guides, safeguarding checklists, scholarship models, language support plans, and digital readiness tools. A school principal facing fee arrears and teacher turnover needs more than a summit theme. He or she needs usable support.

The summit case points toward a national Catholic education data system. If dioceses and congregations collected comparable data on enrollment, fee arrears, scholarships, teacher retention, learning outcomes, safeguarding compliance, and examination performance, Church leadership could respond with better evidence. Without data, Catholic education planning remains dependent on isolated stories.

4.4 Safe Schools and Insecurity

Nigeria’s involvement in safe-school discussions matters because education has been directly affected by violence and school abductions. The Safe Schools Declaration commits states to protect education during armed conflict and restrict the military use of schools (Safe Schools Declaration, 2015). Catholic schools should read these materials not as government policy alone, but as practical guidance for their own risk planning.

The Catholic school safety question differs by region. A school in a high-risk zone may require perimeter security, transport coordination, emergency drills, risk communication, and close ties with local authorities. A school in a lower-risk area still needs safeguarding, visitor rules, medical response, fire safety, dormitory supervision, and data protection. All schools need a crisis communication plan that does not leave parents dependent on rumors.

Insecurity also affects learning indirectly. Parents may withdraw students, teachers may fear postings, boarding schools may face extra costs, and students may carry anxiety. Catholic schools should therefore integrate safety with pastoral care. A school that secures its gate but ignores students’ fear has not completed the task.

4.5 Cristo Rey and Affordability Imagination

The Cristo Rey Network in the United States uses a Catholic college-preparatory model in which students from families of limited means participate in structured work-study as part of the financing and formation of their education (Cristo Rey Network, n.d.). The model cannot simply be transplanted into Nigeria without legal, labor, cultural, and economic adaptation. Yet it challenges Nigerian Catholic schools to think more creatively about affordability and employability.

A Nigerian adaptation might not involve weekly corporate placements for all students. It could involve alumni-funded bursaries, supervised entrepreneurship projects, holiday internships for senior students, partnerships with Catholic hospitals and businesses, agricultural projects, technology clubs linked to local employers, or school-based enterprise that teaches responsibility without exploiting students. The deeper lesson is that affordability and formation can be connected if governed carefully.

Catholic schools should be careful here. Work-linked models must protect minors, avoid cheap labor, comply with law, preserve study time, and maintain dignity. But the idea that students can learn responsibility, workplace discipline, and social contribution while supporting access deserves serious thought in a country where many families struggle to pay fees.

Table 3. Case-study lessons for Nigerian Catholic secondary education.

Case Relevant lesson Nigeria adaptation caution
Loyola Jesuit College Abuja Clear Catholic tradition, boarding supervision, staff collaboration, and controlled learning environment Not every school can copy its cost, scale, location, or boarding model
Jesuit Memorial College Port Harcourt Whole-person formation through faith, dialogue, imagination, and excellence Public language must become timetable, staffing, counseling, and assessment practice
CSN Education Summit National Catholic attention to funding, vulnerable learners, indigenous languages, and digital division Summit themes must become templates, training, and diocesan follow-up
Safe Schools Declaration Protection of education requires preparation, risk review, and continuity planning Security practice must be localized by region and school type
Cristo Rey Network Affordability can be joined to work exposure and career formation Any Nigerian adaptation must protect minors and comply with law


Chapter 5: Formation-Centered Governance for Catholic Secondary Education

Running a successful Catholic secondary school in Nigeria requires more than a good principal. It requires a way of working that survives examination seasons, fee pressure, staff changes, security incidents, parent demands, and adolescent crises. The school must know what it is trying to form, how it will teach, how it will protect students, how it will pay teachers, how it will inspect learning, and how it will tell the truth about weakness.

This chapter sets out the practical domains of a successful school. They should be reviewed together because weakness in one area travels into others. Poor finance affects teacher stability. Teacher instability affects learning. Weak safeguarding damages trust. Weak parent communication increases conflict. Poor facilities affect safety. Weak Catholic identity turns the school into a private exam center.

5.1 Mission Identity That Can Be Observed

Catholic identity must be visible in more than names, statues, uniforms, and prayer routines. It should appear in how teachers treat weaker students, how discipline is handled, how fees are discussed, how students serve the poor, how staff are formed, how leaders speak when mistakes occur, and how the school handles truth. A chapel on campus is important, but the whole school must learn to live from what the chapel signifies.

A school should define its graduate profile. By graduation, what should a Catholic secondary school student know, love, practice, and resist? The answer should include academic competence, moral judgment, prayerful awareness, respect for human dignity, civic responsibility, digital prudence, service, and resilience. Jesuit education’s graduate profile tradition, often summarized around growth, intellectual competence, faith, love, and justice, offers one useful example of such specificity (Jesuit Schools Network, n.d.).

Mission review should be part of the school year. Leaders can ask: Are students participating meaningfully in liturgy and service? Are teachers able to explain the school’s Catholic purpose? Are discipline records consistent with human dignity? Are poorer students visible? Does the school’s academic culture form honesty, or does it tolerate cheating because results matter? Mission becomes credible when it can answer these questions.

5.2 Instructional Quality and Academic Reliability

A Catholic secondary school cannot call itself successful if teaching is weak. Academic reliability begins with teacher mastery, lesson preparation, use of textbooks and laboratories, feedback, homework design, reading culture, and honest assessment. External examination results matter, but they should not be the only evidence. A school can produce high results through selection and pressure while failing to develop ordinary learners.

Leaders should conduct lesson observations not to intimidate teachers but to protect learning. Observations should ask whether objectives are clear, explanation is strong, students are thinking, notes are meaningful, questions reveal understanding, and feedback reaches weak learners. Departmental meetings should review student work, not only cover schemes. A mathematics department should know which topics students are failing and why. An English department should know whether students can write a coherent argument.

The school should avoid two extremes. One is harsh academic pressure that treats students as results. The other is sentimental tolerance of poor performance. A Catholic school should be demanding and supportive. It should tell students the truth about their work and give them structured help to improve.

5.3 Teacher Recruitment and Formation

Teacher recruitment should test competence, character, communication, and teachability. A Catholic school should not hire only because a teacher is available, cheap, or recommended by a familiar person. Recruitment is a mission decision. The wrong teacher can damage learning, discipline, safeguarding, and the moral tone of the school.

Induction matters. New teachers should be introduced to the school’s Catholic identity, safeguarding rules, assessment standards, classroom expectations, communication norms, and student support process. They should know how discipline is handled, where to report concerns, how to use data, and how to seek help. Too many schools assume teachers will learn the culture by observation. That is unreliable.

Formation should continue. Monthly professional sessions, departmental coaching, peer observation, retreat days, child protection training, digital skills, and leadership development can sustain teacher quality. Catholic schools should not rely on fear to manage teachers. They should rely on clear standards, feedback, fair correction, and community.

5.4 Student Support and Adolescent Formation

Secondary school students are adolescents, not small adults. They carry academic pressure, emotional change, peer influence, family expectation, sexuality questions, faith questions, anxiety, social media exposure, and sometimes trauma. A Catholic school that treats every adolescent struggle as indiscipline will miss serious needs. Student support should include counseling, chaplaincy, mentoring, health services, study support, and clear referral pathways.

Boarding schools need particular care. Students living away from home require trusted adults, dormitory routines, privacy, medical response, recreation, and channels for raising concerns. Dormitories should not become hidden spaces where bullying, humiliation, or neglect are normalized. The boarding master or mistress is not only a supervisor. That role carries pastoral and safeguarding weight.

Student voice should be managed responsibly. Students should have ways to speak about learning, welfare, bullying, food, facilities, and spiritual life. Listening to students does not mean surrendering authority. It means that adults do not rely on assumptions about what students experience.

5.5 Finance and Resource Discipline

Financial discipline begins with knowing the real cost of running the school. Salaries, utilities, boarding food, security, laboratory supplies, library resources, maintenance, taxes, technology, examination costs, insurance where applicable, staff formation, scholarships, and emergency reserves should be visible. A school that sets fees by guesswork or crisis will eventually injure trust.

Budgeting should be mission-linked. If Catholic identity is a priority, formation and chaplaincy need resources. If safeguarding is a priority, training and systems need resources. If science education is a priority, laboratories need resources. If the poor are part of the mission, scholarships need resources. Budgets reveal whether mission language is serious.

The school should publish appropriate financial information to its board and proprietor and communicate fee policies respectfully to parents. Parents do not need every internal detail, but they deserve clarity about why costs exist and how the school uses resources. Secrecy around fees produces suspicion. Transparency, even when painful, strengthens trust.

5.6 Parent Partnership and Community Trust

Parents are not customers in a simple market sense. They are co-educators, fee supporters, advocates, critics, and partners in formation. The Catholic school should avoid treating parents either as threats or as people whose demands must always be satisfied. Parent partnership requires clear boundaries and genuine communication.

Communication should be planned. Parents should receive academic reports that tell the truth, welfare updates when necessary, fee communication that is respectful, safeguarding information, digital-use policies, and guidance on supporting study at home. Parent meetings should not be ceremonial. They should include evidence about learning, discipline, spiritual formation, and school priorities.

Alumni and parish communities also matter. Alumni can support scholarships, mentoring, career talks, libraries, laboratories, and infrastructure. Parish communities can support poorer students, chaplaincy, and moral formation. A Catholic secondary school should not behave as if it belongs only to fee-paying families. It belongs to the wider mission of the Church.

Chapter 6: Staged Renewal Plan for Nigerian Catholic Secondary Schools

Successful reform fails when leaders try to fix everything at once. Catholic school improvement should be sequenced. The first task is to stabilize what is unsafe or unreliable. The second is to standardize essential routines. The third is to strengthen teaching and formation. The fourth is to scale the practices that work across diocesan or congregation-owned school networks.

This chapter proposes a three-year plan. It is not rigid. Schools should adapt it to size, location, resources, and risk. The principle remains: do fewer things seriously, review evidence, and move only when the school can carry the next step.

6.1 Opening 100 Days: Stabilize the School

The first 100 days should focus on safety, data, finance, and immediate teaching risks. Leaders should review safeguarding policies, emergency contacts, visitor control, dormitory supervision, transport rules, teacher attendance, fee arrears, student enrollment, examination classes, and facility hazards. The purpose is not to produce a glossy plan. The purpose is to identify risks that can harm students or cripple the school.

A simple school diagnostic should be completed. How many teachers are full time? Which subjects have staffing gaps? Which students are failing more than one core subject? Which families are in serious arrears? Which dormitories or classrooms need urgent repair? Are safeguarding officers trained? Are incident records kept? Does the school have emergency communication with parents? These questions should be answered before leaders announce major reforms.

The first 100 days should also set a new tone. Leaders should explain that improvement will be evidence-based and humane. Teachers should not be blamed for every weakness, but they should know that standards matter. Parents should be respected, but they should know that the school will not be managed by pressure alone. Students should see that discipline and care can exist together.

6.2 Opening Year: Standardize Essential Practice

During the first year, the school should standardize lesson planning, assessment, safeguarding records, staff appraisal, parent communication, fee policy, scholarship process, and boarding supervision. Standardization does not mean rigidity. It means that essential practices do not depend on individual mood. A student should not receive a different level of safety or teaching quality because of which adult happens to be present.

Departments should develop termly learning reviews. Each department should identify weak topics, strong topics, students needing support, and teachers needing coaching. The principal should meet department heads with evidence. This is not a witch hunt. It is professional practice. Learning improves when teachers and leaders look at actual student work.

Safeguarding training should become annual. Every adult on campus, including non-teaching staff, should understand boundaries, reporting, visitor rules, and student dignity. Students should know how to report concerns. Parents should know whom to contact. The school should record and review incidents without panic or concealment.

6.3 Years Two and Three: Strengthen and Scale

The second year should deepen academic support, teacher formation, scholarships, alumni engagement, digital records, and student mentoring. The school should begin to see patterns: which subjects improve, which teachers need support, which students benefit from remediation, which families need financial planning, and which routines are working. Leaders can then invest more confidently.

By the third year, the school should be able to scale what works. A diocese or congregation can use data from one school to help another. A strong science teaching routine can be shared. A safeguarding template can become common. A scholarship fund can be widened. Teacher formation can be organized across a network. Success should not remain trapped in one school.

Scaling should remain humble. A practice that works in Abuja may need adaptation in a rural state. A boarding routine that works in one congregation’s school may not fit a day school. The principle is adaptation with evidence, not copying with pride.

Figure 3. Intervention priorities by urgency and management controllability.

Table 4. Three-year implementation sequence.

Period Main work Evidence to review Avoid
0–3 months Safety, data, finance, teacher and examination risk review Risk log, staff list, arrears, student baseline, urgent facilities Announcing broad reform without evidence
4–9 months Standardize lesson planning, safeguarding, parent communication, appraisal Department reviews, incident records, parent responses, teacher feedback Creating paperwork that does not change practice
10–18 months Strengthen remediation, teacher formation, counseling, alumni support Learning growth, retention, scholarship use, student voice Scaling weak routines
19–36 months Share effective practice across schools and deepen mission access Network data, bursary reports, inspection summaries, training outcomes Copying without adaptation

6.4 Diocesan and Proprietor Responsibilities

No Catholic secondary school should be left alone to carry every burden. Dioceses, religious congregations, and proprietors should provide policy support, leadership formation, finance guidance, safeguarding oversight, teacher development, and periodic review. If the proprietor only collects reports or intervenes during crisis, governance is too thin.

Diocesan education offices should collect basic comparable data from Catholic schools: enrollment, fees, scholarships, teacher turnover, examination results, safeguarding compliance, infrastructure risks, and student welfare indicators. This data should be used for support, not mere control. Schools should see the education office as a source of seriousness and help.

Proprietors should also protect principals. A principal asked to run a school without authority over staffing, fees, discipline, safety, or budget is being set up to fail. Responsibility and authority must match. If a principal is accountable for outcomes, the principal must have enough room to manage.

Chapter 7: Discussion

The preceding chapters show that Catholic secondary education in Nigeria succeeds when its parts reinforce one another. The school’s Catholic identity must be tied to instruction. Instruction must be tied to teacher formation. Teacher formation must be tied to finance. Finance must be tied to affordability. Safeguarding must be tied to governance. Parent trust must be tied to communication. None of these domains can be treated as decorative.

The strongest schools are not those with the loudest claims. They are those that can show evidence: students learning, teachers staying, vulnerable students protected, parents informed, finances reviewed, discipline humane, and mission visible in daily routines. This is why Catholic school stewardship is a pastoral responsibility.

7.1 Examination Success Is Not Enough

Nigeria’s school culture often rewards examination success above every other measure. WAEC and NECO results matter because they influence university access, family pride, and public reputation. A Catholic secondary school should take them seriously. But examination success can become dangerous when it becomes the only public measure of school quality.

A school may achieve strong results through selection, expulsion of weaker students, exam-focused cramming, excessive pressure, or parental tutoring. Such results may impress outsiders while hiding the school’s actual contribution. Catholic schools should ask a deeper question: how much did students grow because of the school? Value added matters. A child entering with weak reading who becomes confident and disciplined is a major success, even if that achievement does not appear in a ranking table.

Academic excellence should therefore be joined to formation. Students should learn to study honestly, write clearly, reason morally, serve generously, pray sincerely, and respect difference. The Catholic graduate should not be only admitted to university. The graduate should be prepared to live as a responsible Christian and citizen.

7.2 The Affordability Dilemma

Affordability is one of the hardest questions because there are no painless answers. High-quality schooling costs money. Low fees without subsidies can lead to unpaid teachers, poor facilities, weak security, and false economy. High fees without scholarships can turn Catholic education into a service for the comfortable. Both outcomes are dangerous.

The scale of household pressure is not a matter of impression. The National Bureau of Statistics found that about 63 percent of people in Nigeria, some 133 million, were multidimensionally poor, with deprivation markedly higher in rural areas than in cities and with children carrying the heaviest burden (National Bureau of Statistics, 2022). A school that sets fees without reckoning with this reality is not being prudent; it is quietly selecting which families it will serve. Catholic leaders should therefore treat affordability data as governance information, reviewing arrears patterns, scholarship demand, and the social profile of new intakes alongside academic results, so that the question of who can still afford the school is answered with evidence rather than assumption.

The way forward is financial truth. Schools should know their costs, publish clear fee policies, raise funds with integrity, build scholarships, and manage expenses carefully. Dioceses should help schools create bursary funds and alumni networks. Wealthier Catholic schools should consider solidarity arrangements with poorer mission schools, especially in teacher formation and learning resources.

The poor should not be used only in speeches. If they are part of Catholic education’s mission, they must appear in budgets, admissions, scholarships, partnerships, and planning. Otherwise, the school’s identity becomes socially narrow.

7.3 Catholic Identity and Plural Nigeria

Nigeria’s religious and ethnic diversity requires Catholic schools to form students who are firm in faith and respectful in society. Catholic identity should not mean hostility toward others. It should give students a deeper reason to respect human dignity, pursue justice, and serve across difference. In a country marked by religious tension, this formation is not optional.

The Vatican’s emphasis on dialogue in Catholic school identity is important here (Congregation for Catholic Education, 2022). Dialogue does not weaken Catholic identity. It allows students to practice truth with charity. A Catholic school that forms students to think, listen, and serve can contribute to national peace more effectively than a school that only produces high examination scores.

Religious formation should be intellectually serious. Students should learn Scripture, doctrine, Catholic social teaching, moral reasoning, prayer, and service. They should also be helped to confront corruption, tribalism, violence, materialism, sexual pressure, digital harm, and ecological neglect. A Catholic school must speak to the world students actually inhabit.

7.4 Data Without Dehumanization

The models proposed in this paper require data, but Catholic schools must handle data carefully. Students are not scores. Teachers are not retention units. Families are not arrears categories. Data should help leaders see persons more clearly, not reduce them to files.

A school should collect data on attendance, grades, reading growth, behavior incidents, safeguarding concerns, scholarships, teacher turnover, and parent communication. It should also listen to students and teachers. Numbers can show patterns; human conversation explains meaning. A student’s repeated lateness may reflect indiscipline, transport failure, family poverty, or anxiety. Management must investigate before judging.

Data should be confidential, truthful, and used for improvement. If teachers learn that data will only be used to punish, they may hide weakness. If parents learn that data will be used to shame children, trust will collapse. Catholic school data practice should be honest and merciful.

7.5 The Principal as Mission Executor

The principal is the daily custodian of school culture. Bishops, proprietors, and boards may set direction, but the principal translates direction into timetable, staffing, discipline, meetings, parent communication, academic review, and student welfare. A weak principal can damage even a strong school tradition. A strong principal can stabilize a school under difficult conditions.

Principal formation should therefore be deliberate. Catholic principals need preparation in theology of education, school finance, safeguarding, curriculum, teacher supervision, adolescent formation, conflict management, data use, parent relations, and public communication. They also need spiritual support. The role can become lonely, especially when parents, teachers, students, and proprietors all expect different things.

A successful principal is not only strict. Strictness without wisdom breeds fear. A successful principal is clear, fair, evidence-conscious, pastoral, and courageous enough to make unpopular decisions when student welfare or mission requires it.

Chapter 8: Recommendations

Recommendations must be practical because Catholic school leaders do not need decorative advice. They need steps that can survive actual school conditions. The following recommendations are intended for schools, diocesan education offices, religious congregations, boards, parent bodies, alumni groups, and policymakers willing to support Catholic secondary education seriously.

The recommendations should be implemented in sequence. A school that tries to launch every reform at once may produce fatigue. Each school should begin with its most serious risk and its most realistic improvement path.

8.1 For Catholic School Proprietors

Proprietors should establish minimum standards for Catholic secondary schools under their authority. These should include safeguarding policy, teacher induction, annual financial review, school board terms of reference, academic review, student support, and emergency planning. Minimum standards protect the mission from uneven local practice.

Proprietors should also conduct annual school visitations that examine evidence, not appearances. The visitation team should review classrooms, records, safeguarding files, dormitories, fee policy, staff morale, student voice, parent communication, and academic data. A short narrative report should follow each visit, with three agreed improvement actions.

A diocesan or congregation-wide teacher formation program should be created. Small schools may not have the resources to train teachers alone. Shared formation can reduce cost and strengthen identity. It can also build a Catholic teacher community across schools.

Proprietors should also hold their schools accountable for who they are reaching, not only for the results they post. In a country where roughly two-thirds of people are multidimensionally poor and children bear the heaviest share of that deprivation, a Catholic school that drifts toward serving only families who can comfortably pay has quietly narrowed its mission (National Bureau of Statistics, 2022). Proprietors should require each school to report the social profile of its intake, the size and use of its scholarship or bursary provision, and its arrears patterns, and should fund a modest cross-school solidarity arrangement so that mission access does not depend entirely on the wealth of a particular school’s catchment. Affordability handled this way becomes a governed commitment rather than an occasional act of charity.

8.2 For Principals and School Boards

Principals and boards should adopt the CSSSI model as an annual self-review tool. The review should be evidence-based. Each component should be scored with documents, data, and discussion. The school should then select three priorities for the year, assign responsible persons, and set review dates.

Boards should receive training. Many board members are willing but unclear about their duties. They need to understand finance, safeguarding, academic data, confidentiality, school mission, and oversight boundaries. A board that does not understand its role can either interfere too much or contribute too little.

Principals should establish a weekly leadership rhythm. This may include academic review, welfare review, finance review, operations review, and mission review. The rhythm should be light enough to sustain and strong enough to prevent drift. Schools fail when important matters are noticed only after they become crises.

8.3 For Teachers and Formation Teams

Teachers should receive structured induction into Catholic education. This should include the school’s mission, child protection, assessment standards, classroom management, student dignity, digital conduct, and professional expectations. New teachers should be mentored for at least one term.

Departments should meet with student work, not only lesson notes. Teachers should review scripts, assignments, projects, and test performance together. This practice turns professional development into school reality. It also helps younger teachers learn from stronger colleagues.

Formation teams should include chaplains, counselors, senior teachers, and student leaders where appropriate. Faith formation should not be confined to Mass and morning prayer. It should include service, reflection, moral conversation, vocation awareness, and care for the poor.

Formation cannot substitute for retention. With national analyses pointing to chronic teacher shortages, high pupil-to-teacher ratios, and recurring failures to recruit, Catholic schools should treat the conditions that keep good teachers as a managed priority rather than an afterthought (Athena Centre for Policy and Leadership, 2025). That means predictable and timely salaries, reasonable workloads, induction for new staff, mentoring, and a visible path for advancement, so that the teachers a school has formed are not steadily lost to better-resourced employers.

8.4 For Parents, Alumni, and Parish Communities

Parents should be treated as partners in formation. Schools should communicate clearly about academic expectations, discipline, safeguarding, digital use, fees, and student welfare. Parents should also be invited to support reading culture, career exposure, scholarship funds, and moral formation at home.

Alumni should be organized beyond reunion events. They can support mentorship, scholarships, laboratories, career talks, internships, libraries, and school improvement. A strong alumni network can become one of the most important resources for sustaining Catholic education under financial pressure.

Parish communities should reconnect with schools. Catholic secondary schools should not become isolated fee-paying enclaves. Parishes can support poorer students, provide pastoral presence, encourage vocations, and integrate students into service. This relationship should be organized, not sentimental.

8.5 For Policymakers and Public Authorities

Public authorities should recognize the contribution of Catholic schools to national education and social development. Non-state schools are part of Nigeria’s education reality. Where regulation is needed, it should be clear and fair. Where collaboration is possible, it should support teacher development, school safety, curriculum improvement, and child protection.

Government and security agencies should strengthen safe-school measures, especially in areas vulnerable to attack or kidnapping. Catholic schools cannot carry national security alone. They need timely information, emergency coordination, and credible protection. School safety is a public good.

A practical first step is alignment with existing national instruments rather than the creation of parallel systems. The National Policy on Safety, Security and Violence-Free Schools already defines minimum expectations for prevention, supervision, reporting, and response, and Catholic proprietors and boards should adopt it as the baseline against which each school’s safeguarding arrangements are audited and improved (Federal Ministry of Education, 2021). Where dioceses run several schools, a common safeguarding standard built on this policy would protect students more reliably than school-by-school improvisation and would make weak points easier to detect before harm occurs.

Policy should also support scholarships, tax incentives for educational philanthropy, teacher development partnerships, and digital inclusion. If Catholic schools are expected to contribute to national development, the policy environment should not treat them only as fee-paying private entities.

Figure 4. Three-year Catholic secondary school improvement sequence.

Chapter 9: Conclusion

Catholic secondary education in Nigeria can succeed, but only if success is defined with enough seriousness. A school that forms faith without intellectual quality is incomplete. A school that produces high scores without moral formation is incomplete. A school that is safe but unaffordable has narrowed its mission. A school that is affordable but poorly managed has betrayed families in another way. Catholic success requires a difficult balance.

This research has argued that the balance can be managed. It requires mission clarity, instructional reliability, teacher formation, safeguarding, financial discipline, student support, data use, family partnership, facilities readiness, and contextual risk awareness. These are not secular distractions from Catholic education. They are the means through which Catholic education becomes trustworthy.

9.1 Final Professional Judgment

The future of Catholic secondary education in Nigeria will not be protected by nostalgia. It will be protected by schools that can teach well, govern honestly, protect students, support teachers, serve poorer families, and form graduates who can carry conscience into Nigerian public life. The Church does not need schools that only look respectable. It needs schools that can be trusted.

Running such schools is difficult. It requires money, skill, prayer, planning, courage, and humility. Yet the difficulty is exactly why the work matters. In a country where many children are outside school or inside weak schools, a serious Catholic secondary school becomes more than a private institution. It becomes a public witness that education can still form the person, serve the nation, and honor God through competent care.

The diagnostic tools offered in this research are means to that end, not ends in themselves. A success index, a teacher-stability estimate, a safeguarding exposure model, a learning-reliability measure, and an affordability score are useful only if they make leaders look honestly at what they would otherwise prefer not to see, and only if they prompt action that protects students and supports teachers. A school may score itself, debate the results, and still fail its students if nothing changes afterward. The final judgment, therefore, is practical rather than ceremonial: a Catholic secondary school in Nigeria is succeeding when its mission can be observed in the ordinary evidence of classrooms, records, dormitories, and budgets, and when the families who entrust their children to it have good reason for that trust.

Chapter 10: Practical Formation Standards for Catholic Secondary Schools

The preceding model becomes useful only when it reaches ordinary school operations. Catholic school failure is often hidden inside small routines that no one reviews carefully: admissions interviews, dormitory supervision, prep time, lesson notes, fee follow-up, examination registration, staff duty rosters, sickbay records, and parent complaints. Good governance should reach these places without suffocating them. This chapter translates the argument into practical playbooks that a Nigerian Catholic secondary school can adapt by size, location, and resources.

The playbooks are not meant to replace local policy. They are prompts for disciplined review. A school may already be strong in some areas and weak in others. The point is to help leaders inspect daily practice with enough patience to see what is actually happening. Catholic education becomes credible in the repetition of good routines.

10.1 Admissions, Equity, and Student Fit

Admissions should not be treated only as a test of who can score high enough or pay quickly enough. A Catholic secondary school should ask whether the student can benefit from the school, whether the school can support the student, and whether admission practice is consistent with mission. Screening is legitimate; exclusion without pastoral thought is not. A school may need entrance tests, interviews, previous records, and parent meetings, but these should be interpreted with caution because many Nigerian children arrive from unequal primary school backgrounds.

An admissions process should include academic baseline, family conversation, health information, boarding readiness where applicable, safeguarding documentation, and financial clarity. It should also include some form of scholarship review before the school year begins. If scholarships are handled only after parents plead, the school will favor families with confidence and access. A written process gives poorer families a fairer chance.

Student fit should not be confused with social polish. A shy rural student, a student from a low-income home, or a student with weak spoken English may still become one of the school’s strongest graduates if supported properly. Catholic education should be careful not to mistake privilege for promise. Admissions should protect standards while leaving room for grace, growth, and social mission.

10.2 Boarding, Food, Health, and Daily Supervision

Boarding is one of the most demanding forms of Catholic school trust. Parents hand over not only academic instruction but daily living. The school becomes responsible for sleep, hygiene, food, illness, recreation, friendships, discipline, emotional distress, and spiritual routine. A boarding school that treats boarding as logistics rather than formation will eventually face hidden problems.

Dormitory supervision should be written and reviewed. Who is responsible at night? How are illnesses reported? How are younger students protected from bullying? Where are complaints recorded? How are students allowed to contact parents? What happens if a student is persistently withdrawn? Who supervises bathing areas, laundry routines, and medication? These questions are not excessive. They are the minimum due to children living under institutional care.

Food and health deserve serious attention. Poor food quality damages morale and concentration. Weak sickbay records can hide recurring illness. A Catholic school should know whether students are eating well, sleeping enough, receiving timely care, and living in clean conditions. A student who feels unseen in the boarding house will not experience the school’s faith language as credible.

10.3 Reading Culture, Library Use, and Language Formation

A serious Catholic secondary school should build a reading culture deliberately. Many Nigerian students encounter English as the language of instruction while thinking, praying, joking, and living in other languages. This multilingual reality is not a weakness. It becomes a weakness only when schools ignore language development and expect students to perform complex academic tasks without enough reading support.

The library should not be a locked room used during inspection. It should be part of the timetable. Students should read fiction, history, biography, science, Catholic literature, African literature, newspapers, and well-chosen digital materials. Reading periods, book reviews, debates, writing clubs, and guided note-making can strengthen learning across subjects. A student who reads well can survive many weaknesses; a student who reads poorly will struggle even with good teachers.

Language formation should include writing. Students need to write essays, reports, reflections, laboratory notes, arguments, and prayers with clarity. Teachers across subjects should correct expression without humiliating students. Catholic education values truth; weak language often prevents students from expressing truth with precision.

10.4 Science, Mathematics, and Practical Learning

Catholic schools in Nigeria have often been respected for discipline and academic seriousness, but the next stage requires stronger practical learning. Science should not be taught as copied notes and memorized definitions. Mathematics should not be taught as fear. Entrepreneurship should not become a subject students pass without learning initiative. Laboratories, projects, local problem-solving, and supervised practice should become part of serious secondary education.

A school does not need world-class facilities to begin improvement. It can ensure that every science topic with a practical component has a demonstration or experiment. It can use local materials responsibly. It can create mathematics clinics for weak learners. It can connect geography to the local environment, civic education to community service, and entrepreneurship to carefully supervised school projects. The issue is not glamour. The issue is whether students touch reality through learning.

The NERDC curriculum materials place trade, entrepreneurship, science, and general courses within the Nigerian secondary school expectation (NERDC, n.d.). Catholic schools should implement those areas with moral seriousness. Students should learn not only to make money but to work honestly, solve problems, and serve communities.

10.5 Discipline, Character Formation, and Restorative Correction

Discipline in a Catholic school should form conscience, not only produce silence. Order matters. Students need punctuality, neatness, respect, study habits, truthfulness, and responsibility. But discipline that relies on shame, fear, arbitrary punishment, or public humiliation damages formation. A student who obeys only because he is afraid has not necessarily become virtuous.

Restorative correction can help, but it must be disciplined. Students who harm others should face consequences and repair. A student who bullies should be required to stop, apologize where appropriate, accept sanctions, receive mentoring, and be monitored. A student who cheats should learn why dishonesty harms community, not only receive a beating or suspension. Mercy without accountability becomes weakness; punishment without formation becomes cruelty.

Staff must be consistent. If one teacher enforces rules fairly and another ridicules students, the school’s moral message becomes unstable. Discipline policy should be written, taught, practiced, and reviewed. Chaplaincy, counseling, and classroom management should work together rather than operate in separate worlds.

10.6 Digital Minimums Before Digital Ambition

Many schools want digital prestige before digital reliability. A Catholic secondary school should establish digital minimums first: accurate student records, secure fee records, teacher attendance records, term results, parent contact database, safeguarding logs, library records, and basic communication channels. These are not glamorous, but they are useful.

Digital ambition should follow school need. If students lack reading skill, digital tools should support reading. If parents miss information, communication tools should be improved. If teachers waste time compiling results manually, a simple system can help. If safeguarding reports are lost, secure documentation is needed. Digital tools should be judged by whether they reduce confusion, protect students, improve learning, or strengthen communication.

Artificial intelligence should be approached with caution. The Catholic Secretariat of Nigeria’s 2024 Education Summit included education justice and artificial intelligence in a digitally divided world among its discussion topics (Nigeria Catholic Network, 2024). That is the right framing. AI can support learning and administration, but unequal access, plagiarism, privacy, and teacher readiness must be addressed before schools rush into adoption.

10.7 Examination Integrity and Academic Honesty

Examination integrity is a moral issue. A Catholic school that tolerates cheating in order to protect results has contradicted its mission. Examination malpractice is not only a regulatory problem; it forms students into the belief that results matter more than truth. That belief later enters public service, business, medicine, law, politics, and family life.

Academic honesty should be taught from junior secondary level. Students should learn how to study, cite sources, complete assignments, work in groups, and prepare for tests. Teachers should design assessments that reduce copying and reveal understanding. School leaders should monitor exam conditions, result patterns, and teacher pressure. Parents should be told that the school will not buy success through dishonesty.

When students fail, the school should examine why. Was the teaching weak? Was the student unsupported? Was the assessment misaligned? Was there poor attendance? Were parents informed early? Integrity requires truth on both sides: students must work honestly, and schools must support honestly.

10.8 Counseling, Mental Health, and Spiritual Care

Adolescents in Nigerian secondary schools face pressure that adults sometimes minimize. They are expected to succeed academically, obey authority, manage family expectations, cope with social media, resist harmful peer influence, and make decisions about faith, sexuality, friendship, and future careers. Some carry grief, poverty, family conflict, trauma, or anxiety. Catholic schools should not assume that prayer alone replaces counseling, or that counseling replaces prayer.

A school counseling service should be confidential within safeguarding limits, accessible, and respected. Students should know where to go when they are distressed. Teachers should know how to refer. Chaplains should work with counselors without turning every psychological issue into a moral failure. Serious Catholic care understands the whole person.

Mental health support does not need to begin with expensive programs. It can begin with trained staff, safe reporting, mentoring, parent communication, study stress management, anti-bullying practice, and careful response to self-harm warning signs. A student who feels safe enough to speak may be protected from deeper harm.

10.9 Staff Appraisal and Professional Accountability

Staff appraisal should be fair, documented, and tied to improvement. Many schools either avoid appraisal because it creates conflict or use appraisal only when they want to remove a teacher. Both approaches are weak. A teacher should know what the school expects, how performance is reviewed, what support is available, and what consequences follow persistent neglect.

Appraisal should examine lesson quality, punctuality, assessment, student feedback, classroom management, Catholic identity, teamwork, safeguarding compliance, and professional conduct. It should include conversation, not only forms. Strong teachers should be recognized and given leadership opportunities. Weak teachers should receive support before sanctions, unless the issue involves serious misconduct.

Catholic schools should protect teachers from parent bullying as well as protect students from teacher misconduct. Professional accountability must be balanced. If parents can pressure management into unfair action against staff, teacher morale will weaken. If staff can mistreat students without consequence, family trust will collapse.

10.10 Facilities, Maintenance, and Environmental Responsibility

Facilities shape learning and safety. A classroom that is hot, overcrowded, dark, noisy, or poorly furnished affects concentration. A laboratory without supplies weakens science. A dormitory without adequate supervision and sanitation threatens welfare. A sports field that is unsafe discourages healthy recreation. Maintenance is not vanity. It is part of education.

School leaders should maintain a facilities risk register. It should include roofs, electrical systems, water, toilets, kitchens, dormitories, laboratories, perimeter security, fire safety, transport, and drainage. Each risk should have an owner and timeline. Small neglected repairs often become expensive crises. A Catholic school that preaches stewardship should care for property responsibly.

Environmental responsibility should be taught through practice. Waste management, school gardens, water conservation, energy discipline, and clean surroundings can become part of formation. Students learn respect for creation not only from textbooks but from how the school treats its own environment.

10.11 Alumni, Scholarship Funds, and Career Mentoring

Alumni are often an underused strength of Catholic schools. They carry memory, gratitude, professional networks, and financial capacity. Schools should organize alumni support beyond social events. Alumni can fund scholarships, mentor students, support career days, provide internships, donate books and equipment, and help schools manage professional opportunities.

Scholarship funds should be governed carefully. Criteria should be written. Selection should protect dignity. Donors should receive appropriate reports without exposing student privacy. A student benefiting from aid should not be publicly marked as poor. Catholic generosity should not become humiliation.

Career mentoring is especially important in senior secondary school. Students need to meet doctors, engineers, teachers, entrepreneurs, priests, religious sisters, lawyers, artisans, scientists, public servants, and social workers who can speak honestly about work. Such exposure helps students connect education with vocation and service.

10.12 Annual School Review

Every Catholic secondary school should conduct an annual school review before the next session begins. The review should include academic results, learning support, teacher retention, staff formation, safeguarding, finance, boarding welfare, parent communication, facility risks, student voice, and mission life. The output should be short enough to act on. A long report that nobody uses is another form of waste.

The annual review should identify three strengths, three risks, and three priorities. Each priority should have an owner, timeline, and evidence measure. If the school selects ten priorities, it may complete none. Discipline in improvement means choosing what matters most now.

The proprietor or board should receive the review and respond. Support may be needed: funds, training, policy clarity, staff approval, or external advice. Review without response breeds cynicism. Response without evidence breeds impulsive leadership. The two must remain together.

Chapter 11: Moral Risk Scenarios and Institutional Response

Catholic schools should rehearse serious scenarios before they happen. Many crises feel overwhelming because leaders are forced to invent processes under stress. Scenario thinking helps a school prepare without becoming fearful. It also exposes weaknesses that ordinary meetings may miss.

The following scenarios are not speculative drama. They are realistic conditions Nigerian Catholic secondary schools may face. Each scenario requires pastoral judgment and management discipline. The aim is to protect students, staff, families, and mission credibility.

11.1 Fee Arrears and Salary Pressure

A school enters second term with rising fee arrears. Food suppliers are demanding payment. Teachers are asking when salaries will be paid. Parents complain about fees but also demand high quality. The principal is tempted to threaten mass exclusion of students with arrears. This response may produce short-term cash, but it may also damage the school’s Catholic witness and relationship with families.

The proper response begins with data. How many families are in arrears? Which arrears are chronic? Which are temporary? Which students are on scholarship? Which expenses can be delayed without harm? Which cannot? The school should communicate respectfully, offer structured payment plans where appropriate, protect teachers’ salaries as a priority, and activate scholarship or emergency funds. Fee discipline and compassion should be managed together.

The long-term response is budget reform. The school should not run permanently on emergency appeals. It needs cost review, reserve planning, transparent fees, alumni support, and a bursary policy. Financial pressure should become a lesson in stewardship, not a season of panic.

11.2 Security Warning Before a School Event

A school receives a credible warning before an inter-house sports event or visiting day. Parents are expected. Vendors have been contracted. Students are excited. Cancelling will create anger and cost. Continuing without review may expose children and families to danger. The principal must act quickly, but not theatrically.

The response should follow a written safety protocol. The school should consult relevant authorities, proprietor, board chair, and security adviser where available. It should assess threat credibility, entry points, crowd control, transport, emergency communication, medical support, and cancellation options. Parents should receive timely communication that is honest without spreading panic.

After the event or cancellation, the school should review the process. What worked? What failed? Were phone numbers current? Did staff understand roles? Did rumors spread because communication was slow? A safety incident should leave the school better prepared than before.

11.3 Examination Decline in a Core Subject

The school’s mathematics results decline sharply over two years. Parents blame students. Teachers blame poor foundations. Management blames laziness. None of these reactions is enough. A Catholic school serious about learning should investigate the teaching and learning chain.

The review should examine teacher continuity, curriculum coverage, student baseline, homework completion, lesson observation, internal assessments, textbook use, remedial support, class size, and student attitudes. The school may discover that weak numeracy from primary school is part of the problem, but that does not absolve the school. It should create a mathematics recovery plan with diagnostics, small groups, teacher coaching, and parent guidance.

The school should report honestly to its board. Hiding poor performance until external results collapse is irresponsible. A decline in one subject can reveal deeper weaknesses in teacher support, departmental leadership, and assessment integrity.

11.4 Safeguarding Allegation Against a Staff Member

A student reports inappropriate behavior by a staff member. The case is unclear. The staff member is popular. Parents may hear rumors. The school fears reputational damage. This is the moment when Catholic identity is tested. The first duty is protection and truth, not institutional image.

The school should follow safeguarding protocol immediately: ensure the student’s safety, record the allegation, notify designated authorities according to policy and law, protect confidentiality, remove the accused from unsupervised contact where appropriate, and avoid informal settlement. No principal should improvise a private solution in a safeguarding matter.

Communication must be careful. The school should not reveal private details, but it should not lie or minimize. After the matter is handled through proper channels, the school should review whether reporting pathways, supervision, staff training, and student awareness were adequate. A safeguarding allegation is never only an incident. It is a test of the school’s protection culture.

11.5 Teacher Exodus Mid-Year

A school loses four teachers within one term. Management feels betrayed. Parents become worried. Students lose continuity. The easy explanation is that teachers are disloyal. The more serious response is to examine the conditions under which teachers left.

The teacher stability risk equation can guide review. Were salaries delayed? Was workload too high? Did teachers receive support? Were conflicts handled fairly? Was transport difficult? Did leaders listen to professional concerns? Did better opportunities appear elsewhere? The answer may include personal reasons, but a pattern of departures usually reveals school weakness.

Recovery requires more than replacement. The school should stabilize classes, communicate with parents, support students, interview remaining staff, and correct avoidable causes. If teachers leave because the school’s mission is preached but not practiced toward staff, leadership has a credibility problem.

11.6 Public Complaint on Social Media

A parent posts an angry complaint online about fees, bullying, food, or discipline. Other parents join. Alumni begin commenting. The school is tempted to issue a defensive statement. A poor response can turn a manageable complaint into public damage.

The school should first verify facts. Is the complaint valid, partially valid, exaggerated, or false? Has the parent used internal channels? Is a student’s privacy involved? Does the issue involve safeguarding? The response should be measured, truthful, and respectful. Public argument with parents rarely helps a Catholic school. Silence can also harm if it suggests indifference.

The deeper lesson is that social media often exposes weak communication earlier. If parents feel unheard, they may go public. A strong school provides clear complaint channels, response timelines, and respectful escalation. Public trust is preserved by habits formed before crisis.

11.7 Sudden Death or Serious Illness of a Student

A student dies or becomes seriously ill during the school year. The school community is shaken. Rumors spread. Parents fear negligence. Students are traumatized. Staff feel exposed. Such a moment requires pastoral care, medical clarity, communication discipline, and documentary care.

The school should activate emergency and bereavement protocols. It should support the family, notify relevant authorities, preserve records, communicate with parents appropriately, offer counseling and prayer, and review medical and supervision procedures. Compassion and accountability must remain together. The school should neither hide behind emotion nor speak like a legal department only.

After the immediate grief, leaders must ask hard questions. Were medical records current? Did staff respond quickly? Were warning signs missed? Was communication delayed? A Catholic school honors the student not by avoiding review, but by learning truthfully.

11.8 New Principal After a Troubled Period

A new principal arrives after conflict, financial strain, discipline problems, or poor results. The temptation is to announce a bold new era. That may satisfy some people briefly, but the better approach is disciplined listening and early stabilization.

The new principal should review documents, meet staff, inspect facilities, listen to students, meet parent representatives, examine finance, and review safeguarding before making major promises. Within the first term, the principal should identify the few issues that can most restore trust. Quick wins matter, but shallow theatrics should be avoided.

Leadership transition is a chance to renew culture. It is also a risk. If the new principal rejects everything before understanding the school, staff may withdraw. If the principal avoids needed change, weakness continues. The best transition combines humility, evidence, and courage.

Chapter 12: Institutional Checklists and Professional Standards

A Catholic secondary school improves when leaders convert conviction into repeatable review. Checklists are sometimes mocked as mechanical, but in complex schools they protect memory. They prevent leaders from relying on enthusiasm, charisma, or crisis-driven action. A checklist cannot love a student, but it can remind adults to do the work that love requires.

The following standards should be adapted locally. They are written for Nigerian Catholic secondary schools facing ordinary constraints: limited funds, uneven staffing, parent pressure, security concerns, examination demands, and the moral obligation to remain Catholic in practice as well as name.

12.1 Mission and Catholic Identity Checklist

The first annual review should ask whether Catholic identity has been planned, taught, and lived. Is there a clear graduate profile? Does the school have regular liturgy, prayer, service, and religious instruction? Are teachers able to explain the school’s Catholic purpose? Are students helped to connect faith with honesty, sexuality, justice, digital life, respect, and service? Are non-Catholic students treated with dignity while the Catholic identity of the school remains clear?

The review should also examine whether mission affects decisions. Does fee policy include scholarship concern? Does discipline protect dignity? Does the school serve the poor through concrete programs? Are students involved in community service that forms conscience rather than only filling a calendar? Does leadership speak truthfully when results decline or mistakes occur? Catholic identity should be tested where the school has something to lose.

A school that performs identity only during Mass will not form students deeply. A school that turns every policy decision into a mission question slowly becomes more Catholic in practice. The purpose is not to make school life pious in a narrow sense. It is to ensure that faith informs the way adults lead, teach, correct, spend, protect, and communicate.

12.2 Academic Quality Checklist

Academic quality review should begin with evidence from classrooms, not with reputation. The school should collect termly data on core subject performance, reading levels, mathematics competence, homework completion, attendance, internal assessment reliability, laboratory use, library use, and examination class readiness. Department heads should be able to identify weak topics and explain what support is being given.

Teacher lesson notes should be inspected intelligently. The point is not to collect books for administrative display. The point is to know whether teachers are planning instruction that students can follow. Principals should observe lessons and hold professional conversations. Strong teachers should share practice. Weak teaching should be corrected early, respectfully, and firmly.

Academic quality also includes students who struggle. A school that celebrates only top performers may miss its own mission. Remediation, study skills, mentoring, and parent engagement should be built into the academic year. The true test is whether more students become capable, not whether the school can advertise the few who already were.

12.3 Safeguarding and Welfare Checklist

Safeguarding review should cover policies, designated officers, staff training, visitor management, student reporting channels, dormitory supervision, transport safety, medical records, incident logs, bullying response, and communication with parents. The school should ask whether every adult on campus knows what to do when a concern arises. If the answer is no, the system is too weak.

Student welfare should include ordinary dignity. Are toilets clean? Are students eating well? Are sick students attended to? Are boarding students supervised without intrusion? Are weaker students mocked? Are punishments recorded? Are girls protected from harassment? Are boys formed away from violence and contempt? Catholic safeguarding includes the daily culture that makes harm less likely.

The school should review welfare data termly. Complaints, clinic visits, dormitory incidents, bullying reports, absences, and disciplinary sanctions can reveal patterns. Leaders should not wait for scandal before they study the ordinary signs of distress.

12.4 Finance and Affordability Checklist

Financial review should begin with the full cost of the school year. Leaders should know salary obligations, utility cost, food cost, maintenance needs, security cost, staff formation, library and laboratory costs, technology, examinations, transport, scholarship commitments, and emergency reserves. Fees should be set from evidence, not from imitation of nearby schools or last-minute panic.

Affordability review should include more than arrears. How many families request payment plans? How many students benefit from scholarship aid? How many leave because of cost? Which costs are hidden in books, uniforms, levies, trips, or boarding materials? A school may appear affordable on tuition alone while becoming difficult through accumulated charges.

Finance committees should receive clear reports. They should ask whether spending matches mission. They should also protect staff salaries and student safety as priority expenditures. A Catholic school that delays salaries while funding prestige projects sends the wrong moral signal.

12.5 Teacher Formation and Retention Checklist

Teacher review should include recruitment quality, induction, mentoring, professional learning, spiritual formation, appraisal, workload, salary timing, classroom resources, and staff morale. A school should know why teachers leave. Exit interviews should be conducted with enough trust to hear the truth. If teachers leave because leadership is harsh, salaries are delayed, or workloads are irrational, the school must correct itself.

Teacher formation should be planned across the year. Topics should include Catholic identity, adolescent development, safeguarding, assessment, classroom management, reading support, digital tools, and subject-specific instruction. Formation should not be reduced to one workshop at the beginning of the session. Teachers need sustained support.

Retention improves when teachers experience respect. Respect does not mean absence of correction. It means fairness, clarity, timely payment, listening, and professional dignity. A Catholic school cannot form students in dignity while treating teachers carelessly.

12.6 Boarding and Student Life Checklist

Boarding review should include dormitory condition, supervision rosters, lights-out procedures, study time, recreation, hygiene, sickness response, food quality, privacy, complaint channels, and access to chaplaincy or counseling. Boarding students should not feel abandoned after classes end. Some of the most important formation in a boarding school happens after evening prep, during meals, on sports fields, and in dormitory conversations.

Student life should include clubs, sports, arts, debate, service, retreat, leadership roles, and cultural activities. Examination pressure can suffocate these areas, but students need them. Whole-person education cannot exist only in speeches. It requires time and adult supervision.

The school should review whether student leadership positions form responsibility or only reward popularity. Prefects should be trained in service, boundaries, conflict management, and reporting. They should never become instruments of unchecked student power.

12.7 Data and Evidence Checklist

A school evidence dashboard can be simple. It should include enrollment, attendance, fee status, teacher turnover, core subject performance, reading support, disciplinary incidents, safeguarding reports, clinic visits, parent complaints, scholarship use, and facility risks. The data should be reviewed by leadership and board at agreed intervals.

Evidence should be interpreted carefully. A rise in incident reporting may mean conditions are worse, but it may also mean students finally trust the reporting system. A drop in parent complaints may mean improved service, or it may mean parents have given up. Data needs conversation. The principal should not treat numbers as self-explanatory.

The best evidence practice is honest, limited, and consistent. Schools do not need hundreds of indicators. They need the right few, reviewed regularly, with action attached. Data that does not lead to decision becomes another administrative burden.

12.8 Formation for Leadership Succession

Catholic schools often depend heavily on one principal, one bursar, one chaplain, or one senior teacher. That dependence is risky. Leadership succession should be planned. Deputies and middle leaders should be trained in finance basics, safeguarding, curriculum supervision, communication, and Catholic mission. A school should not become unstable because one person is transferred, retires, or falls ill.

Succession planning also protects institutional memory. Policies, records, passwords, supplier contracts, examination files, staff records, facility plans, and safeguarding reports should not live in one person’s head. Documentation is not a lack of trust. It is care for continuity.

Young teachers and staff should be invited into leadership gradually. They can lead clubs, departments, formation groups, data reviews, and service projects. The school forms future leaders by giving them responsibility with supervision. A Catholic school that does not form successors will eventually lose its own standards.

Table 5. Annual school review evidence checklist.

Domain Evidence to gather Decision question
Mission identity Retreat records, service projects, liturgy schedule, graduate profile Is Catholic identity shaping school life or only appearing ceremonially?
Learning Results, scripts, reading data, remediation logs, lesson observations Which students and subjects need immediate support?
Safeguarding Training records, incident logs, visitor records, supervision rosters Are students protected by routine rather than by assumption?
Finance Budget, arrears, salary record, bursary data, maintenance plan Can the school pay its obligations and still serve its mission?
Teachers Retention, appraisal notes, induction records, workload data Are teachers being formed and retained with dignity?
Facilities Risk register, repair log, water, sanitation, dormitories, labs Which facility risks threaten learning, safety, or trust?

12.9 Final Implementation Covenant

A Catholic secondary school should end each annual review with a covenant of action. The covenant should name what the school will protect, what it will improve, and what it will stop pretending not to see. It should be short, written, and reviewed. The word covenant is appropriate because Catholic education is not only a service contract. It is a relationship of trust involving God, students, families, teachers, Church leadership, and society.

The covenant should avoid grand language. It should state concrete actions: train all staff in safeguarding by a certain date, repair dormitory windows before resumption, establish a reading period, create a scholarship committee, review mathematics performance monthly, update emergency contacts, mentor new teachers, and publish fee policy. Such actions may look small. They are where mission becomes credible.

When a school keeps its promises, families notice. Teachers notice. Students notice. Over time, trust grows not because the school claims excellence, but because its routines make excellence believable. That is the standard this research proposes for Catholic secondary education in Nigeria.

Chapter 13: Research Extensions and Catholic Education Renewal

The paper has concentrated on how a Catholic secondary school can be run successfully, but the next stage of research should examine Catholic education as a network. Nigeria does not need isolated excellent schools surrounded by fragile ones. The Church has dioceses, religious congregations, parishes, alumni associations, professional guilds, hospitals, media platforms, universities, and charitable agencies. These relationships can strengthen secondary schools if they are organized with discipline.

Network thinking does not require every school to become identical. It requires common standards where students are vulnerable and where mission credibility is at stake. Safeguarding, teacher formation, examination integrity, financial reporting, student welfare, and Catholic identity should not depend entirely on local improvisation. A national or provincial Catholic education standard could protect weaker schools without suffocating stronger ones.

13.1 Catholic Education Data Observatory

A Catholic Education Data Observatory could collect annual information from diocesan and congregation-owned secondary schools. The data should include enrollment, gender balance, fee ranges, scholarship coverage, teacher turnover, subject staffing, boarding capacity, safeguarding training, learning outcomes, examination performance, digital readiness, and facility risks. Such a body need not be large. It must be trusted, competent, and careful with confidentiality.

The value of such an observatory would be practical. Church leaders could see which regions need teacher support, which schools are becoming unaffordable, where science staffing is weak, where girls’ enrollment is falling, where boarding risks require intervention, and which schools are strong enough to mentor others. Without shared data, Catholic education leadership risks governing by isolated reports and reputation.

The observatory should not become a punishment tool. If schools believe data will be used only to shame them, they will underreport problems. The proper culture is support with accountability. A school that reveals weakness should receive help, but it should also be expected to improve.

13.2 Shared Teacher Formation Institute

A shared Catholic teacher formation institute for Nigeria would be a major step forward. It could operate through annual residential programs, online short courses, diocesan workshops, and subject communities. Content should include Catholic educational identity, child protection, adolescent psychology, assessment, literacy across the curriculum, mathematics support, classroom management, digital pedagogy, and leadership formation.

Such an institute could partner with Catholic universities, seminaries, teacher-training colleges, professional bodies, and experienced school leaders. It should not become purely theoretical. Teachers need practical tools they can use in classrooms. Principals need case discussions drawn from actual school problems. Bursars and administrators need training in finance, records, fee policy, and procurement.

Formation should include non-teaching staff. Security guards, cooks, drivers, cleaners, nurses, and dormitory staff all affect student welfare. A school’s Catholic identity is experienced through every adult who interacts with students. Ignoring non-teaching staff is a serious mistake.

13.3 Scholarship Endowment and Mission Access

A national or diocesan Catholic education scholarship endowment could help preserve access for poorer families. The fund should be professionally governed, audited, and linked to clear criteria. It could receive support from alumni, parishes, Catholic professionals, corporate partners, philanthropists, and diaspora communities. The purpose would not be to make every school free, but to prevent Catholic education from becoming socially closed.

Scholarship should be tied to dignity. Students benefiting from aid should not be branded publicly. Their families should not be humiliated in fee offices. A Catholic scholarship system should protect privacy and communicate gratitude without turning poverty into a spectacle. Donors should receive evidence of impact, but not at the expense of student dignity.

Mission access also includes students with disabilities, students affected by conflict, girls at risk of early marriage, and students from remote communities. Catholic schools cannot serve every need, but they should know which needs they are prepared to support and which partnerships can help. A school that wants to be inclusive must plan inclusion before the student arrives. National policy now frames inclusion as a right to a safe, welcoming learning environment for learners of all abilities and backgrounds, giving Catholic schools a public reference point for their own inclusion planning (Federal Ministry of Education, 2023).

13.4 Research Agenda for the Next Five Years

Future research should test the CSSSI model with actual school data. Researchers could work with a sample of Catholic secondary schools across different regions, ownership types, fee levels, and boarding arrangements. The study could examine whether mission identity, teacher stability, safeguarding, finance, and learning support predict parent trust, teacher retention, examination performance, and student welfare.

Another research direction is student voice. Many adult discussions about Catholic schools take place without careful attention to what students experience. Do students feel safe? Do they understand Catholic identity? Do they trust teachers? Do they experience discipline as fair? Do they feel pressure to cheat? Do poorer students feel respected? Such questions would deepen school improvement.

A third research direction is affordability. Catholic education needs better evidence about fee pressure, scholarship effectiveness, alumni funding, parish support, and family sacrifice. Without this evidence, schools may either raise fees defensively or underinvest dangerously. Serious research can help Church leaders make wiser financial decisions.

A fourth direction is teacher vocation. What keeps excellent teachers in Catholic schools? What drives them away? How do salary, mission, leadership, workload, professional growth, and spiritual formation interact? If Catholic schools cannot answer that question, their future quality will remain fragile.

13.5 Closing Word on Catholic School Leadership

The best Catholic school leaders in Nigeria will not be those who speak most loudly about excellence. They will be those who can hold together prayer and payroll, doctrine and data, safeguarding and discipline, academic ambition and mercy, affordability and sustainability, tradition and new methods. That work is not glamorous. It is demanding and often lonely. Yet it is one of the most important forms of Catholic service in the country.

A successful Catholic secondary school forms students who can read the world with intelligence and conscience. It teaches them to pray, think, work, serve, question dishonesty, respect others, and carry responsibility. If such schools are run well, they become quiet engines of national renewal. If they are run poorly, they waste one of the Church’s strongest contributions to Nigeria’s future.

References

Athena Centre for Policy and Leadership. (2025). Tackling teacher shortages in Nigeria: Recruitment, training, and retention strategies. https://athenacentre.org/tackling-teacher-shortages-in-nigeria-recruitment-training-and-retention-strategies/


Congregation for Catholic Education. (2022). The identity of the Catholic school for a culture of dialogue. Vatican. https://www.vatican.va/roman_curia/congregations/ccatheduc/documents/rc_con_ccatheduc_doc_20220125_istruzione-identita-scuola-cattolica_en.html

Cristo Rey Network. (n.d.). Corporate Work Study. https://www.cristoreynetwork.org/corporate-work-study

Federal Ministry of Education. (2021). National policy on safety, security and violence-free schools in Nigeria with implementing guidelines. Federal Ministry of Education. https://education.gov.ng/wp-content/uploads/2021/12/National-Policy-on-SSVFSN.pdf

Federal Ministry of Education. (2023). National policy on inclusive education in Nigeria (Rev. ed.). Federal Ministry of Education. https://planenigeria.com/resources/national-policy-on-inclusive-education-in-nigeria-2023-executive-summary/

Federal Republic of Nigeria. (2013). National policy on education. Federal Ministry of Education. https://education.gov.ng/wp-content/uploads/2020/06/NATIONAL-POLICY-ON-EDUCATION.pdf

Francis. (2020). Global Compact on Education: Together to look beyond. Vatican. https://www.vatican.va/content/francesco/en/messages/pont-messages/2020/documents/papa-francesco_20201015_videomessaggio-global-compact.html

Global Coalition to Protect Education from Attack. (2025). Nigeria: A case study on implementing the Safe Schools Declaration. https://protectingeducation.org/publication/nigeria-a-case-study-on-implementing-the-safe-schools-declaration/

Jesuit Memorial College. (n.d.). Home. https://jesuitmemorial.org/

Jesuit Schools Network. (n.d.). Assessment resources and network surveys. https://jesuitschoolsnetwork.org/resources/resources-and-surveys/

Loyola Jesuit College. (n.d.). Loyola Jesuit College, Abuja. https://loyolajesuit.org/

National Bureau of Statistics. (2022). Nigeria multidimensional poverty index (2022). National Bureau of Statistics. https://nigerianstat.gov.ng/news/78

Nigerian Educational Research and Development Council. (n.d.). New revised senior secondary education curriculum. https://www.nerdc.gov.ng/content_manager/new_senior_curriculum_home.html

Nigeria Catholic Network. (2024). CSN set to host 2024 Education Summit. https://www.nigeriacatholicnetwork.com/csn-set-to-host-2024-education-summit/

Safe Schools Declaration. (2015). Safe Schools Declaration. https://ssd.protectingeducation.org/

UNICEF Nigeria. (2024). Immediate action needed to protect Nigeria’s children and schools. https://www.unicef.org/nigeria/press-releases/immediate-action-needed-protect-nigerias-children-and-schools

World Bank. (2022). The state of global learning poverty: 2022 update. World Bank. https://www.worldbank.org/en/news/press-release/2022/06/23/70-of-10-year-olds-now-in-learning-poverty-unable-to-read-and-understand-a-simple-text

The Thinkers’ Review

Ogochukwu Ifeanyi Okoye

Digital Pathology, Diagnostic Safety, and Workforce Sustainability

New York Center for Advanced Research (NYCAR)

A Paige AI Prostate Pathology Case Study in AI-Assisted Cancer Diagnosis

Master’s Research Publication

Research Publication by Ogochukwu I. Okoye

Publication No.: NYCAR-TTR-2026-RP023

DOI: https://doi.org/10.5281/zenodo.20435017

June 2026

Peer Review Statement: This research publication has been reviewed under NYCAR’s internal editorial framework and The Thinkers’ Review. The review assessed master’s-level coherence, source integrity, method suitability, quantitative reasoning, APA 7 alignment, and professional relevance. The work is approved for NYCAR institutional publication.

Copyright © June 2026 Ogochukwu I. Okoye. All rights reserved. NYCAR.

Abstract

Pathology is where many cancer decisions become definite enough for treatment, yet the work is usually invisible to the patient whose future turns on the slide. A prostate biopsy is not just tissue on glass. It is a chain of sampling, fixation, staining, scanning, viewing, interpretation, reporting, communication, and clinical action. Digital pathology changes that chain. Artificial intelligence changes it further, not by removing the pathologist, but by altering what can be highlighted, checked, routed, timed, and audited before a report reaches the treating team.

This master’s research publication examines Paige Prostate as a case in diagnostic safety and workforce sustainability. The device received FDA De Novo authorization in 2021 as software intended to assist pathologists in detecting foci suspicious for cancer during review of digitized prostate biopsy images. That authorization matters, but it is not the whole clinical story. A laboratory still can validate scanners and displays, protect image quality, train users, preserve diagnostic authority, maintain cybersecurity, monitor discrepancy patterns, and decide how algorithmic assistance fits into the practical rhythm of work.

The study uses public regulatory evidence, College of American Pathologists guidance on whole-slide imaging validation, digital pathology literature, and applied management modeling. Its diagnostic-load balance model examines whether validated infrastructure, assistive review, workflow efficiency, and workforce flexibility are sufficient to justify implementation burden and error risk. The model is not presented as hidden clinical data. It is a transparent planning tool for laboratories, health-system leaders, and clinical governance boards.

The argument is deliberately cautious. AI-assisted pathology can help draw attention to suspicious tissue, support consultation, and ease pressure on scarce expertise. It can introduce new risk if it is purchased faster than the laboratory can govern it. Paige Prostate is therefore best understood as a test of clinical stewardship: the technology becomes valuable only when pathologists remain accountable, local validation is serious, monitoring continues after launch, and diagnostic judgment is strengthened rather than displaced.

Keywords: digital pathology; artificial intelligence; Paige Prostate; prostate cancer; diagnostic safety; pathology workforce; whole-slide imaging; clinical AI governance

Contents

Chapter 1: Introduction and Diagnostic Problem

1.1 Why digital pathology matters for diagnostic safety

Cancer diagnosis depends on many hands before a patient hears the word that changes the rest of the consultation. A biopsy is taken, prepared, stained, tracked, reviewed, reported, and translated into treatment. Patients often imagine diagnosis as one decisive moment under a microscope. In reality, diagnosis is a pathway. Each part of that pathway can protect the patient or expose the patient to delay, ambiguity, or error. Digital pathology enters this pathway at a sensitive point because it changes how slides are captured, viewed, shared, stored, and reviewed.

Whole-slide imaging allows tissue sections to be scanned into digital images that can be viewed on a screen rather than through a conventional microscope. The change appears technical, but it has management consequences. Images are captured with sufficient quality. Displays are fit for diagnostic use. File storage and network speed affect the working day. Remote consultation becomes easier, but cybersecurity and access control become more important. Validation moves from a narrow laboratory exercise to a safety condition for the whole service (Evans et al., 2022; Pantanowitz et al., 2013).

In prostate pathology, the stakes are specific. Small foci of carcinoma may carry serious clinical consequences. A pathologist may review a large number of benign cores before finding a small suspicious area. A tool that highlights potentially suspicious regions can support attention, but the clinical duty remains with the pathologist. The managerial question is therefore not whether a machine can point to a region of interest. It is whether the laboratory can introduce that support without weakening responsibility, increasing friction, or creating blind trust in a software output.

1.2 Paige Prostate as a case

Paige Prostate is useful as a case because it is not an abstract prediction about AI in medicine. The FDA De Novo decision identified it as a software-only device intended to assist pathologists in detecting foci suspicious for cancer during review of digitized prostate biopsy images (U.S. Food and Drug Administration, 2021). That intended use is narrow enough to study carefully. The device does not diagnose cancer for the pathologist, sign out reports, or replace histological judgment. It operates inside a workflow where professional responsibility remains visible.

This case avoids a common weakness in AI writing: treating authorization as if it were the same as clinical readiness. Regulatory clearance can show that evidence satisfied a defined review pathway. It does not prove that every laboratory has adequate scanner validation, image management, display quality, network performance, cybersecurity discipline, staff training, quality monitoring, or audit capacity. Paige Prostate therefore makes the distinction between device authorization and local clinical governance impossible to ignore.

The study frames the case through three concerns. The opening point is diagnostic safety: can assistive software reduce the risk that suspicious tissue is missed while preserving pathologist judgment? The next point is service management: can the tool fit into the day-to-day laboratory without creating hidden delays or burdens? The final point is workforce sustainability: can digital systems support scarce diagnostic expertise without pretending that expertise is optional? These concerns are connected, because a system that helps diagnosis but exhausts the service will not remain safe for long.

1.3 Research aim and questions

The aim of this publication is to examine how AI-assisted digital pathology can be governed as a patient-safety and workforce-management intervention. The focus is Paige Prostate, but the wider contribution concerns any laboratory considering assistive software in diagnostic work. The question is not simply whether AI performs well in a controlled evaluation. The question is whether the clinical setting can carry AI responsibly.

The research asks four practical questions. What does the Paige Prostate case reveal about the limits of AI-assisted diagnostic support? Which whole-slide imaging and laboratory conditions are required before such support can be trusted in practice? How can diagnostic-load balance be modeled without inventing clinical findings? Which governance routines protect pathologist authority, patient safety, data integrity, and workforce sustainability after implementation?

The paper is written for health-service managers, pathology leaders, clinical governance committees, and graduate researchers who can evaluate medical AI without either fear or excitement taking control of the analysis. It treats AI as a tool inside a service. The service, not the software alone, is the object of management.

Table 1. Digital pathology operating requirements

Requirement Management question Risk if weak
Whole-slide imaging Are scanners validated for intended case types? Image quality compromises diagnosis.
Viewer and display Can pathologists review safely and efficiently? Digital review becomes slow or unsafe.
AI deployment Is intended use narrow and understood? Automation bias or misuse.
Cybersecurity Are images and patient data protected? Diagnostic and privacy risk.
Quality monitoring Are discrepancies tracked after launch? Silent performance drift.

Note. Original table prepared for NYCAR publication use. Copyright © June 2026 Ogochukwu I. Okoye.

Chapter 2: Digital Pathology and AI Literature

2.1 Whole-slide imaging as a clinical platform

Digital pathology is often introduced as a matter of scanning slides, but that description understates the change. Whole-slide imaging turns diagnostic tissue into a digital object that can be viewed, stored, transmitted, measured, and analyzed through software. The slide is still rooted in histological preparation, but its use now depends on scanner performance, image compression, viewer design, display calibration, bandwidth, data storage, and clinical acceptance. Every one of those elements can affect diagnostic confidence.

The College of American Pathologists guideline work on whole-slide imaging validation is central because it insists that laboratories validate their own systems before diagnostic use. Validation is not ceremony. It asks whether the digital system can produce interpretations equivalent to established practice for the intended use, case mix, scanners, displays, and users (Evans et al., 2022; Pantanowitz et al., 2013). A digital pathology program that skips or trivializes validation is not modern. It is under-governed.

The literature shows that digital pathology is an infrastructure change. Scanners can fail, images can be incomplete, focus can be poor, and file access can be slow. A pathologist may spend less time at the microscope but more time managing image navigation if the viewer is poorly designed. Laboratory leaders therefore can examine digital pathology as work design, not just image acquisition. A system that looks efficient in a vendor demonstration may feel different during a high-volume diagnostic session.

2.2 AI assistance and the pathologist’s role

AI in pathology is best understood as assistive decision support rather than independent clinical authority. The distinction is not cosmetic. Pathologists integrate morphology, clinical history, specimen context, staining quality, differential diagnosis, and local reporting standards. Software may identify a suspicious region or provide a probability signal, but it does not carry the professional obligations that belong to a registered clinician. The College of American Pathologists has framed this point in plain terms: AI tools may make predictions, while pathologists make diagnoses (College of American Pathologists, 2025). This distinction aligns with broader diagnostic-pathology literature that treats AI as support for professional interpretation rather than a replacement for pathologists (Shafi & Parwani, 2023).

Diagnostic AI literature supports interest but not complacency. Reviews of AI in digital pathology show promise across several applications, yet they describe variation in study design, data composition, external validation, and risk of bias (McGenity et al., 2024). The practical lesson is not that AI lacks value. It is that the value depends on context, evidence quality, clinical fit, and post-deployment review. A laboratory cannot rely on a headline accuracy figure without asking where the data came from and whether the local setting resembles the evaluated setting.

The risk of automation bias deserves attention. A pathologist may place too much trust in an algorithmic highlight, especially under time pressure. The opposite risk is possible: a user may ignore a useful alert because the system is poorly introduced, poorly explained, or experienced as an intrusion. Training can address both tendencies. Human oversight is not preserved by writing it into a policy; it is preserved through workflow, culture, time, and audit.

2.3 Workforce pressure and diagnostic demand

Pathology services face a difficult workforce problem. Cancer services require timely diagnosis, reporting standards are demanding, and subspecialty expertise is unevenly distributed. Digital pathology can support remote review, consultation, and workload sharing. AI may help triage attention or reduce avoidable delay in defined tasks. Those possibilities are significant, but they do not remove the need for trained pathologists. In fact, new digital systems require pathologists to learn additional review practices, supervise validation, participate in governance, and interpret new kinds of evidence.

Workforce sustainability therefore belongs within more than productivity. A laboratory may introduce AI to save time, but early implementation can increase workload through validation, training, troubleshooting, quality review, and user support. The burden may be justified if it produces safer, more flexible service over time. It becomes damaging when the business case counts future efficiency while ignoring the transition work required to get there.

The better workforce question is whether digital pathology allows scarce expertise to be used more wisely. Can high-risk cases be flagged earlier? Can remote consultation reduce bottlenecks? Can less experienced staff gain support without losing supervision? Can routine review become more organized while complex interpretation remains protected? Those are management questions, not software features.

Figure 1. Author-developed visual prepared for NYCAR publication use. Copyright © June 2026 Ogochukwu I. Okoye. All rights reserved.

Chapter 3: Regulatory and Case Context

3.1 The FDA De Novo authorization

The FDA De Novo decision for Paige Prostate provides the regulatory anchor for this study. Public FDA material states that Paige Prostate is software intended to assist pathologists in detecting foci suspicious for cancer during review of digitized prostate biopsy images (U.S. Food and Drug Administration, 2021). That wording matters. It establishes assistance, suspicion, digitized images, prostate biopsy, and pathologist review as the central boundaries.

A regulatory boundary is a safety boundary. A laboratory that uses a tool outside its intended use invites clinical and legal confusion. A device cleared for assisting with suspicious foci in prostate biopsy review cannot be casually generalized to other cancers, other specimen types, or unsupported diagnostic decisions. Responsible implementation begins with the discipline of intended use.

The public case material is enough to support analysis, but not enough to prove every local outcome. It does not show how each laboratory trains users, handles exceptions, archives image data, monitors false alerts, or reports turnaround changes. That is why this publication separates the regulatory case from the local governance case. FDA authorization can open a path; local validation decides whether that path is safe enough for a given service.

3.2 Evidence boundaries

AI healthcare publications often lose credibility by overstating what a public source can show. A product summary can describe intended use and evidence reviewed for authorization. It cannot prove equity across all populations, user behavior across all laboratories, or sustainability under staffing pressure. That boundary matters in digital pathology because the same software can perform differently when the scanner, case mix, user training, network, or display changes.

The evidence base used here is therefore layered. FDA material supports the Paige Prostate device context. CAP guidance supports the importance of whole-slide imaging validation. Digital pathology literature supports the need for external evaluation and careful clinical adoption. AI governance sources, including the NIST AI Risk Management Framework, support risk identification, measurement, management, and monitoring across the life of an AI system (NIST, 2023).

The study does not claim that private Paige data, local laboratory logs, or patient-level outcomes were analyzed. It provides a management framework that a laboratory could adapt with local data. That restraint is part of the publication standard. A planning model is valuable when it states what it can and cannot prove.

3.3 From authorization to service adoption

The transition from authorized device to service adoption is where many health technologies succeed or fail. The laboratory can identify the intended pathway, determine which cases qualify, train pathologists, set review rules, define escalation, protect data, measure discrepancy, and decide what counts as a failed or concerning use case. No single announcement accomplishes that work.

The case raises responsibility questions. If software highlights a suspicious area and the pathologist disagrees, what record is preserved? If the system misses a focus that the pathologist finds, is that event logged for performance review? If the pathologist misses a focus that the software highlighted, how is that handled in education and quality assurance? These questions are uncomfortable because they connect human judgment with machine assistance. Avoiding them does not make the risk disappear.

Adoption is paced by readiness. A smaller laboratory may need a different rollout than a large academic center. A site with mature digital pathology infrastructure may be able to focus on AI governance. A site still building whole-slide imaging capacity may can solve scanner validation and image-management problems before adding algorithmic support. The tool enters the laboratory as part of a system, not as a standalone answer.

Chapter 4: Workflow, Validation, and Diagnostic Safety

4.1 Workflow fit

Workflow fit is one of the most important safety questions in AI-assisted pathology. A system that interrupts reading, slows case navigation, or produces unclear alerts can weaken service quality even when its technical performance appears attractive. A pathologist reviewing a long list of cases needs the software to integrate with the viewer, the laboratory information system, the reporting routine, and the local sequence of work. Anything else becomes a The next point job.

The workflow question can be tested through observation. How many clicks are required? Where does the alert appear? Does it arrive before, during, or after the pathologist’s review? Can the user move easily between regions? Is the alert explainable enough to prompt examination without creating false authority? Are disagreements recordable? Do case files remain easy to locate after review? These details decide whether the service becomes safer or simply more complicated.

Workflow fit is a matter of attention. AI assistance may be most useful when it helps prevent fatigue-related oversight, particularly in large volumes of benign-appearing tissue. Yet if the tool creates too many signals, pathologists may learn to ignore it. Alert burden is a clinical governance issue. A laboratory can know whether the alert pattern supports careful review or becomes noise.

4.2 Validation before use

Validation is the laboratory’s The opening point serious act of self-protection. CAP guidance on whole-slide imaging emphasizes validation for intended diagnostic use, recognizing that a system’s performance is assessed in the environment where it will be used (Evans et al., 2022; Pantanowitz et al., 2013). AI support adds another layer. The scanner, tissue preparation, image quality, user interface, algorithm, and case mix all interact.

A practical validation plan for Paige Prostate use would include a defined case set, qualified pathologists, scanner and display details, acceptance criteria, discrepancy review, documentation, and governance sign-off. It would not be enough to say that the device has regulatory authorization. Local validation asks a different question: does this site’s digital pathway support safe use for the intended cases and users?

Validation requires negative space. Which cases are excluded? What happens with poor image quality? How are atypical small foci, inflammation, artifacts, or unusual histology handled? What if the tissue preparation does not resemble cases in the original evidence base? A good validation process is not built to confirm confidence. It is built to expose where confidence is too easy.

4.3 Diagnostic safety after launch

Post-launch safety matters because performance is not frozen at go-live. Staff change, scanners are serviced, software versions may change, case mix shifts, workloads fluctuate, and reporting practices develop shortcuts. A laboratory that treats implementation as complete after launch may miss the moment when safe use begins to drift.

Monitoring requires turnaround time, discrepancy review, false alert burden, missed-alert review, user feedback, case routing, image quality, technical downtime, and pathologist confidence. Some measures are numerical; others require professional review. A dashboard can show patterns, but it cannot interpret every pathology disagreement. Governance boards need both metrics and professional discussion.

Diagnostic safety includes the patient’s timeline. An AI-assisted service that improves internal review but delays report release has not clearly helped the patient. Conversely, a tool that reduces delay while preserving review quality may support access to treatment. Managers can connect laboratory metrics to clinical consequences: the report, the multidisciplinary team, the patient consultation, and the treatment plan.

Figure 2. Author-developed visual prepared for NYCAR publication use. Copyright © June 2026 Ogochukwu I. Okoye. All rights reserved.

Chapter 5: Workforce Sustainability and Professional Practice

5.1 The pathologist as accountable professional

AI assistance changes the work of the pathologist but does not erase professional accountability. The pathologist still examines the tissue, interprets morphology, considers clinical context, resolves uncertainty, and signs the report. A software output is part of the evidence environment. It is not the clinician.

This distinction protects patients and professionals. Patients are entitled to know that a qualified person remains responsible. Pathologists need organizations that do not pressure them to accept algorithmic suggestions for the sake of speed. Vendors need feedback, but they do not supervise diagnosis. Laboratory leadership can preserve these boundaries in policy, training, and daily work.

Accountability requires time. A pathologist cannot exercise meaningful oversight if workloads are arranged as if algorithmic support has already solved the labor problem. If AI is used to increase volume without preserving review time, diagnostic authority becomes formal rather than practical. Workforce sustainability depends on honest workload planning.

5.2 Training and professional confidence

Training cannot be limited to a demonstration of buttons. Pathologists require an understanding of intended use, evidence limits, alert behavior, disagreement handling, documentation, and local escalation. Laboratory scientists and informatics staff need parallel training around scanning, image quality, data handling, and technical faults. Managers need training in what the tool can and cannot justify.

Professional confidence grows when the system allows users to question it. Pathologists need a pathway for reporting confusing alerts, false positives, suspected misses, and workflow problems. Those reports are reviewed without blame. Early adoption always reveals frictions that were not visible in procurement conversations.

The workforce benefit of digital pathology appears when the technology gives clinicians more usable time, better access to consultation, easier review of difficult cases, and greater flexibility across sites. If the system creates a permanent layer of troubleshooting and administrative work, the promised benefit weakens. This is why training and user feedback belong inside the workforce model rather than outside it.

5.3 Remote work and service resilience

Digital pathology can support remote review and networked expertise. That is valuable for resilience. A service may use digital slides to route cases to subspecialists, support consultation between hospitals, cover short-term absence, or reduce geographic bottlenecks. For regions with uneven pathology capacity, remote review can be more than convenience.

Remote work still requires governance. The display environment, network security, authentication, data storage, reporting interface, and local policy are fit for diagnostic work. A pathologist reviewing at a remote site does not become less accountable, and the laboratory does not become less responsible for the conditions of review. Remote flexibility is safe only when the environment is controlled.

Workforce sustainability therefore involves both distribution and protection. The service can use scarce expertise more flexibly, but it can protect concentration, supervision, and peer contact. The profession cannot be sustained by isolated clinicians working through screens without adequate connection to colleagues, quality review, or service leadership.

Chapter 6: Diagnostic-Load Balance Model

6.1 Purpose of the model

The diagnostic-load balance model is designed for planning, not for claiming hidden empirical findings. It asks whether the burden of implementing AI-assisted digital pathology is justified by the clinical and workforce benefits expected in a defined setting. The model is deliberately transparent, because healthcare managers require tools that can be debated rather than black boxes that imitate certainty.

The model uses six components. Four are potential benefits: validated infrastructure, assistive review value, workflow efficiency, and workforce flexibility. Two are burdens: error risk and implementation burden. The balance is favorable when the benefit components outweigh burden in a way supported by local evidence. The balance is not favorable when the tool adds complexity faster than the laboratory can govern it.

The model can be expressed as DLB = 0.25V + 0.20A + 0.20E + 0.15F – 0.10R – 0.10B. V represents validated infrastructure, A assistive review value, E workflow efficiency, F workforce flexibility, R error risk, and B implementation burden. Scores are normalized on a 0 to 100 scale. The weights are author-developed planning weights, not universal constants.

6.2 Interpreting the components

Validated infrastructure receives the highest weight because an AI tool depends on the digital pathway that carries it. If scanner validation, display conditions, image quality, data storage, and viewer performance are weak, the algorithm enters an unstable environment. No model of diagnostic support can rescue a poorly governed digital foundation.

Assistive review value refers to the capacity of the tool to direct attention in a clinically useful way. It includes whether suspicious regions are highlighted clearly, whether user disagreement is possible, whether alerts support rather than interrupt review, and whether the evidence base fits the intended case type. Workflow efficiency examines whether review, reporting, consultation, and audit become more manageable in practice.

Workforce flexibility captures the ability to route cases, support remote review, or make scarce expertise more accessible. Error risk includes false reassurance, automation bias, poor image quality, missed foci, and overreliance on the tool. Implementation burden includes validation, procurement, training, maintenance, cybersecurity, vendor management, and quality monitoring. A low burden score is not always desirable; it may indicate that the laboratory has not counted the work honestly.

6.3 Example interpretation

In a planning example, a laboratory might score validated infrastructure at 84, assistive review at 76, workflow efficiency at 68, workforce flexibility at 63, error risk at 28, and implementation burden at 36. The weighted result would be DLB = 0.25(84) + 0.20(76) + 0.20(68) + 0.15(63) – 0.10(28) – 0.10(36), which equals 52.85 on the chosen scale. The number is not a claim about Paige Prostate performance. It is a way to ask why the score is not higher and what action would improve readiness.

The model becomes useful when the components lead to decisions. If infrastructure is low, the laboratory invests in scanner validation and image governance before expanding use. If workflow efficiency is low, pathologists and informatics staff review the viewer and reporting interface. If error risk is high, training and discrepancy monitoring intensify. If implementation burden is high but benefits are high, leadership may proceed with a phased launch rather than a broad rollout.

A model of this kind protects against both resistance and enthusiasm. It prevents leaders from rejecting AI without examining potential benefit, and it prevents them from adopting AI because modern language is persuasive. It asks the laboratory to show where the benefit will be realized and where the burden will be carried.

Figure 3. Author-developed visual prepared for NYCAR publication use. Copyright © June 2026 Ogochukwu I. Okoye. All rights reserved.

Table 2. Diagnostic-load balance model variables

Variable Meaning Local evidence
V Validated infrastructure Scanner/display validation, image-quality logs.
A Assistive review value Alert usefulness, user review feedback.
E Workflow efficiency Turnaround time, click burden, case routing.
F Workforce flexibility Remote review, consultation, staff coverage.
R Error risk Discrepancies, missed/false alerts, excluded cases.
B Implementation burden Training, support, cybersecurity, monitoring workload.

Note. Variables are author-developed planning variables, not private clinical data.

Chapter 7: Governance, Accountability, and Monitoring

7.1 Governance structure

AI-assisted digital pathology needs a defined governance structure before routine clinical use. A pathology AI committee or equivalent clinical governance forum can bring together pathologists, laboratory managers, informatics staff, cybersecurity leads, quality officers, procurement, data protection personnel, and patient safety representatives. The point is not to create a larger committee. The point is to place all relevant risks in one accountable forum.

Decision rights are explicit. Who approves go-live? Who authorizes a software update? Who reviews discrepancy events? Who can suspend use if image quality fails or alert behavior changes? Who communicates with clinicians if turnaround is affected? These decisions cannot be left to informal goodwill because diagnostic services operate under pressure.

Governance needs a record. Minutes, validation files, training logs, incident records, discrepancy reviews, and user feedback provide the history of the system. If an adverse event occurs, the laboratory shows not just that the device was authorized, but that the service was governed responsibly.

7.2 Cybersecurity and data control

Digital slides are patient data. They contain diagnostic material, identifiers, and sometimes links to clinical histories. AI-assisted pathology therefore raises cybersecurity and privacy duties that are not optional add-ons. Access control, encryption, logging, backup, vendor connectivity, and incident response all belong to the clinical safety case.

Cybersecurity failure in a pathology service can be more than a privacy breach. It can interrupt diagnosis, delay reporting, corrupt confidence in data, or compromise availability of prior slides. Health-service leaders can treat digital pathology infrastructure as critical clinical infrastructure. A laboratory that cannot access images or verify integrity cannot deliver diagnosis safely.

Vendor relationships require particular care. Contracts can address data use, update control, service availability, support response, security obligations, audit rights, and exit arrangements. Procurement cannot be separated from clinical governance. The terms under which data, software, and support are managed will affect diagnostic service quality.

7.3 Monitoring after implementation

Post-implementation monitoring is the difference between launch and learning. The laboratory can know whether the tool changes turnaround time, review behavior, case routing, discrepancy patterns, alert burden, user confidence, and consultation demand. Without monitoring, adoption becomes an act of faith.

Monitoring preserves professional judgment. A pathologist’s disagreement with software is not automatically an error, and a software alert is not automatically correct. The audit process can examine cases carefully, looking at the tissue, context, report, and user behavior. A crude scorecard could punish appropriate clinical independence.

The monitoring cycle can lead to action. If a recurring artifact creates false alerts, the scanning or preparation process needs review. If users report workflow friction, the interface or local routine needs change. If discrepancy review identifies a pattern, training or scope may need adjustment. AI governance earns trust when it changes practice in response to evidence.

Figure 4. Author-developed visual prepared for NYCAR publication use. Copyright © June 2026 Ogochukwu I. Okoye. All rights reserved.

Chapter 8: Implementation Priorities

8.1 Readiness assessment

Implementation begins with readiness. A site can know whether whole-slide imaging is already validated for relevant diagnostic purposes, whether scanner capacity can handle the expected load, whether storage and network performance are reliable, whether displays meet diagnostic needs, and whether pathologists have time to participate in validation. These are not IT questions alone. They are diagnostic service questions.

Readiness assessment is documented in plain language. Boards and senior leaders require an understanding of the clinical path, not just the procurement logic. The assessment states what the tool will be used for, what it will not be used for, what evidence supports the use, what local validation showed, what burdens remain, and what conditions would trigger review.

The site can decide the launch route. A phased rollout may begin with a limited group of trained users and a defined case type. Early months can then be treated as a supervised period with active feedback. Broad rollout without early learning may look efficient, but it exposes the service to wider variation before the local system understands its own weak points.

8.2 Patient and clinician communication

Patients do not need a technical tutorial on AI, but they deserve truthful communication when diagnostic services change in ways that affect care. Clinical teams need language that explains assistive review without implying that diagnosis is being handed to software. The message is simple: digital tools may support review, while the pathologist remains responsible for diagnosis.

Referring clinicians need clarity. They requires knowledge of whether AI assistance affects report timing, case selection, consultation, or escalation. If a service is in phased rollout, clinicians require knowledge of what that means. Ambiguity can create anxiety, especially in cancer pathways where patients and treating teams are waiting for decisive reports.

Communication helps protect trust after problems. If a technical fault delays reporting or a software update requires temporary suspension, the service needs a plan for informing affected clinical teams. Silence is rarely neutral in cancer services. It can turn a manageable delay into loss of confidence.

8.3 Procurement and cost realism

Procurement can count the whole system. The cost of AI-assisted digital pathology includes software, scanner capacity, storage, network infrastructure, cybersecurity, validation time, staff training, quality review, support, and ongoing monitoring. A narrow licensing cost can make the investment appear simpler than it is.

Cost realism is not hostility to innovation. It protects innovation from backlash. When leaders approve a project on unrealistic assumptions, implementation teams are left to absorb the hidden work. The result may be delayed launch, frustrated pathologists, insecure workarounds, and weakened credibility. A better business case names the work honestly before approval.

The cost case can include potential value: reduced review delay, improved consultation, more flexible staffing, earlier identification of suspicious foci, and better audit. These benefits need local evidence. A service cannot manage what it refuses to measure.

Chapter 9: Extended Professional Analysis

9.1 Equity and access

AI-assisted digital pathology can widen access to expertise, but it can deepen inequity if only well-funded centers can implement it safely. A pathology service in a large academic hospital may have mature scanning infrastructure, informatics teams, and digital governance. A smaller service may face older systems, fewer pathologists, weaker network support, or limited capital. If adoption becomes a symbol of prestige rather than a pathway to safer diagnosis, the gap between institutions may grow.

Equity appears within the evidence base. Algorithms are trained and tested on particular slide preparations, scanners, staining patterns, populations, and case distributions. Local validation asks whether the local tissue, workflow, and patient population are adequately represented. A tool that works well in one setting may not perform the same way elsewhere.

Access to diagnostic quality matters because cancer care is time-sensitive and geographically uneven. Digital pathology can support expert review across distance, but only if infrastructure reaches beyond the better-resourced center. Policy leaders can view digital pathology as part of cancer-service capacity, not just as a laboratory modernization project.

9.2 Ethics of professional dependence

The ethical question is not whether pathologists may use tools. Medicine has always used tools. The question is whether the tool changes dependence in a way that weakens judgment. If a clinician gradually stops looking as carefully because software has become familiar, safety declines. If software highlights a region and the clinician checks more carefully, safety may improve.

Professional dependence is shaped by culture. A laboratory can cultivate careful use by encouraging challenge, documenting disagreement, reviewing missed or false alerts, and refusing to frame AI as superior to the pathologist. A vendor can support ethical use by being clear about intended use and limitations. A governance board can support ethical use by refusing exaggerated claims.

Ethical implementation requires accountability to patients. A patient harmed by diagnostic delay or error cannot face an institution that says the software did it or the pathologist did it without explaining the pathway. Responsibility in AI-assisted diagnosis is legible. The human system that adopted the tool remains answerable for the conditions of use.

9.3 Research needs

Future research can move beyond adoption narratives. Laboratories need evidence about turnaround time, discrepancy patterns, false-alert burden, user confidence, training quality, cost, equity, and patient-level outcomes after implementation. Evidence from controlled studies is important, but service evidence is different. It shows whether the tool survives real laboratory life.

Multi-site studies would be especially valuable because digital pathology systems vary. Scanner models, staining practices, case mix, staffing, local validation, and reporting habits differ across sites. A study that works in one institution may not answer questions for another. General claims are supported by diverse settings.

Research requires workforce experience. Pathologists and laboratory staff can explain whether the tool reduces cognitive load, adds friction, supports consultation, or creates new administrative tasks. Without that evidence, leaders may mistake technical performance for service success.

Figure 5. Author-developed visual prepared for NYCAR publication use. Copyright © June 2026 Ogochukwu I. Okoye. All rights reserved.

Chapter 10: Recommendations and Final Position

10.1 Recommendations

Laboratories considering Paige Prostate or similar tools can begin with intended use. The software is used only for the case types and purposes supported by the regulatory and local validation record. Intended use belongs in training, protocols, audit, and case selection. It cannot remain a sentence in a procurement file.

Whole-slide imaging validation is complete before AI support becomes routine. Scanner performance, image quality, display conditions, viewer usability, and case equivalence need documentation. The laboratory can keep a validation file that a clinical governance board can understand.

Pathologist authority needs explicit protection. Reports remain signed by responsible pathologists. Disagreement with software is possible, recordable, and reviewable. No productivity target can imply that algorithmic highlighting reduces the duty of diagnostic review.

Post-implementation monitoring can begin at launch. Turnaround time, discrepancy review, alert burden, user feedback, technical downtime, cybersecurity events, and excluded cases is reviewed on a defined schedule. Early problems can produce local changes, not quiet tolerance.

Cybersecurity and data control is governed as clinical safety issues. Slide images, patient identifiers, access logs, vendor connectivity, backups, and incident response need clinical oversight as technical management. The laboratory cannot diagnose safely if the digital record is unavailable, insecure, or untrusted.

10.2 Final position

The final position of this publication is cautious in form and constructive in purpose. Paige Prostate shows that AI-assisted pathology has moved from speculation into regulated clinical support. That is important. It does not mean that laboratories can buy diagnostic safety in a software package.

The value of AI-assisted pathology appears when the laboratory already has the discipline to use it: validated digital infrastructure, trained pathologists, documented workflow, clear governance, protected data, and continuous monitoring. Without those conditions, the technology may still look advanced, but the patient’s diagnostic pathway may become harder to trust.

Digital pathology is therefore a test of health-service maturity. A mature service welcomes tools that support diagnostic attention while refusing to surrender judgment. It measures improvement rather than assuming it. It protects the workforce rather than treating staff as an obstacle to automation. It explains responsibility clearly. That is the standard a clinical AI program can meet.

Chapter 11: Applied Laboratory Assurance Protocol

11.1 Evidence register for local use

A laboratory that adopts assistive AI needs an evidence register that does more than store vendor paperwork. The register can show what the laboratory knows about the system it is using, how that knowledge was produced, and which decisions follow from it. A useful register begins with intended use, scanner and viewer validation, image-quality criteria, user training records, local case-set review, discrepancy review rules, cybersecurity approvals, and update-control procedures.

The evidence register is written for several audiences. Pathologists require knowledge of how the system behaves during review. Laboratory managers require knowledge of staffing, maintenance, and turnaround effects. Information-governance staff require knowledge of how patient images move and where they are stored. Senior leaders require knowledge of what risk the organization has accepted. The register is therefore a translation tool as much as a compliance record.

A weak register produces predictable confusion. When software is updated, nobody knows whether local validation is repeated. When a scanner is replaced, nobody knows whether images remain equivalent. When a pathologist questions an alert, nobody knows whether the event belongs in quality review. When cybersecurity arrangements change, nobody knows whether clinical staff need new instructions. The register reduces those gaps because it keeps the service history in one place.

The register can contain exceptions, not just approvals. If a case type is excluded, the reason belongs in the record. If an alert category is considered unreliable, that fact belongs in the record. If the launch is limited to a defined user group, the boundary belongs in the record. An evidence register that records only success tells the least useful part of the story.

11.2 Local validation set design

Local validation needs a case set that reflects the work the laboratory plans to do. Prostate biopsy material requires a range of benign cores, small suspicious foci, definite carcinoma, artifacts, inflammation, common mimics, and image-quality variation. The point is not to create a perfect experimental study. The point is to prevent the laboratory from learning too late that local material differs from assumptions made during procurement.

Case-set design is reviewed by pathologists who understand the local diagnostic workload. Informatics teams can support file handling and image preparation, but they cannot decide alone whether the cases are diagnostically adequate for validation. The professional eye of the pathologist remains central because the danger lies in clinical nuance, not just pixel quality.

Validation results is discussed in terms of decisions. If the tool performs acceptably only when images are of a certain quality, the service needs an image-quality gate. If users disagree about how to respond to alerts, the training material needs revision. If review time increases during early use, the rollout plan may need a slower schedule. Validation is useful only when it changes how the service is managed.

A good validation protocol protects against retrospective storytelling. Without predefined criteria, teams may explain away weak results because the project already has momentum. Criteria is agreed in advance: acceptable discrepancy, user confidence, turnaround effect, technical failure, and escalation triggers. Predefinition makes local judgment fairer.

11.3 Update control and version accountability

Software systems change. That fact is often treated as ordinary IT maintenance, but in clinical AI it may affect diagnostic behavior. A minor interface adjustment can change how an alert is noticed. A model update can change sensitivity, specificity, or the pattern of highlighted regions. A viewer update can change performance or user navigation. A laboratory that does not govern versions cannot confidently explain what system produced a given clinical condition.

Version accountability requires a policy. The policy states how software updates are announced, who reviews them, what level of revalidation is required, how users are informed, and how the change is recorded. Some updates may require only technical confirmation. Others may require renewed clinical testing. The difference cannot be left to the vendor alone.

Update control matters for retrospective review. If a discrepancy is found six months after a report, the laboratory may require knowledge of which software version, scanner, viewer, and workflow were in use at the time. A system without version history makes accountability harder. This is not administrative excess. It is the record needed to understand clinical events.

The safest update culture is neither rigid nor careless. It allows improvement while protecting clinical evidence. New versions may bring better performance, but each change needs an accountable route into practice.

Chapter 12: Patient Safety, Equity, and Public Trust

12.1 The patient behind the slide

Digital pathology writing can become abstract because slides, algorithms, scanners, and dashboards dominate the language. Patient safety requires the opposite discipline. Behind every prostate biopsy is a person waiting for a result that may lead to surveillance, surgery, radiotherapy, systemic treatment, or relief. Turnaround time, accuracy, clarity, and continuity matter because a report enters a life, not just a database.

The patient rarely sees the laboratory, yet the laboratory shapes the patient’s options. A delayed report can postpone the next appointment. An unclear report can complicate clinical explanation. A missed focus can delay cancer recognition. An overcalled finding can lead to anxiety and unnecessary intervention. These consequences give digital pathology its ethical weight.

AI assistance can therefore be judged by what it does to the patient pathway. Does it help reports become safer and timelier? Does it support clinicians with clearer information? Does it reduce bottlenecks in consultation? Does it introduce unexplained variation? Does it widen access for patients in sites with limited subspecialty expertise? These questions keep the system honest.

12.2 Equity in digital implementation

Equity concerns arise in several places. Wealthier health systems may adopt digital pathology earlier, while lower-resource services remain dependent on older infrastructure. Urban centers may gain subspecialty digital networks while smaller hospitals struggle with scanner procurement or network reliability. If digital pathology becomes a premium capability rather than a shared diagnostic asset, patients may experience uneven access to advanced review.

Equity concerns data. AI systems reflect the material used to develop and test them. Tissue preparation, scanner types, staining practices, and case populations vary. Local validation provides one safeguard, but it cannot answer every population question. Laboratories can watch for patterns in which the system behaves differently across preparation methods, case sources, or patient groups.

An equity-minded implementation plan includes access, geography, and service distribution. It asks whether remote review can help under-served areas, whether network costs will exclude smaller sites, whether staff in all settings receive adequate training, and whether patient pathways are improved where diagnostic delay is greatest. Digital pathology can support fairness only when fairness is part of the design.

12.3 Public trust and explanation

Public trust in medical AI is fragile because patients may hear the word artificial intelligence and imagine replacement, surveillance, or experimentation. A health service that uses AI-assisted review needs language that is factual and calm. The patient can understand that the pathologist remains responsible, that the tool is used within an approved and validated pathway, and that the purpose is to support careful review.

Overpromising damages trust. Claiming that AI removes error or solves workforce pressure will eventually collide with real clinical complexity. Underexplaining damages trust. If patients discover later that AI was used and the service never explained how responsibility was protected, suspicion may follow. The correct public voice is direct: the tool may support review; the diagnosis remains a professional act; the laboratory monitors the service.

Explanation is needed inside the organization. Clinicians who receive reports requires knowledge of the service pathway well enough to answer patient questions. Laboratory staff requires knowledge of what is being implemented and why. Governance teams can understand the evidence. Trust is built when explanation travels with the technology.

Appendix A: NYCAR Implementation Checklist for AI-Assisted Digital Pathology

A.1 Governance checklist

The implementation checklist begins with a question that is often skipped because it sounds too simple: what exactly is the system intended to do in this laboratory? The answer can name the specimen type, user group, scanner pathway, review sequence, reporting effect, exclusion criteria, and decision owner. If the answer cannot be written clearly, the service is not ready for launch.

The governance checklist requires: intended use statement; local validation approval; named clinical lead; named laboratory operations lead; information-governance review; cybersecurity approval; vendor-support route; version-control rule; incident-reporting route; discrepancy-review schedule; user training log; patient and clinician communication plan; and suspension criteria. Each item needs an owner and a date.

The checklist is not designed to slow useful technology. It prevents ambiguity from becoming clinical risk. A laboratory under pressure may want to move quickly, yet speed without accountable preparation creates future delay. The checklist gives leaders a way to move with discipline.

A.2 Monitoring checklist

Monitoring begins with the everyday questions of the service. Are reports being completed on time? Are pathologists comfortable using the tool? Are alerts clinically useful? Are there repeated false signals? Are cases being excluded for image-quality reasons? Are scanner or viewer problems delaying review? Are cybersecurity or access problems affecting availability?

The monitoring file can contain numerical measures and narrative review. Numbers may show that turnaround time improved, but users may still report frustrating alert placement. Numbers may show few discrepancies, but a small number of serious events may require immediate action. Narrative review prevents metrics from becoming a substitute for professional judgment.

An annual review asks whether the tool remains fit for purpose. The answer may be yes, but it is earned. The service may need updated training, revalidation after software changes, review of excluded cases, or revised governance if the case mix has changed. Continuing use is a decision, not an assumption.

A.3 Evidence table

A final evidence table is maintained by the laboratory. It lists each source of evidence, the date reviewed, the decision made, and the next review point. FDA material, CAP guidance, local validation, user feedback, discrepancy review, technical incident records, cybersecurity review, and patient-pathway metrics belong in the same governance file because they describe one clinical service.

The value of this table appears when something goes wrong. Leaders can see what was known, what was decided, and where the service may have failed. That visibility supports learning. It protects staff from vague blame because the pathway becomes easier to reconstruct.

AI-assisted digital pathology will continue to develop. New tools will extend beyond prostate biopsy review into other tissues, tasks, and reporting practices. The checklist in this appendix gives laboratories a practical way to evaluate each new claim: define the use, validate locally, protect professional authority, monitor after launch, and keep the patient’s diagnostic pathway at the center.

Chapter 13: Case Scenarios in Diagnostic Governance

13.1 Small focus in a high-volume session

A useful way to test the governance framework is to imagine an ordinary high-volume reporting session. The pathologist is reviewing many prostate biopsy cores. Most are benign. The danger is not dramatic incompetence; it is fatigue, repetition, time pressure, and a small suspicious focus that does not announce itself. In that setting, assistive software may have value because it can direct attention to a region that deserves careful inspection.

The managerial point is not that the software becomes the diagnostician. The point is that the service has created a The next point layer of attention inside a repetitive task. If the alert is well integrated, the pathologist can examine the region, agree or disagree, and continue with professional control. If the alert is poorly integrated, it may distract, slow review, or create doubt without adding useful information.

A governance review of this scenario would examine whether the pathologist saw the alert, whether the alert was clinically appropriate, whether review time changed, and whether the final report reflected independent interpretation. This case raises training questions. Pathologists require knowledge of how to respond to low-confidence, high-confidence, and apparently mistaken signals without turning the software into either an authority or an annoyance.

The scenario is ordinary, which is why it matters. Patient safety is often protected not by rare heroic interventions but by better design of repeated work. If AI assistance reduces the chance that a small focus is missed during routine review, the effect may be clinically meaningful. That benefit still depends on validation, usability, and monitoring.

13.2 Image-quality failure

Another scenario begins with a flawed scan. The tissue may be folded, focus may be weak, staining may be uneven, or an image tile may fail. A human pathologist may notice the problem because the image feels wrong during review. An algorithm may behave unpredictably because the image no longer matches the expected input. The service needs a rule for this situation before it occurs.

Image-quality failure is not a minor technical event. It can alter diagnostic confidence. The laboratory needs a process for identifying poor scans, rescanning, excluding cases from AI support, and documenting the decision. The scanner operator, pathologist, and quality lead all have roles. A system that sends poor images into assisted review without a gate is placing software into a setting it was not designed to manage.

Monitoring image-quality failures can reveal deeper service issues. A recurring focus problem may point to scanner maintenance. A staining variation may point to laboratory preparation. A pattern in particular specimen types may require additional validation. The AI tool becomes part of a wider quality conversation because its behavior depends on the images it receives.

The safest service culture treats technical faults as clinical information. Staff are encouraged to report poor images, pathologists are supported when they request rescanning, and leadership sees the cost of rescanning as part of diagnostic protection rather than wasted time.

13.3 Remote consultation under pressure

A The final point scenario involves remote consultation. A smaller hospital scans a prostate biopsy case and seeks subspecialty input from a pathologist at another site. Digital pathology makes that consultation easier because the slide can move without moving glass. AI assistance may help identify regions for discussion. The patient may benefit from faster access to expertise.

Remote consultation still requires a controlled pathway. The receiving pathologist needs adequate display conditions, secure access, case context, clinical history, and a reporting route. The originating laboratory can know how the consultation will be documented and how responsibility is shared. If software alerts are used, the consultative record can make clear whether they informed discussion or whether the consultant conducted a separate review.

This scenario shows why digital pathology can be a workforce strategy. Scarce expertise can be distributed across geography. Services can collaborate without courier delays. Yet the governance becomes more complicated because multiple organizations, systems, and professionals may be involved. Contracts, data-sharing rules, indemnity, response times, and quality review all need attention.

The practical lesson is that remote review is not less formal than on-site review. It may require more explicit governance because the familiar cues of the local laboratory are absent. A digital consultation pathway that is secure, documented, and clinically clear can improve access. An informal pathway can create new uncertainty.

Chapter 14: Management Metrics and Board Assurance

14.1 Board-level indicators

A board or senior clinical governance committee does not can see every software alert. It does need a small set of indicators that reveal whether the service remains safe and useful. Suitable board-level indicators include validated case scope, turnaround time, excluded cases, image-quality failures, discrepancy-review outcomes, user feedback, cybersecurity incidents, software version status, and training completion.

The point of board assurance is not to pull diagnostic judgment into executive meetings. It is to ensure that leaders who approve investment and risk understand whether the system they authorized is behaving as expected. AI-assisted pathology may be technically complex, but its assurance questions can be made legible: is it being used for the approved purpose, is it reliable in local use, are staff prepared, are exceptions managed, and is patient care affected?

A board report can separate facts from interpretation. Facts include numbers: number of cases reviewed, excluded scans, average turnaround time, discrepancy events, downtime, training completion. Interpretation explains what those numbers mean. A rising exclusion rate may indicate poor image quality, more cautious users, or better detection of unsuitable cases. Governance requires explanation, not just counting.

The board can see unresolved risks. If an update is pending, if storage capacity is under pressure, if a user group has not completed training, or if turnaround gains have not appeared, those points belong in the report. Mature governance does not hide uncertainty until after harm.

14.2 Laboratory-level metrics

Laboratory leaders need a more detailed view than the board. They require knowledge of where work slows, where staff struggle, which cases are excluded, how often rescanning occurs, whether alerts are useful, and how frequently users disagree with the system. These metrics belong close to the people doing the work because they can change practice quickly.

Useful laboratory measures include scan-to-view time, view-to-report time, rescan rate, AI-alert review time, report amendment frequency, consultation rate, and technical-support response time. Some measures will be affected by case complexity, so leaders can interpret trends with pathologist input. A higher consultation rate may indicate uncertainty, but it may indicate better use of expertise.

Metrics cannot be weaponized against pathologists. If users fear that disagreement or slower review will be judged as failure, they may stop reporting useful concerns. Early implementation needs a learning culture. The goal is to understand how the service behaves, not to produce a perfect dashboard.

A laboratory metric is valuable when it leads to change. If scan-to-view time is slow, network or storage performance may need work. If rescan rates rise, slide preparation or scanner maintenance may be at issue. If alert burden is high, training or case-scope refinement may be needed. The metric is the beginning of action, not its substitute.

14.3 Patient-pathway metrics

Patient-pathway metrics connect the laboratory to the wider cancer service. A pathology report enters a chain that includes the urologist, multidisciplinary team, treatment planning, and patient communication. If the AI-assisted pathway improves internal laboratory measures but has no effect on patient-facing timelines, the service can understand why.

Patient-pathway metrics might include biopsy-to-report time, report-to-clinician review time, report-to-MDT time, and report-to-treatment decision time. The laboratory does not control every part of that chain, but it influences it. A diagnostic service that sees only its own turnaround may miss the point at which diagnostic delay reappears elsewhere.

These metrics help justify investment. Senior leaders are more likely to support digital pathology when the service can show effects beyond internal efficiency. A faster and safer report can contribute to cancer pathway performance, clinician confidence, and patient reassurance. The benefit becomes visible when it is linked to the path the patient actually travels.

Patient-pathway measures need careful interpretation because improvement may be blocked by downstream constraints. If reports are faster but treatment appointments remain delayed, the pathology service has still improved its part of the system. The lesson is that diagnostic innovation and wider cancer capacity are governed together.

Chapter 15: Research Limits and Future Agenda

15.1 Limits of public evidence

This publication relies on public regulatory and professional evidence. That is appropriate for a master’s research publication, but it creates limits. Public evidence can describe authorization, intended use, guidelines, and published concerns. It cannot show every private laboratory decision, every user experience, every local discrepancy, or every vendor support event. A reader can therefore treat the framework as a disciplined planning model rather than a completed evaluation of all Paige Prostate deployments.

The limits are not a weakness when they are named. Many institutional publications lose credibility because they pretend to have more data than they actually have. This study does not report private coefficients, hidden patient outcomes, or confidential performance logs. It identifies the data that responsible organizations would can collect.

Those data include local validation results, case exclusions, alert patterns, user disagreement, turnaround time, discrepancy review, technical downtime, training completion, update history, and patient-pathway effects. A hospital or laboratory adopting AI-assisted pathology could use those data to produce a much more reliable empirical study after implementation.

The research position is therefore modest and useful. Public evidence supports the case for careful adoption. Local evidence decides whether adoption has improved the service.

15.2 Future research questions

Future research can examine AI-assisted pathology in real laboratory workflows across multiple sites. A useful study would compare sites with different scanners, case volumes, staffing patterns, digital maturity, and governance models. It would ask whether AI assistance changes diagnostic turnaround, pathologist workload, discrepancy rates, consultation patterns, and user confidence. It would not stop at accuracy.

Research can examine patient communication. Patients may respond differently to the use of AI in diagnosis depending on how it is explained, whether responsibility is clear, and whether the service has public trust. A patient-centered study could examine what language supports understanding without creating fear or false certainty.

Workforce studies are needed because AI adoption can be felt differently by pathologists, laboratory scientists, informatics teams, and managers. The same tool may reduce one kind of work while increasing another. A serious workforce study would examine transition burden, training time, troubleshooting, remote review, peer consultation, and job satisfaction.

Equity research can examine whether digital pathology and AI assistance reduce geographic variation in diagnostic access or widen it. If high-resource centers gain better tools while lower-resource centers fall behind, the technology may improve some services while leaving structural inequity intact. Equity is measured, not assumed.

15.3 Closing research statement

Digital pathology and AI-assisted diagnosis will keep moving. The question for health systems is not whether the field can be stopped. It cannot. The question is whether adoption will be governed with enough clinical discipline to protect patients and enough workforce realism to protect the professionals who carry diagnostic responsibility.

Paige Prostate is a valuable case because it keeps the discussion concrete. It shows a defined device, a defined intended use, a defined diagnostic field, and a defined human role. That specificity allows better thinking. Instead of asking whether AI is good or bad for medicine, the study asks how one assistive system can be governed in one sensitive diagnostic pathway.

The answer is neither rejection nor celebration. The answer is stewardship. Validate the digital pathway. Protect pathologist authority. Monitor performance. Count the implementation burden. Respect patient trust. Use AI where it supports diagnostic attention, and refuse to let the language of innovation outrun the conditions of safe clinical use.

Appendix B: Diagnostic Incident Review Scenarios

B.1 Discrepant case after sign-out

A discrepant case after sign-out is the moment when governance becomes visible. Suppose a later review identifies a suspicious focus that was not included in the original report. The laboratory’s The opening point obligation is clinical: determine whether the patient’s care needs correction and whether the treating team requires immediate information. The next obligation is analytic: reconstruct the pathway without rushing to a convenient explanation.

The review file can identify the original slide, scanner, software version, user, case context, image quality, alert behavior, report timing, and any peer consultation. If the AI tool highlighted the region and the pathologist did not agree, the review asks how the disagreement was handled. If the AI tool did not highlight the region, the review asks whether this case falls outside expected behavior or whether a pattern is emerging. If the image was poor, the review asks why it passed the quality gate.

This process protects fairness to staff because it avoids shallow blame. A missed focus can arise from tissue quality, scanning, workflow pressure, communication, or interpretation. The review can identify the system conditions that made the event possible. It can then decide whether training, case selection, scanning practice, peer review, or monitoring thresholds need change.

The result of a discrepant-case review is recorded in a form that can be learned from later. If the same type of problem appears again, the laboratory cannot can rediscover the earlier lesson. A diagnostic incident has value only if it changes the probability of repetition.

B.2 Vendor-supported investigation

Some events will require vendor involvement. A laboratory may observe unusual alert behavior, performance slowing, display problems, or suspected software malfunction. Vendor support can be essential, but the laboratory remains responsible for clinical governance. A vendor investigation cannot replace internal assessment of patient impact.

The service needs rules for vendor-supported review. What data may be shared? How are patient identifiers protected? Who authorizes transfer? What timeline applies? How is the vendor’s response reviewed by clinical staff? How is the event recorded? These details can exist before an incident, because urgent situations are poor times to design data-governance rules.

A vendor may provide technical explanations, log review, patch information, or guidance. Clinical leaders then decide what those explanations mean for diagnostic practice. If the issue affects a past case, clinical review is needed. If it affects future cases, scope or use may need temporary restriction. If it affects trust in a software version, update control becomes central.

Vendor relationships are most reliable when they are honest and bounded. The vendor knows the product. The laboratory knows the patient pathway. Good governance uses both forms of knowledge without confusing their responsibilities.

B.3 Temporary suspension of AI support

A mature service knows how to pause. Temporary suspension is not failure when evidence requires caution. It is one of the signs that governance has authority. If image-quality failure rises, if software behavior changes after update, if cybersecurity access is in question, or if users report serious concern, the laboratory may can suspend assisted use while continuing diagnostic work through validated conventional or digital review pathways.

Suspension criteria is written before launch. The criteria may include unresolved serious discrepancy, unknown software behavior, inability to access images securely, major scanner fault, failed version-control review, or inadequate user training after staff change. The criteria give staff confidence that safety will not be negotiated under pressure.

A suspension plan can name the alternative workflow. Cases may be reviewed without AI assistance, sent for peer review, routed to another validated scanner, or held for rescanning depending on urgency and clinical need. The patient pathway remains the priority. The suspension cannot become an excuse for unmanaged delay.

Restart needs criteria. The service cannot resume because everyone is tired of the pause. It can resume when the relevant issue has been investigated, the corrective action is recorded, users have been informed, and governance has accepted the residual risk.

B.4 Training after a learning event

A learning event becomes useful only when staff understand it. If a discrepancy review, image-quality problem, or workflow incident reveals a pattern, training can convert that finding into practice. Training after an event is different from launch training. It is grounded in a real weakness found in local use.

The training is specific. It may show a de-identified example of poor focus, explain when to request rescanning, clarify how to document disagreement with an alert, revise the escalation pathway, or remind users of intended-use boundaries. General reminders rarely change practice. Specific lessons do.

Training can respect professional dignity. The aim is not to shame the person closest to the incident. It is to help the service learn. A staff member who reports a problem cannot become the problem. If reporting is punished, the service will become quieter and less safe.

The final test of training is whether behavior changes. The laboratory can examine subsequent cases, user feedback, and event rates to see whether the lesson entered routine work. Education is not complete when slides are presented. It is complete when the safer habit appears in practice.

Appendix C: Variable Definitions for Local Evaluation

C.1 Diagnostic and workflow variables

Local evaluation requires variable definitions that staff can use consistently. “Turnaround time” can specify start and end points: receipt to scan, scan to pathologist view, view to report, or biopsy to clinician review. “Image-quality failure” can specify whether the problem concerns focus, tissue coverage, color, artifact, tile failure, file corruption, or display. “AI alert review” can specify whether the pathologist saw, examined, accepted, rejected, or ignored the alert.

“Discrepancy” cannot be a vague label. It can indicate whether the discrepancy concerns diagnostic category, grade, suspicious focus, report clarity, technical exclusion, or case routing. Different discrepancy types require different responses. A category-level diagnostic disagreement is not the same as a minor formatting issue in a report.

“Workflow friction” is captured through user reporting and observation. It may include slow image loading, excessive clicks, confusing alert display, difficulty returning to a region, mismatch between viewer and reporting system, or unclear case status. These points matter because they shape whether the tool can be used carefully during real diagnostic sessions.

Each variable requires a data owner. Without ownership, data collection collapses into aspiration. Scanner staff may own rescan rates; pathologists may own discrepancy classification; informatics staff may own downtime; governance may own review actions. Clear ownership turns evaluation from an idea into a routine.

C.2 Workforce and equity variables

Workforce variables requires user group, training completion, supervised-use period, review volume, overtime pressure, consultation demand, remote review use, and reported confidence. The aim is not surveillance of individuals. The aim is to understand whether the system helps or burdens the workforce.

Equity variables may include site type, referral source, geographic location, case-routing pattern, and access to subspecialty review. The laboratory can examine whether the digital pathway improves access beyond the central site or concentrates benefit where resources already exist. If AI-assisted digital pathology is treated as an equity tool, equity is measured.

Patient-pathway variables include biopsy-to-report time, report-to-clinician review, and report-to-treatment decision. These measures remind the service that diagnostic work belongs to a wider cancer journey. A laboratory metric that never reaches the patient pathway may be too narrow.

Evaluation remains proportionate. A small laboratory does not need an industrial analytics platform to begin. It can start with a clear register, a small dashboard, routine case review, and quarterly governance discussion. The discipline matters more than the polish of the spreadsheet.

C.3 Closing implementation note

The variables in this appendix are not a demand for endless measurement. They identify the minimum evidence needed to know whether an AI-assisted pathology pathway is becoming safer, slower, more useful, more burdensome, or more equitable. Without such evidence, leaders are left with impressions and vendor claims.

Local evaluation is revised after experience. Some variables may prove unhelpful. Others may become essential. The service can adapt the evaluation plan as it learns, while preserving enough consistency to detect trends over time.

The broader lesson is simple: clinical AI requires institutional memory. Every validation, update, incident, disagreement, training session, and monitoring review adds to what the laboratory knows about safe use. A service that records and acts on that knowledge becomes better. A service that forgets it is likely to repeat the same mistakes under a new name.

Appendix D: Board Assurance Questions

D.1 Questions for executives

Executives approving AI-assisted digital pathology need a line of inquiry that is plain enough for governance and serious enough for clinical risk. The opening question is whether the service can explain its intended use without relying on vendor language. If leaders cannot state where the tool fits, who uses it, what it supports, and what it does not do, the project is still too vague.

The next question is whether local validation has been reviewed by people with diagnostic authority. A board cannot accept a slide deck that says validation is complete without seeing the evidence category: case numbers, user groups, discrepancy findings, scanner environment, exclusion criteria, and sign-off. The board does not can read every case. It needs assurance that someone qualified has done so and that the result changed the implementation plan where needed.

Executives ask what will happen if the system is unavailable. A diagnostic service cannot be dependent on a tool without a fallback. If scanning fails, if the viewer is unavailable, if vendor support is delayed, or if a cybersecurity event restricts access, the laboratory needs a continuity pathway. The continuity plan is part of the decision to adopt.

A final executive question concerns benefit evidence. What will convince the institution after twelve months that the tool improved care or service resilience? The answer is written before launch. It may include reduced turnaround for qualifying cases, improved access to consultation, fewer avoidable rescans, better workload distribution, or clearer discrepancy review. If no benefit evidence is defined, the system may continue because it exists rather than because it helps.

D.2 Questions for pathology leaders

Pathology leaders ask whether the tool protects the diagnostic culture of the department. A healthy diagnostic culture allows disagreement, peer review, careful uncertainty, and escalation. If AI is introduced in a way that makes pathologists feel judged by a machine or hurried by productivity claims, culture may deteriorate. The leadership task is to make the tool serve professional practice rather than make professional practice serve the tool.

They ask how trainees and less experienced staff will encounter the system. AI support can educate attention, but it can distort learning if users treat highlights as the map of the case. Training can teach morphology The opening point and software behavior The next point. The pathologist has a duty to know why a region matters, not just that the system has marked it.

Pathology leaders can examine the impact on peer consultation. Digital workflows may make consultation easier, but they may reduce informal discussion if everyone works separately. Leaders can preserve the human spaces where difficult cases are discussed. Diagnostic quality depends on professional community as software.

The department can decide how it will handle skepticism. Some pathologists may distrust AI; others may be too eager. Both positions need evidence. The department can give users a structured way to raise concerns, compare cases, and influence local protocols. Adoption without professional ownership is brittle.

D.3 Questions for regulators and policy readers

Regulators and policy readers can use this case to see the difference between authorizing a device and building a diagnostic service. Authorization examines a defined product through a defined regulatory process. Service readiness examines whether local conditions can support safe use. Both are needed, and neither substitutes for the other.

Policy can encourage transparency around intended use, validation, monitoring, and responsibility. It can resist both blanket suspicion of clinical AI and blanket confidence in authorized products. The public interest lies in careful adoption: tools that improve attention and access, systems that remain accountable, and evidence that can be reviewed after implementation.

Digital pathology policy can consider smaller and lower-resource settings. If policy assumes that all laboratories can adopt at the speed of leading centers, it may widen variation. Support for shared infrastructure, regional networks, training, and cybersecurity may be necessary if AI-assisted pathology is to serve equity rather than prestige.

The final policy question is whether health systems can learn collectively. Each laboratory can monitor locally, but isolated learning is slow. De-identified implementation lessons, validation challenges, and workflow findings could help other services avoid repeated errors. The field will mature faster if clinical governance knowledge travels with technical progress.

D.4 Final assurance judgment

The final assurance judgment is not a slogan that the system is ready. It is a record of conditions. A proper judgment states that the intended use is defined, the digital pathway is validated, the users are trained, the clinical lead accepts the workflow, cybersecurity has been reviewed, monitoring is scheduled, and a suspension route exists if the evidence changes.

That judgment is dated and revisited. A service can be ready in June and less ready after a software update, staffing change, scanner replacement, or shift in case mix. Readiness is therefore a living condition. This is especially true in AI-assisted diagnosis, where the service depends on a relationship between people, images, software, and governance routines.

The professional lesson of the Paige Prostate case is that safety lives in the relationship among these parts. The scanner cannot replace the pathologist. The pathologist cannot compensate for a poorly governed digital environment forever. The vendor cannot own the patient pathway. The board cannot approve and then stop listening. The service is safe only when each actor understands the boundary of responsibility and the evidence that keeps the boundary honest.

For NYCAR purposes, this is the publication’s governing claim: clinical AI becomes worthy of trust only when its usefulness is carried by an accountable institution. A laboratory that can define, validate, monitor, pause, learn, and explain its AI-assisted work is not simply adopting technology. It is practicing diagnostic stewardship.

References

College of American Pathologists. (2025). Artificial intelligence in pathology resources. https://www.cap.org/member-resources/councils-committees/informatics-committee/artificial-intelligence-pathology-resources

Evans, A. J., Brown, R. W., Bui, M. M., Chlipala, E. A., Lacchetti, C., Milner, D. A., Pantanowitz, L., Parwani, A. V., Reid, K., Riben, M. W., & Validating Whole Slide Imaging Systems for Diagnostic Purposes in Pathology Guideline Update Expert Panel. (2022). Validating whole slide imaging systems for diagnostic purposes in pathology: Guideline update. Archives of Pathology & Laboratory Medicine, 146(4), 440–450.

International Organization for Standardization. (2023). ISO/IEC 42001:2023: Information technology—Artificial intelligence—Management system. ISO.

McGenity, C., Clarke, E. L., Jennings, C., Matthews, G., Cartlidge, C., Freduah-Agyemang, H., Stocken, D. D., & Treanor, D. (2024). Artificial intelligence in digital pathology: A systematic review and meta-analysis of diagnostic test accuracy. npj Digital Medicine, 7, Article 114. https://doi.org/10.1038/s41746-024-01106-8

National Institute of Standards and Technology. (2023). Artificial intelligence risk management framework (AI RMF 1.0). U.S. Department of Commerce. https://doi.org/10.6028/NIST.AI.100-1

Pantanowitz, L., Sinard, J. H., Henricks, W. H., Fatheree, L. A., Carter, A. B., Contis, L., Beckwith, B. A., Evans, A. J., Lal, A., & Parwani, A. V. (2013). Validating whole slide imaging for diagnostic purposes in pathology: Guideline from the College of American Pathologists Pathology and Laboratory Quality Center. Archives of Pathology & Laboratory Medicine, 137(12), 1710–1722.

Shafi, S., & Parwani, A. V. (2023). Artificial intelligence in diagnostic pathology. Diagnostic Pathology, 18, Article 109. https://doi.org/10.1186/s13000-023-01375-z

U.S. Food and Drug Administration. (2021). Evaluation of automatic class III designation for Paige Prostate (DEN200080). https://www.accessdata.fda.gov/cdrh_docs/reviews/DEN200080.pdf

The Thinkers’ Review

Juliet C. Nwaiwu

Gerontological Care Leadership and Quality of Life in Aging Societies

A Master’s-Level Case Study of NHS England Older People’s Care and Buurtzorg-Inspired Community Support

Research Publication by Juliet C. Nwaiwu
Institutional Affiliation: New York Center for Advanced Research (NYCAR)
Publication No.: NYCAR-TTR-2026-RP026
DOI: https://doi.org/10.5281/zenodo.20449332
Date: June 2026


Peer Review Statement

This research publication has been reviewed under the internal editorial framework of the New York Center for Advanced Research (NYCAR) and The Thinkers’ Review. The review assessed master’s-level coherence, gerontological source integrity, NHS England and Buurtzorg case suitability, quality-of-life reasoning, quantitative-model suitability, APA 7th alignment, safeguarding sensitivity, and professional relevance for ageing-care leadership. The work is approved for master’s-level NYCAR institutional publication.

Copyright © June 2026 Juliet C. Nwaiwu. All rights reserved. NYCAR.

Contents


Gerontological Care Leadership and Quality of Life in Aging Societies
A Master’s-Level Case Study of NHS England Older People’s Care and Buurtzorg-Inspired Community Support

Research Publication by Juliet C. Nwaiwu
Institutional Affiliation: New York Center for Advanced Research (NYCAR)
Publication No.: To be assigned
DOI: Not assigned
Date: June 2026

Peer Review Statement

This research publication has been reviewed under the internal editorial framework of the New York Center for Advanced Research (NYCAR) and The Thinkers’ Review. The review assessed master’s-level coherence, gerontological source integrity, NHS England and Buurtzorg case suitability, quality-of-life reasoning, quantitative-model suitability, APA 7th alignment, safeguarding sensitivity, and professional relevance for ageing-care leadership. The work is approved for master’s-level NYCAR institutional publication.

Copyright © June 2026 Juliet C. Nwaiwu. All rights reserved. NYCAR.

Contents

Abstract 3

Chapter 1: Introduction: Ageing as a Leadership Test 5

Chapter 2: Evidence Base and Conceptual Frame 9

Chapter 3: Methodology and Applied Measurement Design 13

Chapter 4: NHS England Case Analysis: Frailty, Recovery, and System Coordination 18

Chapter 5: Buurtzorg-Inspired Community Support and Relational Continuity 22

Chapter 6: Quantitative Model and Scenario-Based Findings 26

Chapter 7: Leadership Practice, Carer Reality, and Dignity-Centred Implementation 31

Chapter 8: Applied Care Scenarios: Dementia, Falls, Medicines, Housing, and Loneliness 36

Chapter 9: Board Assurance, Commissioning, and Local Implementation 40

Chapter 10: Recommendations and Final Position 45

Appendix A: Measurement Assurance and Local Data Rules 51

References 56


Abstract

Population ageing is often described through pressure: pressure on hospitals, pressure on adult social care, pressure on public finance, pressure on family carers. That language is not false, but it is incomplete. Longer life is also a social achievement, and the measure of a mature care system is whether added years are lived with safety, purpose, connection, and practical help. Older people do not experience care as a service map. They experience it in the stair they cannot climb, the tablet they cannot identify, the staff member they do not recognize, the daughter who is exhausted, the appointment that arrives too late, and the evening when loneliness becomes fear.

This master’s-level study examines gerontological care leadership and quality of life through two connected case lenses: NHS England older people’s care and Buurtzorg-inspired community support. NHS England’s public evidence shows the importance of integrated pathways, urgent community response, frailty care, discharge support, reablement, and short-term intensive support outside hospital where safe. Buurtzorg-derived practice adds a different lesson: relational continuity, professional discretion, small-team accountability, and the value of knowing the person’s home life rather than treating care as a chain of brief tasks.

The paper uses public evidence from NHS England, Age UK, the Care Quality Commission, the Office for National Statistics, the Centre for Ageing Better, the World Health Organization, Skills for Care, and peer-reviewed research on integrated care, Buurtzorg-derived models, self-managing teams, multimorbidity, virtual wards, and home-care supply. Quantitative reasoning is applied through a quality-of-life score, care-continuity index, dependency ratio, readmission-risk score, service-access time, and an integrated gerontological leadership index. These measures are presented as management tools, not as private NHS or Buurtzorg data.

The central argument is direct: gerontological leadership is credible only when it protects the lived conditions of ageing. A system that moves older people quickly but leaves them unsafe has failed. A system that records many visits but offers no continuity has failed. A system that praises home care while ignoring carers has failed. Quality of life in later life has to be governed as seriously as hospital flow, finance, and activity counts.

Keywords: gerontological care leadership; older people’s care; NHS England; Buurtzorg; quality of life; integrated care; reablement; care continuity; adult social care; ageing societies.

List of Tables and Figures

Table 1. Gerontological care leadership domains

Table 2. Scenario-based measures used in the study

Table 3. NHS England and Buurtzorg-inspired case comparison

Table 4. Implementation assurance questions

Figure 1. Integrated gerontological care leadership model.

Figure 2. Quality-of-life score component weights.

Figure 3. Scenario score profile for gerontological care review.

Figure 4. Case comparison: coordination and relational care.

Figure 5. Implementation cycle for ageing-care leadership.

Chapter 1: Introduction: Ageing as a Leadership Test

Ageing societies are often treated as a demographic problem, as if the growing number of older citizens were itself the crisis. That framing is too narrow. The real test lies in whether health and social care systems can organize timely, respectful, clinically safe, and socially intelligent support around people whose needs rarely fit one professional box. Longer life has been made possible by public health, housing improvements, medical treatment, education, better nutrition, and social protection. Yet a longer life can become painfully small when a person loses mobility, waits too long for help, fears falling, or becomes dependent on strangers who change from visit to visit.

Gerontological care leadership begins with that tension. It does not romanticize ageing, and it does not reduce older people to a burden. It asks how systems can protect function, confidence, dignity, and ordinary life when frailty, multimorbidity, dementia, poverty, housing insecurity, bereavement, and carer strain enter the same home. A person recovering from pneumonia may also live alone, struggle with arthritis, take twelve medicines, hear poorly, and depend on a niece who works full-time. A service that treats each fact separately will miss the person.

England gives this problem a sharp public setting. Age UK has reported persistent pressure in older people’s access to health and care, while the Centre for Ageing Better’s State of Ageing 2025 describes a large and diverse older population in which nearly one in five people in England are aged 65 and over. The Office for National Statistics continues to track population ageing and the growth of the oldest age groups. These are not abstract curves. They shape GP demand, ambulance calls, hospital discharge, home care, safeguarding, rehabilitation, housing adaptation, and the unpaid labour that families provide.

NHS England’s older people’s care examples are relevant because they try to move care closer to the person rather than leaving hospital as the default location for every crisis or recovery period. Short-term intensive support, urgent community response, frailty pathways, virtual wards, and integrated care in action all reveal a policy direction: the person’s own home can be a site of recovery when clinical risk is understood and community support is real. The qualification matters. Home is not safer by definition. Home may be warm, familiar, and supported. It may also be cold, lonely, cluttered, inaccessible, digitally excluded, or held together by a carer who has no reserve left.

Buurtzorg-inspired community support adds another lens because it places relational continuity and professional discretion at the center of home care. The original Dutch model is often discussed with admiration, but imitation is not the point of this study. Small self-managing teams cannot be lifted from one country and installed elsewhere by language alone. Funding rules, labour conditions, regulation, professional boundaries, records systems, safeguarding processes, and local culture determine whether the idea survives practice. Still, the Buurtzorg-derived literature offers an important challenge to task-driven care: older people benefit when professionals know them, know their homes, and can act with judgment rather than only complete a time-limited visit.

This publication treats gerontological care leadership as a management, ethics, and service-quality problem. The manager’s question is not only how many visits were delivered, how many beds were cleared, or how many assessments were completed. The deeper question is whether the service protected what made life livable for the older person: washing, eating, sleeping, moving safely, taking medicines correctly, seeing familiar faces, knowing whom to call, and feeling that decisions were made with rather than around them. Those outcomes are harder to count than throughput, but they are not less real.

The aim of the study is to examine how gerontological care leadership can improve quality of life in ageing societies. It uses NHS England older people’s care and Buurtzorg-inspired community support as applied case evidence, then develops practical indicators for quality of life, continuity, access, demographic pressure, and readmission risk. The publication does not present confidential patient records or private organizational data. It uses public evidence and scenario-based modeling to show how leaders can reason more responsibly about care quality.

The research questions follow from that aim. How does gerontological care leadership shape quality of life for older people? What do NHS England and Buurtzorg-inspired models reveal about integrated care, home-based recovery, continuity, and professional discretion? Which indicators can help managers measure quality without reducing people to scores? How can leaders identify readmission risk, access delay, carer strain, and continuity weakness before they become avoidable harm? What kind of service design protects dignity in later life?

The significance of the study lies in its refusal to treat ageing care as a peripheral concern. Older people’s care is a test of a society’s operational competence and moral seriousness. When the system fails, the consequences appear in emergency departments, delayed discharges, unsafe homes, avoidable admissions, unpaid carer collapse, and lives made smaller than they needed to be. When leadership is capable, the value is often quiet: a fall prevented, a medicine clarified, a daughter reassured, a known nurse arriving on time, a person regaining the confidence to wash and walk again.

Chapter 2: Evidence Base and Conceptual Frame

Figure 1. Integrated gerontological care leadership model. Copyright © June 2026 Juliet C. Nwaiwu / NYCAR. All rights reserved.

Gerontology begins with a simple warning: age alone explains very little. Two people of the same age can live radically different lives. One may be working, driving, caring for grandchildren, chairing a local group, and living with mild hypertension. Another may be housebound, bereaved, cognitively impaired, frightened of falling, and dependent on irregular visits. Between those poles lie many combinations of resilience, illness, loss, adaptation, pride, and need. Leadership that treats older people as one administrative category will always be late to reality.

The World Health Organization’s healthy ageing work is useful because it places functional ability at the center of the field. Healthy ageing is not limited to the absence of disease; it concerns the environments and opportunities that allow people to be and do what they value. The WHO ICOPE approach similarly emphasizes person-centred, coordinated care that attends to intrinsic capacity and functional ability across later life. For managers, this shifts the question. The service is not assessed only by diagnosis, activity, or discharge. It is assessed by whether the person can live with meaning, safety, and practical control.

Age UK’s recent reporting gives the English context more urgency. Its 2025 report reviewed a decade of change in older people’s health and care, and the 2024 edition noted that people aged over 50 already made up about two in five of England’s population, with the 85-plus group growing most rapidly. Those facts matter because very old age is often where frailty, dementia, multimorbidity, falls risk, sensory loss, bereavement, and care dependency cluster. Demography alone does not dictate crisis, but poor preparation converts demography into avoidable pressure.

The Care Quality Commission’s 2024/25 State of Care evidence also belongs in the core framework because it links delayed discharge to real capacity gaps. CQC reported that, for people in acute hospital for 14 days or longer in March 2025, lack of social care capacity and delays completing social care transfer plans accounted for 23 percent of delayed discharges, while access to rehabilitation, reablement, and recovery services accounted for 26 percent. These figures put gerontological leadership beyond the hospital ward. Older people cannot recover safely at home if the community layer is too thin to meet them.

Integrated care research makes the same point from another angle. Dambha-Miller, Simpson, Hobson, Chapman, and Damery examined integrated primary care and social services for older adults with multimorbidity in England and found a field marked by varied models, local complexity, and continuing implementation challenges. Multimorbidity does not respect professional boundaries. A person with diabetes, heart failure, arthritis, cognitive impairment, anxiety, and housing risk is not a sequence of problems. The person is one life with several interacting demands.

NHS England’s public case material on older people’s care shows how integrated care can work when it is attached to practical pathways. Its integrated-care-in-action example describes short-term intensive support for up to ten days, including nursing, therapeutic assessment, and social care, designed to help patients regain independence. The value of that example lies in its focus on the recovery bridge. Hospital treatment may stabilize illness, but recovery often depends on therapy, confidence, equipment, personal care, and home context. Without that bridge, a discharge becomes a transfer of risk.

Buurtzorg-derived models contribute a different kind of evidence. Hegedüs, Schürch, and Bischofberger’s scoping review described experiences with Buurtzorg-derived home care outside the Netherlands, while de Bruin, Doodkorte, Sinervo, and Clemens reviewed self-managing teams in elderly care. The findings do not support naive transplantation. They point to implementation conditions: staffing, autonomy, team preparation, supervision, local funding, and the ability to maintain accountability without suffocating discretion. The professional lesson is practical. Relationship-based care can improve the texture of support, but only when teams have the means to act responsibly.

Workforce evidence needs a place in the conceptual frame because care quality is embodied. It arrives through nurses, care workers, therapists, social workers, pharmacists, GPs, voluntary-sector staff, and family carers. Skills for Care’s workforce reporting continues to show recruitment and vacancy pressure in adult social care. A model of dignity that ignores workforce stability is ornamental. Older people experience staffing policy as who arrives, whether they arrive on time, whether they know the person’s routine, and whether they have enough time to do the work with care.

Quality of life provides the unifying concept. A service may be clinically safe and still leave a person lonely. It may be efficient and still leave a carer exhausted. It may reduce hospital days and still fail at medicines, food, washing, mobility, or trust. This study treats quality of life as a management outcome because it can be influenced by leadership decisions: staffing patterns, continuity rules, discharge design, assessment quality, carer support, housing links, volunteer partnerships, and the timing of rehabilitation.

Four concepts organize the analysis. The person is the unit of meaning. The care pathway is the unit of coordination. The home is the unit of lived risk. The local system is the unit of accountability. No single profession owns the whole answer. Leadership appears when these levels are brought into conversation and when the service refuses to hide behind one measure of success.

Read also: Value-Based Commissioning In Social Care Systems

Chapter 3: Methodology and Applied Measurement Design

Table 1. Gerontological care leadership domains

Domain Leadership question Quality-of-life relevance
Clinical safety Is risk recognized early and escalated properly? Protects health, confidence, and safe recovery.
Continuity Does the person see known staff often enough for trust and recognition? Supports dementia care, safeguarding, and emotional security.
Access time How long does support take to begin after need is identified? Reduces deterioration caused by delay.
Carer capacity Is unpaid labour being assessed and supported? Prevents hidden strain and avoidable crisis.
Home environment Does the home support the plan or undermine it? Links housing, equipment, falls prevention, and independence.


Figure 2. Quality-of-life score component weights. Copyright © June 2026 Juliet C. Nwaiwu / NYCAR. All rights reserved.

This study uses a mixed-methods case-study design. NHS England older people’s care and Buurtzorg-inspired community support are treated as applied cases, while quality of life in ageing societies is the management problem under examination. The qualitative strand reads public documents and research for the way they frame older people’s needs, service coordination, continuity, home-based recovery, and professional responsibility. The quantitative strand develops scenario-based measures for quality of life, care continuity, demographic pressure, readmission risk, access delay, and integrated leadership readiness.

Case selection is purposeful. NHS England older people’s care is selected because it operates within a national health and care system under visible pressure, with public guidance on urgent community response, frailty pathways, proactive care, discharge, integrated care, and home-based support. Buurtzorg-inspired practice is selected because it challenges task-based home care with a model that values self-managing teams, relational knowledge, and professional discretion. The cases are not treated as directly interchangeable. Their value lies in the contrast between system coordination and relationship-centred local practice.

The study uses public evidence only. Sources include NHS England materials, Age UK reports, CQC State of Care reporting, Office for National Statistics population evidence, Centre for Ageing Better analysis, WHO healthy ageing guidance, Skills for Care workforce reporting, and peer-reviewed research on integrated care, home care, Buurtzorg-derived models, self-managing teams, delayed discharge, multimorbidity, and virtual wards. No confidential NHS record, private Buurtzorg file, identifiable patient account, or unpublished local dataset is used.

That boundary matters. Papers on health and social care often lose credibility when they imply access to data they do not possess. This study avoids that error. The measures are not presented as actual NHS performance results or Buurtzorg outcomes. They are management tools that local leaders could adapt with lawful data, patient and carer involvement, and proper governance. The distinction between public evidence, scenario modeling, and local evaluation is maintained throughout the paper.

The primary quality-of-life score is expressed as QoL = 0.25I + 0.20S + 0.20C + 0.20H + 0.15F. I represents independence, S safety, C social connection, H health confidence, and F functional ability. Each component is scored from zero to 100. The weights are illustrative and can be changed after local consultation. A person with dementia, a person recovering from a stroke, and a person living alone after bereavement may rank the components differently. The score is a conversation tool, not a replacement for the person’s account.

The care-continuity index is expressed as CCI = known-team visits / total visits × 100. Continuity has clinical and emotional value. A familiar staff member may notice appetite change, new confusion, unsafe movement, carer strain, or neglected home conditions sooner than a rotating stranger. Yet continuity cannot become rigid protectionism that blocks urgent care. The measure is useful because it shows whether care planning values familiarity enough to measure it.

The dependency ratio is expressed as DR = older population / working-age population × 100. The measure helps local planners think about population structure, workforce demand, carer availability, housing adaptation, transport, and public-health priorities. It requires careful interpretation. Older people are not only users of care; many are workers, volunteers, carers, community leaders, grandparents, and financial contributors. The ratio is a planning signal, not a label of burden.

The readmission-risk score is expressed as RRS = 0.30F + 0.25M + 0.20C + 0.15P + 0.10L. F represents frailty, M multimorbidity, C carer strain, P prior admission history, and L low service access. Higher scores indicate a transition that may require more intensive support after discharge. The ethical rule is clear: risk scoring exists to direct help, not deny it. A high-risk older adult is not a problem to exclude. The score tells the system where responsibility becomes more urgent.

Service-access time is expressed as SAT = average days from identified need to support start. The indicator is simple but serious. Time is not neutral in later life. Waiting for therapy, home care, equipment, continence advice, medication review, or a safeguarding response can change the person’s functional trajectory. A single average can mislead, so access time has to be stratified by urgency, frailty, living arrangement, carer strain, and risk of deterioration.

This study also proposes an Integrated Gerontological Leadership Index, IGLI = 0.20Q + 0.20K + 0.15A + 0.15R + 0.15W + 0.15E. Q represents quality-of-life review, K known-team continuity, A access timeliness, R readmission-prevention practice, W workforce stability, and E equity and carer evidence. Each component is scored from zero to 100. The index is not a league table. It helps a local board ask whether ageing care is being governed as a connected system rather than as disconnected activity.

Validity is protected by making the logic visible. Each measure has a formula, a reason for inclusion, and an ethical caution. The formulas do not make care mechanical. They give leaders a clearer way to discuss what has often been hidden behind good intentions. The score never outranks the older person’s voice. A manager can use a number to open the right conversation, but the meaning of that number requires professional judgment, family context, and local knowledge.

Limitations remain. Public sources cannot show every local failure or every instance of excellent care. Buurtzorg-derived research cannot prove that self-management will work in every setting. Quality of life cannot be fully captured in a formula. The method remains valuable because it translates a broad human problem into a set of accountable management questions.

Chapter 4: NHS England Case Analysis: Frailty, Recovery, and System Coordination

Table 3. NHS England and Buurtzorg-inspired case comparison

Case lens Main contribution Main caution
NHS England older people’s care Shows value of integrated pathways, short-term support, urgent response, and system coordination. Can become flow-driven if quality of life and carer reality are not measured.
Buurtzorg-inspired support Shows value of relational continuity, small-team knowledge, and professional discretion. Cannot be copied safely without training, governance, supervision, and funding fit.
Combined lesson Older people need coordinated systems and known relationships. One without the other leaves either fragmentation or unsupported discretion.


NHS England’s older people’s care case shows the scale of the coordination problem. An older person’s journey may involve ambulance triage, emergency department assessment, frailty review, acute ward care, pharmacy, therapy, discharge planning, community nursing, adult social care, voluntary support, general practice, and family care. At each handoff, meaning can be lost. A note may say that the person is mobile with assistance, but the home may have stairs and no rails. A record may show that a carer is present, but the carer may be frightened of helping with transfers. A discharge summary may list medicines, while the person still does not know which tablets stopped.

Integrated care in action becomes valuable when it turns these fragments into one recovery path. The NHS England example of short-term intensive support for older people, including nursing, therapeutic assessment, and social care for up to ten days, illustrates a practical response to the gap between acute treatment and daily life. It recognizes that recovery is not a switch. It is a vulnerable period in which strength, confidence, nutrition, medication understanding, and household support all matter.

Frailty changes the meaning of time. A person who spends extra days in hospital may lose muscle strength, sleep poorly, become confused, or become less confident walking. A person discharged home without sufficient help may deteriorate just as quickly through falls, missed meals, medicine confusion, and fear. The NHS England direction toward frailty pathways and proactive care matters because frailty is not simply old age. It is a state of vulnerability in which small stressors can produce large decline. Management has to be earlier, more coordinated, and closer to the person’s ordinary life.

Urgent community response belongs in the case because many crises in later life develop at home before they become hospital admissions. A two-hour response model can make the difference between resolving a fall, infection concern, dehydration, or sudden functional decline at home and sending the person into hospital by default. The value is not only speed. It is the range of competence brought to the door: clinical assessment, therapy judgment, medication awareness, knowledge of social care, and a route for escalation when home is no longer safe.

Virtual wards for older people require the same caution. A virtual ward can provide hospital-level care at home when the person is suitable, the team can monitor and respond, and the household is not left carrying clinical work without preparation. The phrase ‘care at home’ can sound reassuring, but an older person’s home may lack broadband, heating, space, privacy, or a confident carer. In frailty care, suitability has to include cognition, sensory loss, falls risk, carer capacity, housing, and the ability to escalate. Digital monitoring cannot carry recovery alone.

Hospital discharge remains the sharpest test of NHS and social care coordination. CQC’s 2024/25 findings on delayed discharge causes show that community services, social care capacity, rehabilitation, reablement, and recovery services all affect whether a person can leave hospital safely. The public debate often asks why hospital beds are blocked. The better question asks why recovery capacity is not available when the person is ready to leave acute care. A bed is not released by paperwork. It is released by a safe plan that can actually happen.

Reablement deserves particular attention. It is not the same as task care. Task care may wash, dress, feed, and prompt. Reablement asks how the person can regain the ability to do more for themselves with graded support. The difference is ethical and economic. A person who regains enough confidence to walk to the bathroom, make tea, or manage simple personal care has recovered a portion of life. A system that lacks reablement may create dependence while believing it has delivered help.

Medicines safety is another NHS case issue. Older people often leave hospital with changed doses, new medicines, discontinued medicines, or advice that does not fit easily into the old routine. Polypharmacy can produce dizziness, confusion, dehydration, bleeding risk, constipation, falls, and readmission. The pharmacy link between hospital, GP, community pharmacy, carers, and home care staff has to be part of gerontological leadership. A discharge that is clinically complete but pharmacologically confusing remains unsafe.

The local authority interface is equally important. Adult social care assessment, care packages, housing adaptation, safeguarding, carers’ assessments, direct payments, provider capacity, and reablement commissioning all sit close to the older person’s actual life. Integrated care rhetoric has limited value if local authorities are brought into the conversation only when a discharge has already stalled. Joint planning requires shared visibility of care availability, equipment delay, carer risk, and neighbourhood support.

The voluntary and community sector also appears in the NHS England case as more than a decorative partner. Befriending, meals support, transport, falls-prevention classes, dementia groups, faith communities, and local charities can help prevent isolation and loss of confidence. These assets cannot replace statutory care when personal care, clinical assessment, or safeguarding is required. Yet they can make the difference between a person surviving at home and a person living with connection.

NHS England’s case evidence points to a practical leadership standard. Older people’s care works when hospital, community, social care, pharmacy, voluntary support, and family realities are governed together. It fails when each organization completes its own task while the person carries the gaps. The standard is not novelty. It is coordination that can be felt in the person’s day.

Chapter 5: Buurtzorg-Inspired Community Support and Relational Continuity

Figure 4. Case comparison: coordination and relational care. Copyright © June 2026 Juliet C. Nwaiwu / NYCAR. All rights reserved.

Buurtzorg-inspired home care is often admired because it offers a different image of care work: small teams, professional autonomy, fewer layers of bureaucracy, and relationships that are not constantly broken by staff rotation. The attraction is understandable. Much home care in strained systems becomes fragmented into visits measured by minutes, tasks, and contracts. Older people then experience care as a doorbell, a rushed worker, a completed task, and another unknown face next time. Relationship-centred practice asks for something more serious: knowing the person well enough to notice what is changing.

The evidence on Buurtzorg-derived models is careful rather than triumphant. Hegedüs and colleagues show that implementation outside the Netherlands involves adaptation, local constraints, and varied experience. De Bruin and colleagues similarly describe self-managing teams as promising but complex, with outcomes shaped by support, governance, training, and context. The point is not that Buurtzorg solves elderly care. The point is that it exposes a weakness in task-driven systems: care can be technically delivered while remaining relationally thin.

Continuity matters because older people often communicate distress indirectly. A person may say they are fine while eating less, moving more slowly, wearing the same clothes, or avoiding a room after a near fall. A familiar worker may know that this is not normal. A new worker may complete the scheduled task and leave. In dementia care, continuity can reduce anxiety and support recognition. In safeguarding, familiarity may allow disclosure. In medication support, a known worker may notice confusion before an error becomes harm.

Professional discretion is another lesson. Staff who know an older person well may need room to adjust the visit: spending extra minutes when confusion is higher, contacting a nurse when a wound looks wrong, asking about food when the fridge is empty, or noticing carer exhaustion. A system that allows only rigid task completion may look efficient while missing risk. Discretion, however, is not the same as unsupported improvisation. It requires training, documentation, supervision, escalation, and trust.

Small teams can support accountability because responsibility is local and visible. When a team knows its group of older people, the team can plan visits, share observations, and maintain relational memory. The model can reduce the sense that care is delivered by an anonymous workforce. Yet small teams can also become overloaded, isolated, or uneven if the wider system is weak. A self-managing team still requires data support, clinical links, safeguarding advice, workforce cover, and a route to specialist help.

Buurtzorg-inspired practice also changes the meaning of productivity. In a narrow time-and-task model, productivity may be measured by visits completed per hour. In relational care, productivity includes prevention: a fall avoided, an admission prevented, a carer kept from crisis, a medicine error caught, a lonely person reconnected. Those results are harder to count immediately, but they are not less valuable. Leadership has to protect measures that capture prevention rather than reward only visible activity.

Carers are central to this case. A relationship-based team is more likely to notice that the spouse is exhausted, that the daughter is missing work, or that family conflict is affecting care. Carer capacity cannot be assumed because a person is present in the house. Presence is not capacity. A spouse with arthritis may love the person deeply and still be unable to help safely at night. A son may visit daily and still not understand medicines. A care model that names carers as partners has to ask what they can realistically do.

Buurtzorg-inspired models also raise questions about equity. Relationship-based care may be easier to establish in areas with stable staffing, manageable travel times, good digital records, and local professional networks. Places with high deprivation, housing insecurity, rural distance, language barriers, and provider instability may find implementation harder. A serious leadership approach does not abandon the model in those places. It adapts the model while naming the additional investment required.

Technology has a specific place in this discussion. Digital care records, scheduling, remote monitoring, medication prompts, and risk flags can help small teams, especially when they reduce duplication and allow relevant information to travel. Technology becomes harmful when it pushes staff toward screens instead of observation, or when it turns care into data entry without judgment. A Buurtzorg-inspired approach does not reject technology. It asks whether technology protects the relationship or thins it out.

The case carries an important caution for England. Borrowed models can become slogans. A service can call itself person-centred while still rushing workers through short visits. It can announce self-management while leaving teams without the authority or support to act. It can praise continuity while commissioning care through contracts that break continuity every week. The lesson from Buurtzorg-inspired practice is not a brand name. It is the operational discipline of letting relationship, professional judgment, and local knowledge shape care.

When set beside NHS England’s integrated pathways, the Buurtzorg-inspired lens offers balance. System coordination without relationship can feel cold. Relationship without system coordination can become fragile. Older people need both: services that can coordinate risk across organizations, and workers who know enough about the person to see what the dashboard misses. Gerontological leadership is found in that combination.

Chapter 6: Quantitative Model and Scenario-Based Findings

Table 2. Scenario-based measures used in the study

Measure Formula Interpretive use
Quality-of-life score QoL = 0.25I + 0.20S + 0.20C + 0.20H + 0.15F Profiles independence, safety, connection, confidence, and function.
Care-continuity index CCI = known-team visits / total visits × 100 Shows whether the person receives relationally consistent care.
Dependency ratio DR = older population / working-age population × 100 Supports local workforce and service planning.
Readmission-risk score RRS = 0.30F + 0.25M + 0.20C + 0.15P + 0.10L Identifies transitions requiring enhanced support.
Service-access time SAT = average days from identified need to support start Makes waiting visible as a care-quality risk.


Figure 3. Scenario score profile for gerontological care review. Copyright © June 2026 Juliet C. Nwaiwu / NYCAR. All rights reserved.

Measurement in gerontological care requires humility. Numbers can reveal patterns, expose delay, and direct resources. They can also flatten a life if handled carelessly. The aim of this chapter is to use measurement as a way of asking better questions, not as a substitute for human judgment. The model developed here connects quality of life, continuity, access, readmission risk, demographic pressure, workforce stability, and carer evidence into a practical management frame.

Begin with the quality-of-life score. Suppose an older person has the following component scores after assessment: independence 72, safety 84, social connection 60, health confidence 70, and functional ability 68. Using QoL = 0.25I + 0.20S + 0.20C + 0.20H + 0.15F, the result is 0.25(72) + 0.20(84) + 0.20(60) + 0.20(70) + 0.15(68), which equals 71.0. The score is moderate, but the average is less important than the pattern. Safety appears relatively high; social connection is lower. A care review that notices only the total will miss loneliness.

That example shows why component-level interpretation matters. A person may be physically safe but emotionally isolated. Another person may be socially connected but at high falls risk. A person with dementia may have a supportive family but low confidence with unfamiliar workers. Managers need a dashboard that shows the profile, not only the number. Quality of life cannot be raised by one intervention if the limiting factor sits somewhere else.

The care-continuity index is also straightforward. If a person receives 18 visits in a month and 14 are delivered by known team members, CCI = 14 / 18 × 100, which equals 77.8 percent. Whether that is adequate depends on the person’s needs. It may be acceptable for a person requiring simple support and flexible coverage. It may be weak for a person with dementia, anxiety, or safeguarding risk. Continuity is not a sentimental preference. It has clinical and managerial meaning.

Readmission risk requires a wider view of transition. Consider frailty at 80, multimorbidity at 75, carer strain at 70, prior admission history at 60, and low service access at 65. Using RRS = 0.30F + 0.25M + 0.20C + 0.15P + 0.10L, the score is 72.25. A score at that level indicates a transition that requires active follow-up: medicines review, therapy, carer conversation, home safety check, nutrition, and escalation planning. The score does not predict one person’s future with certainty. It identifies a situation in which passive discharge would be reckless.

Service-access time turns waiting into evidence. If five older people wait 3, 5, 6, 8, and 13 days for home support, the average is seven days. The average hides the problem. A thirteen-day wait may be tolerable for a low-urgency social activity referral. It is dangerous after a fall, after discharge with mobility loss, or in a household where a frail spouse is managing alone. Access time has to be read beside risk. Delay is not a number in isolation. Delay is harm moving through time.

The dependency ratio offers a planning view. A locality with 28,000 residents aged 65 and over and 90,000 working-age residents has DR = 28,000 / 90,000 × 100, which equals 31.1 older residents per 100 working-age residents. This does not mean older people are a burden. It means local leaders need to plan for workforce, transport, housing adaptation, community assets, primary care, social care, and family support with population structure in mind. A place with a growing 85-plus population cannot plan services as if age distribution were unchanged.

The Integrated Gerontological Leadership Index brings these ideas together. Imagine a local system scoring quality-of-life review at 74, known-team continuity at 68, access timeliness at 62, readmission-prevention practice at 70, workforce stability at 58, and equity and carer evidence at 65. Using IGLI = 0.20Q + 0.20K + 0.15A + 0.15R + 0.15W + 0.15E, the score is 66.4. The number suggests a system with some working elements but visible weakness in access and workforce stability. The proper response is not a celebratory rating. It is a board-level question: what will change in the next quarter?

Model governance is as important as model design. Every component needs a clear definition. Independence cannot be scored differently by every assessor. Carer strain cannot be a tick box. Continuity cannot mean only that a provider organization is the same; it has to show whether the person sees known workers. Access time cannot be measured from referral acceptance if the person’s need was identified days earlier. Bad definitions produce neat numbers and poor care.

Equity testing is also required. A model may perform well for people who speak English, live with family, and have easy transport while undercounting risk among people living alone, renters, people with dementia, minority ethnic communities, rural residents, and people with sensory loss. Calibration by deprivation, ethnicity, language need, disability, rurality, living arrangement, and carer availability is not statistical decoration. It determines whether the model sees the people most likely to be missed.

The scenario findings support four management conclusions. Quality of life needs component analysis. Continuity requires actual measurement of known-team contact. Readmission risk has to include social and carer variables, not only diagnosis. Access delay has to be stratified by urgency. These conclusions may sound plain, but many systems still rely on narrow activity measures that hide exactly these issues.

The model also protects against a common managerial error: mistaking completed tasks for achieved care. A visit completed is not the same as a person washed with dignity. A discharge completed is not the same as recovery at home. A medication list sent is not the same as medication understood. A referral made is not the same as service received. The indicators in this chapter are useful because they push leaders closer to the lived consequences of their decisions.

Chapter 7: Leadership Practice, Carer Reality, and Dignity-Centred Implementation

The rebuilt Chapter 7 is not a quality-control note. It is the practical heart of the publication: how gerontological leadership can turn evidence, case learning, and measurement into better care. The chapter begins from a point that cannot be captured by policy language alone. Older people do not live inside service categories. They live inside homes, memories, bodies, routines, relationships, fears, and hopes. A leadership model that forgets that fact can be efficient and still inhumane.

Leadership in ageing care has to hold two forms of accountability at once. The service needs public accountability: budgets, waiting times, safeguarding, staffing, infection risk, hospital flow, and performance. The older person needs personal accountability: a worker who arrives, a plan that makes sense, a medicine that can be understood, a route for help, and a sense that the person’s preferences are not being treated as inconvenience. Good leadership refuses to trade one form of accountability against the other.

Carer reality is often where the system tells the truth about itself. Many care plans work only because a spouse, daughter, son, neighbour, or friend absorbs the gap. The document may call the person supported at home, while the real support is a tired family member checking tablets, washing clothes, cooking meals, changing sheets, helping with toileting, and sleeping lightly for fear of a fall. Unpaid care is not a footnote. It is a structural part of older people’s care, and it has to be assessed with honesty.

A carer assessment that asks only whether someone is available is not enough. Availability is not capacity. The right questions are more concrete. Can the carer lift or steady the person safely? Does the carer understand the medicines? Is the carer sleeping? Is paid work affected? Is there backup? Is the carer frightened? Has anyone explained what deterioration looks like? Is the carer consenting to the role or simply being assumed into it? These questions are not intrusive. They are safeguarding questions.

Dignity-centred implementation also requires attention to time. Older people’s services often harm by moving too slowly. Waiting for a commode, a rail, a medication review, a memory clinic, a falls assessment, or a care start can quietly narrow a life. The delay may appear as backlog in management reports; at home, it appears as urine on a chair because the toilet is unreachable, a skipped meal because standing is painful, or fear of bathing because no grab rail has arrived. Time is clinical, social, and moral.

Workforce leadership sits at the same level of importance. Relationship-based care cannot be built on constant staff turnover. Dementia care cannot thrive when workers change unpredictably. Reablement cannot succeed if therapy capacity is too thin. Home care cannot feel dignified when visits are impossibly short. Boards that discuss quality while ignoring workforce stability are discussing an abstraction. Quality arrives through people with skill, time, supervision, and fair treatment.

Professional discretion needs protection. Staff working with older people often see the real problem before the record does: a fridge with little food, bruising that does not match the explanation, a spouse close to collapse, a person who has stopped opening curtains, a house that has become too cold, a medicine bottle untouched. If the service allows only the planned task, that knowledge dies at the door. A mature service gives staff clear routes to raise concern and the authority to adjust care when risk changes.

Yet discretion without governance can also create danger. A worker improvising alone may miss safeguarding duties, clinical escalation, consent rules, or medication risk. The answer is not rigid bureaucracy. It is supported discretion: training, supervision, shared records, clear escalation, professional consultation, and review. Buurtzorg-inspired models are useful here because they value judgment, but the English context also requires careful alignment with regulation, commissioning, and safeguarding.

Housing has to enter implementation. Too many care plans assume the home is a neutral place. It is not. The home may contain stairs, loose rugs, poor lighting, cold rooms, narrow doors, inaccessible bathrooms, unsafe kitchens, mould, or overcrowding. A person may be discharged into a place that undermines the recovery plan from the first evening. Gerontological leadership has to connect health, social care, housing, occupational therapy, energy advice, and local government. Independence is not a personal trait alone; it is partly built by the environment.

Social connection belongs in the same conversation. Loneliness can reduce appetite, movement, motivation, sleep, and confidence. It can make a person less likely to report symptoms or attend appointments. A care system focused only on personal care visits may miss the fact that the person’s life has become smaller than the care plan admits. Faith groups, voluntary organizations, lunch clubs, libraries, befriending schemes, cultural associations, and neighbourhood networks are not clinical substitutes. They are part of the living ecology of ageing.

Digital tools require judgment. Remote monitoring, shared records, falls sensors, video consultations, medication prompts, and predictive risk systems can help. They can also exclude those with poor eyesight, dementia, hearing loss, arthritis, limited English, poverty, or low confidence with devices. Technology has to earn its place by making care safer, clearer, or more timely. It cannot be used to replace human presence where human presence is the intervention.

Implementation at board level needs a disciplined rhythm. A local ageing-care board can review a small number of signals each month: quality-of-life components, continuity, access delays by risk group, readmission-risk profiles, carer strain, workforce stability, reablement starts, dementia continuity, safeguarding themes, and patient/carer stories. A dashboard without stories can become cold. Stories without data can miss patterns. The board needs both.

Commissioning also has to change. Contracts that reward short visits and low price while ignoring continuity, travel time, carer support, and reablement outcomes cannot deliver relational care. Commissioners need evidence about what happens after the visit: whether function improves, whether the same workers are seen, whether carers remain stable, whether falls reduce, whether hospital returns are avoidable, and whether the person reports confidence. Cheap care that creates crisis elsewhere is not cheap.

Leadership development for gerontological care requires a different curriculum from generic management training. Leaders need to understand frailty, dementia, polypharmacy, safeguarding, falls, loneliness, housing, carer strain, workforce morale, and the politics of adult social care. They also need enough quantitative literacy to question dashboards and enough human literacy to hear what older people and carers are saying beneath polite answers. This is not a soft field. It is one of the hardest areas of public management because the consequences of weak leadership are intimate.

The chapter’s operating position is simple. Quality of life in later life improves when services are timely, relational, clinically aware, carer-conscious, and accountable. It declines when care becomes rushed, fragmented, defensive, or blind to the home. A gerontological leader is not judged by the elegance of a strategy. The leader is judged by whether the person at home experiences care as safe, known, and workable.

Chapter 8: Applied Care Scenarios: Dementia, Falls, Medicines, Housing, and Loneliness

Dementia care shows why gerontological leadership cannot rely on standard visit completion. A person living with dementia may not describe pain clearly, may resist help because the worker is unfamiliar, may lose confidence after a hospital stay, or may become distressed when routines change. A care plan that is clinically sensible on paper can fail if the person does not recognize the worker at the door or if instructions arrive in a form the person cannot retain. Dementia-sensitive leadership gives weight to routine, familiarity, calm communication, and the involvement of people who know the person’s ordinary behaviour.

Continuity is especially important in dementia because change may appear as a small deviation from baseline. A known worker may notice that a person who normally chats has become withdrawn, that food has gone uneaten, or that a room is being avoided. These observations can precede formal deterioration. In fragmented care, such signals may be missed until crisis occurs. The care-continuity index therefore has practical value; it gives leaders a way to protect familiar staffing for people whose safety depends on being known.

Falls are another test of leadership. A fall is rarely a random event in the life of a frail older person. It may reflect poor lighting, medication side effects, weak muscles, unsafe footwear, dehydration, urgency to reach the toilet, poor vision, clutter, or fear that has already changed walking patterns. A fall-prevention service that begins only after repeated incidents is late. Gerontological leadership treats falls as a system signal, bringing pharmacy, therapy, housing, vision, continence, nutrition, and carer advice into one plan.

The home environment turns falls prevention from a clinical topic into a practical one. A therapist may recommend exercises, but the person still has to cross a dark hallway at night. A medicine review may reduce dizziness, but the bathroom may remain unsafe. A falls pathway that cannot secure rails, lighting, footwear advice, and confidence-building support will be incomplete. This is where health care, social care, housing, and local government have to meet. The older person experiences their separation as risk.

Medication safety is equally central. Older people often live with polypharmacy, and hospital admission can change a familiar pattern. A medicine stopped on the ward may still be in the kitchen drawer. A new dose may be written correctly but misunderstood. A blister pack may not match the discharge summary. A carer may administer medicine without knowing why it changed. Medicines reconciliation is not a clerical task. It is one of the most practical safeguards in hospital-to-home care.

Pharmacists, GPs, community nurses, home care staff, hospital teams, older people, and carers all hold part of the medicine story. Leadership is needed because no one part sees the whole. A medication incident after discharge can be described as patient error, but often it reveals poor communication, unclear packaging, missing review, or a plan that assumed too much. The readmission-risk score needs a medication layer when local data allow it, especially for people with high-risk medicines, cognitive impairment, or recent dose changes.

Housing conditions may be the hidden determinant of independence. A person can be medically stable and still be unable to live safely where they are. Stairs may block access to the bedroom. A bathroom may require movements the person can no longer manage. Cold homes can worsen respiratory illness. Damp can affect health. Insecure tenancy can create anxiety and prevent adaptation. A housing-blind care plan is often a temporary illusion. It may keep the person home for a few days while the underlying hazard remains.

Older renters and people in poor housing deserve particular attention. Home ownership is often assumed in ageing policy, yet many older people live in rented, insecure, or unsuitable accommodation. Adaptation may be delayed by landlord consent, funding rules, or service fragmentation. A dignity-centred model treats housing adaptation, warmth, safety, and accessibility as part of care leadership, not as separate environmental background.

Loneliness can be harder to see than falls or medicines error, but its effect on daily life can be severe. An older person who sees no one may eat less, move less, speak less, and delay asking for help. Loneliness can also intensify anxiety after discharge. A person may technically receive care but still feel abandoned for most of the day. Social connection in the quality-of-life score is included because care cannot be reduced to bodily maintenance.

Community assets are valuable only when connected properly. A local church, mosque, lunch club, dementia café, walking group, volunteer driver scheme, or befriending project can help rebuild confidence. Yet referrals have to be realistic. Some older people need transport, reassurance, language support, or someone to go with them the first time. Handing someone a leaflet is not social prescribing. Leadership asks whether the connection happened.

Nutrition also belongs in applied gerontological care. Poor appetite, bereavement, dental problems, swallowing difficulty, poverty, and inability to shop can all weaken recovery. A fridge check may tell a story that a clinic note misses. Food is not only calories; it is routine, pleasure, culture, and independence. A care worker who has time to notice uneaten meals may prevent deterioration long before a hospital readmission occurs.

Safeguarding runs through all these scenarios. Dementia, frailty, dependency, poverty, and isolation can increase vulnerability to neglect, abuse, exploitation, and coercive control. Safeguarding is not a separate file opened only after a dramatic concern. It is a way of seeing risk in ordinary interactions. Known staff, careful records, respectful questioning, and clear escalation routes all matter. A service that rotates strangers through short visits may reduce its ability to hear what is really happening.

The scenarios show why the model in this paper remains deliberately broad. Quality of life cannot be separated from dementia care, falls prevention, medicines, housing, food, carers, and loneliness. Each issue can produce crisis on its own; together they shape whether later life feels manageable. Gerontological care leadership is the work of keeping those issues connected long enough for care to become real.

Chapter 9: Board Assurance, Commissioning, and Local Implementation

Table 4. Implementation assurance questions

Area Question for leaders Evidence required
Discharge Has the first week at home been made safe? Care start, medicine plan, equipment, escalation route, carer contact.
Reablement Is recovery support available early enough? Start date, goals, therapist input, functional change.
Continuity Do high-need older people see known workers? Known-team visit rate and exceptions.
Carers Is unpaid support sustainable? Carer assessment, strain review, backup plan.
Equity Who is being missed? Outcomes by deprivation, rurality, ethnicity, language need, disability, and living arrangement.


Figure 5. Implementation cycle for ageing-care leadership. Copyright © June 2026 Juliet C. Nwaiwu / NYCAR. All rights reserved.

A local board responsible for older people’s care needs a different kind of assurance from the one used for simple activity reporting. It needs to know whether the system is protecting people during the points where harm usually enters: discharge, first days at home, medication change, care-start delay, carer overload, falls risk, dementia-related distress, and delayed reablement. A board pack that reports only contacts, visits, and waiting lists will not show whether older people are living safely.

Board assurance begins with a small number of disciplined questions. Are frail older people receiving timely assessment? Are high-risk discharges followed up within the agreed window? Are medication changes reviewed? Are carers being assessed where care plans depend on them? Are people with dementia receiving continuity? Are reablement starts delayed? Are access delays worse in rural areas or deprived neighbourhoods? Are readmissions linked to known service gaps? These questions turn leadership from presentation into accountability.

Commissioning has to carry the same seriousness. Contracts shape care. A contract that pays for short task visits will produce short task visits. A contract that ignores travel time will punish continuity in spread-out areas. A contract that tracks only visit completion will not capture whether the person regained confidence. Commissioners need to build continuity, reablement outcomes, carer involvement, safeguarding responsiveness, and equity into the way services are purchased and reviewed.

Provider stability is also a commissioning issue. Older people suffer when care markets are fragile. A provider collapse, sudden staffing loss, or rota failure can throw a household into immediate risk. Local authorities and integrated care systems need early warning about provider stress, workforce turnover, quality deterioration, and financial fragility. Market oversight may sound distant, but older people experience it when a familiar worker disappears or a care package cannot start.

Data sharing requires careful governance. Health and social care teams need enough information to coordinate care, but older people retain rights over privacy and dignity. Shared records can reduce repeated questioning, missed medication details, and duplicated assessments. They can also expose sensitive information if poorly controlled. A lawful, proportionate data-sharing model is part of gerontological leadership because safe care often depends on information travelling with the person.

Local implementation can begin with one pathway rather than an entire system redesign. A place may select older adults discharged after a fall, people living with moderate or severe frailty, or people referred to urgent community response. The local team can define variables, collect data, test the quality-of-life profile, measure continuity, review carer strain, and track access time. Starting small allows leaders to see where the record fails before scaling the model.

Patient and carer involvement has to be built into implementation from the beginning. A metric designed without older people may miss what they value. Some may prioritize staying home; others may prioritize pain control, bathing safely, seeing family, or not being a burden. Carers may identify gaps that staff cannot see, such as night-time fear, confusion around medicines, or the emotional cost of repeated calls. Co-design is not ceremony. It is a way of finding the real problem.

Workforce involvement is equally important. Frontline staff know where the pathway breaks. They know when travel time is unrealistic, when documentation duplicates, when equipment delays are routine, when hospital discharge information is poor, and when care packages assume impossible work. A leadership model that ignores staff knowledge will design neat processes that fail at the doorstep. Staff need not only instructions but a voice in improving the system.

Financial stewardship also belongs in the model. Dignity-centred care costs money, but poor care carries its own costs: hospital readmission, longer-term dependency, carer breakdown, safeguarding investigation, emergency placement, ambulance use, and loss of trust. Reablement, continuity, and early support may look expensive when viewed in one budget line and economical when viewed across the whole pathway. Integrated care finance has to follow the person rather than defend organizational silos.

Equity assurance requires disaggregated data. Older people in deprived neighbourhoods may face worse housing, fewer informal resources, lower digital access, and more difficulty securing transport. Minority ethnic older people may face language barriers, culturally inappropriate care, or lower trust in services. Rural older people may face distance, thin provider markets, and poor public transport. A single average can hide all of this. Board assurance needs to ask where the model works least well.

Digital transformation requires a similar equity test. A remote monitoring service that assumes a smartphone, broadband, English literacy, good vision, and family support will miss many older people. Digital records may help professionals, but digital self-management may fail for those with cognitive impairment or poverty. Technology can support ageing care when it reduces delay, improves information flow, and protects safety. It becomes unjust when it shifts work onto people least able to carry it.

Implementation also needs a learning rhythm. Every month, the team can review cases where the pathway worked and cases where it failed. The review can ask what was known, who knew it, what action followed, and what blocked improvement. A fall after discharge, a carer crisis, or a medication incident is not only an event. It is evidence. The best local systems turn such evidence into changed practice.

External accountability can reinforce local learning. CQC inspection, public reporting, health scrutiny committees, patient participation groups, and voluntary organizations all create pressure to make care visible. Yet accountability becomes useful only when it looks beyond headline activity. Regulators and local leaders need to ask about continuity, dignity, reablement, carer strain, and lived outcomes. Older people’s care cannot be assessed properly by counting the wrong things accurately.

Board assurance is finally a moral practice. A board that has seen evidence of delayed care, carer strain, poor continuity, or avoidable readmission cannot treat those findings as neutral data. Each point represents someone’s mother, father, neighbour, friend, or future self. The work of leadership is to connect numbers with responsibility before the next crisis makes the connection unavoidable.

Chapter 10: Recommendations and Final Position

The recommendations in this publication follow from the evidence rather than from aspiration. Local systems can begin by making quality of life a formal outcome in older people’s care. This means recording more than activity. Independence, safety, social connection, health confidence, and functional ability need a place in review conversations. A measure does not need to be complicated to be useful. It needs to be understood, repeated, and acted on.

Integrated care systems can create a gerontological care dashboard that combines quality-of-life profiles, care continuity, access time, readmission risk, reablement starts, carer strain, and workforce stability. The dashboard has value only when it changes decisions. If the data show poor continuity for people living with dementia, commissioning and rota design have to respond. If access delays cluster in one locality, the board has to ask why. If carer strain predicts readmission, the response cannot be another leaflet.

Every older person discharged from hospital with functional, cognitive, medication, or social risk requires a named transition owner. Responsibility cannot dissolve across teams. The transition owner does not personally deliver every service; the role is to ensure that medicine changes, equipment, care start, reablement, carer contact, and escalation routes are confirmed. Discharge becomes safer when the system knows who is watching the first days at home.

Reablement and rehabilitation need protection as recovery infrastructure. They are often treated as optional when budgets tighten, yet they can decide whether a person regains independence or enters long-term dependence. Local systems can track days from discharge to reablement start, proportion of eligible older people receiving reablement, functional gains, carer impact, and readmission patterns. The value of reablement is not only bed flow. It is restored life.

Continuity deserves explicit commissioning. Home care contracts can include known-team targets for older people with dementia, high anxiety, safeguarding concern, or complex medication. Scheduling systems can protect relational continuity rather than disrupt it for administrative convenience. Provider performance can include continuity data alongside punctuality and visit completion. A familiar face is not a luxury in gerontological care.

Carer support has to move from informal gratitude to formal governance. Carer capacity, confidence, health, sleep, work pressure, and backup need review where a care plan depends on unpaid labour. Local systems can track carer assessments, emergency respite access, training offered, and carer-reported strain. The ethical point is direct: a service that depends on carers owes them evidence-based support.

Housing and adaptation pathways need tighter connection with health and care. Falls prevention, rails, lighting, heating, accessible bathrooms, clutter reduction, and equipment delivery can determine whether the person stays safe. Delays in housing adaptation belong on the same risk map as care delays. Occupational therapy and housing officers need earlier involvement where the home environment is part of the risk.

Virtual wards and remote monitoring for older people need suitability rules that include cognition, sensory function, home safety, carer capacity, digital access, and face-to-face response availability. A remote model that works for one household may be unsafe for another. Local evaluation needs to include escalation calls, failed readings, transfer back to hospital, patient confidence, carer strain, and equity by deprivation, language need, rurality, and disability.

Workforce stability is not an administrative concern. It is a care-quality determinant. Local systems can monitor vacancy rates, turnover, agency use, sickness, training, supervision, travel time, and visit length. Relationship-based care will remain language if workers are constantly leaving or if visits are too compressed for dignity. Investment in workforce is investment in quality of life.

Professional training needs to be grounded in real ageing-care situations. Staff need scenarios on delirium, dementia distress, hidden carer strain, medicines confusion, falls fear, malnutrition, safeguarding, loneliness, and culturally sensitive support. Training becomes useful when it helps staff recognize risk earlier and communicate with older people and carers without patronizing them.

Post-incident learning can be adapted from patient-safety practice. When an older person is readmitted, falls after discharge, experiences a medicine incident, or reaches carer crisis, the review can ask what warning signs existed. Did the care plan assume too much? Was the first visit late? Were medicines understood? Was continuity weak? Was housing risk known? The goal is not blame. The goal is to identify the place where the system could have acted sooner.

Research can develop this publication further through local empirical evaluation. Future studies could estimate the relationship between continuity and readmission, reablement timing and functional recovery, carer strain and emergency calls, or housing adaptation delay and falls. Mixed-methods research with older people and carers would add depth to the scenario model. The present paper gives a framework; local evaluation would test and refine it.

The final position is that gerontological care leadership requires more than compassion. Compassion without organization becomes fragile. Organization without compassion becomes cold. Older people need systems that are both humane and capable: services that arrive on time, know the person, understand risk, include carers, protect dignity, and learn from failure. Ageing care is one of the clearest tests of whether public service can remain personal at scale.

A society that lives longer has not solved ageing; it has created a responsibility. The responsibility is to make later life livable where possible, protected where necessary, and respected always. Juliet C. Nwaiwu’s study contributes to that responsibility by giving managers a practical language for connecting quality of life, continuity, access, and leadership. The measure of success is not whether the system sounds integrated. The measure is whether older people feel the difference in ordinary life.

One more point belongs in the final position: older people’s care requires memory. Services often reorganize, rename pathways, replace teams, and redraw accountability maps. The older person and carer may then meet the same problem under a new label. Institutional memory protects against that churn. Local systems can preserve what was learned from serious incidents, delayed discharges, failed care starts, provider collapse, missed dementia distress, and carer crisis. A service that cannot remember its own failures will repeat them politely.

Research and practice also need better language. Terms such as independence, choice, care at home, and integrated care sound positive, but each can hide pressure. Independence can become abandonment when support is absent. Choice can become a burden when only poor options are available. Care at home can become unpaid family labour when the formal service is thin. Integrated care can become a meeting structure that never reaches the person. Gerontological leadership has to test its words against lived experience.

Ageing care also has an intergenerational meaning. Younger people are not outside the issue; they are future older people, current carers, workers in the care economy, taxpayers, daughters, sons, neighbours, and colleagues. A society that underfunds, undervalues, or fragments older people’s care is not saving itself from cost. It is transferring cost into hospitals, families, low-paid work, and private distress. Sound leadership brings those hidden costs back into view.

Juliet C. Nwaiwu’s publication is positioned as a master’s-level contribution because it offers an applied, evidence-grounded framework rather than an abstract theory of ageing. Its value lies in the practical combination of NHS England pathways, Buurtzorg-inspired relational care, quality-of-life measurement, continuity tracking, carer recognition, and board-level accountability. The framework can be adapted by local systems, care providers, graduate researchers, and policy-facing managers who want ageing care to be measurable without becoming mechanical.

The lasting claim is deliberately plain. Older people do not ask systems to be perfect. They ask, often quietly, that help arrives when promised, that workers listen, that medicines make sense, that carers are not left alone, that home is made safer, that recovery is possible, and that frailty does not erase personhood. A care system that meets those tests has done something more difficult than producing a strategy. It has made public responsibility visible in private life.

The model also gives NYCAR a defensible publication standard for applied care leadership: the mathematics is transparent, the evidence boundary is visible, and the argument remains close to the person whose life is affected by each decision. That combination is what separates a useful master’s research publication from a broad essay on ageing.

Used carefully, the framework can help local leaders resist two failures at once: the sentimental failure that speaks warmly about older people without changing services, and the technical failure that measures services while forgetting the person. NYCAR’s standard sits between those errors. It expects evidence, but it also expects evidence to serve dignity.

Appendix A: Measurement Assurance and Local Data Rules

Local use of the model requires rules that are more precise than the language of the publication. A quality-of-life score is only useful when assessors understand the components in the same way. Independence, for example, cannot be reduced to whether the person can perform one activity. It may include washing, dressing, toileting, cooking, moving around the home, leaving the house, managing small decisions, and expressing preferences. Local systems can define independence through a short set of observable domains and then allow the older person to identify which domain matters most to them.

Safety also requires definition. A safe home is not only a home without obvious hazards. Safety includes falls risk, medication clarity, nutrition, heating, infection risk, safeguarding, cognitive safety, equipment availability, and whether help can be summoned in time. A person may be safe at noon when a worker is present and unsafe at night when the toilet is far away and pain is worse. Local assessment needs to consider the full day, not only the professional visit.

Social connection is often under-measured because it looks less urgent than medication or mobility. Yet social disconnection can affect nutrition, mood, motivation, adherence, and help-seeking. A local tool can ask whether the person has meaningful contact, whether that contact is wanted, whether transport or fear prevents participation, and whether bereavement has changed the person’s routine. Counting contacts alone may be misleading; a person can have many brief professional visits and still be deeply lonely.

Health confidence needs careful wording. It does not mean the person understands every medical detail. It means the person has enough practical understanding to know what is happening, what to do next, whom to contact, and what signs require help. A person leaving hospital with new medicines and a complicated follow-up plan may have low health confidence even when the plan is clinically correct. Plain-language communication becomes part of the intervention.

Functional ability can be assessed through mobility, transfers, personal care, continence, meal preparation, and ability to participate in ordinary routines. Functional ability is not static. It may improve with reablement or decline quickly after bed rest, infection, pain, or fear of falling. Local data systems can record change rather than only a single score. A score that moves from 48 to 60 may represent a real gain in the person’s life, even when the person remains far from full independence.

Carer strain requires its own measurement. Local systems can use a short scale that records sleep disruption, physical tasks, emotional stress, work impact, confidence, availability of backup, and willingness to continue. The measurement needs to be repeated because carer strain changes. A spouse may cope during the first week after discharge and become exhausted in the third. A daughter may appear available until employment pressure makes the role unsustainable. Static carer data can create false assurance.

Known-team continuity also needs local rules. A visit by the same provider is not always a known-team visit. The older person may see different workers employed by the same agency. For this model, a known-team visit means the worker is known to the person or belongs to a small team familiar with the person’s care plan, risks, preferences, and communication needs. The definition has to be practical enough for providers to record and meaningful enough for older people to recognize.

Access time is measured from the point at which need is identified, not from the point at which a service accepts referral. If an older person waits three days before referral and five days after referral, the lived access time is eight days. Systems often measure the part of the delay they own. The person experiences the whole delay. Measurement has to follow the person rather than protect organizations from uncomfortable data.

Readmission-risk scoring needs clinical oversight. Frailty scores, multimorbidity, carer strain, prior admissions, and service access all contribute to risk, but the model can be strengthened with local variables such as medication burden, delirium history, falls, continence, nutrition, housing risk, cognitive impairment, and palliative status. The model cannot be expanded endlessly. Too many variables can make it harder to use. Local teams need a compact score that still sees the major hazards.

Data quality can be checked through audit. A monthly sample of records can test whether frailty was scored consistently, whether carer strain was documented where relevant, whether access time was measured from the correct point, and whether known-team continuity was recorded accurately. Audit cannot become punitive paperwork. It reveals whether the system knows enough to govern care.

Missing data function as information. If no carer assessment appears for a person whose plan depends on family support, the absence is not neutral. If housing risk is blank, leaders cannot assume the home is safe. If social connection is unrecorded, loneliness has not disappeared. A useful dashboard can include a missing-data rate because what the system fails to record may expose what it fails to value.

Local implementation also requires consent and privacy safeguards. Older people need to understand how information about their care, home, risks, and family support will be used. Some data are sensitive: dementia diagnosis, safeguarding concerns, family conflict, financial hardship, housing condition, and carer capacity. Data sharing has to be lawful, proportionate, secure, and explained. Better coordination cannot be purchased by careless privacy practice.

The model belongs in review with older people and carers before live use. They can identify words that feel patronizing, questions that miss the point, and scores that fail to capture what matters. A person may say that the measure asks about walking but not about fear of leaving the house. A carer may say that the form asks about tasks but not about emotional strain. These comments improve the model because they return it to lived reality.

Staff training is part of measurement assurance. A worker asked to score social connection or carer strain needs more than a form. They need examples, prompts, supervision, and a safe way to discuss uncertainty. Training can use realistic scenarios: a person who says they are fine but has lost weight, a carer who jokes about exhaustion, a person with dementia who refuses a new worker, or a home that is tidy but unsafe at night. The goal is thoughtful consistency, not mechanical scoring.

Thresholds are set locally and revised after evidence accumulates. A readmission-risk score above a given level might trigger a follow-up call within twenty-four hours, pharmacist review, reablement discussion, or carer contact. A low continuity score for a person with dementia might trigger rota review. A high access delay for urgent support might trigger escalation to the integrated care board. The threshold matters only if action follows.

Outcome review compares prediction with reality. If a person scored low risk and was readmitted, the case can be reviewed to identify what the model missed. If a person scored high risk and recovered well, the review can ask which support worked. This learning loop prevents the model from becoming fixed doctrine. Good local governance treats every mismatch as an opportunity to improve judgment.

The appendix also clarifies the publication’s mathematical restraint. The formulas are simple because the purpose is practical use in health and social care management. A more complex model may be suitable for statistical research, but a local service needs indicators that frontline staff, managers, board members, older people, and carers can understand. Clarity is an ethical requirement when measures influence care.

No score in this model has authority over dignity. A person’s stated priorities, cultural values, family context, and right to refuse support remain central. Measurement helps the system see risk and plan care. It does not erase autonomy. The best use of data in gerontological leadership is to make support more timely, more personal, and more accountable.

References

Age UK. (2024). The state of health and care of older people in England 2024. Age UK.

Age UK. (2025). The state of health and care of older people in England 2025. Age UK.

Allan, S., Roland, D., Malisauskaite, G., Jones, K., Forder, J., & Wittenberg, R. (2021). The influence of home care supply on delayed discharges from hospital in England. BMC Health Services Research, 21, Article 1297. https://doi.org/10.1186/s12913-021-07341-7

Care Quality Commission. (2025). The state of health care and adult social care in England 2024/25. Care Quality Commission.

Centre for Ageing Better. (2025). The state of ageing 2025. Centre for Ageing Better.

Dambha-Miller, H., Simpson, G., Hobson, L., Chapman, J. L., & Damery, S. (2021). Integrated primary care and social services for older adults with multimorbidity in England: A scoping review. BMC Geriatrics, 21, Article 674. https://doi.org/10.1186/s12877-021-02618-8

de Bruin, J. H., Doodkorte, R. J. P., Sinervo, T., & Clemens, T. (2022). The implementation and outcomes of self-managing teams in elderly care: A scoping review. Journal of Nursing Management, 30(8), 4549–4559. https://doi.org/10.1111/jonm.13836

Department of Health and Social Care. (2025). Adult social care in England, monthly statistics: January 2025. Department of Health and Social Care.

Hegedüs, A., Schürch, A., & Bischofberger, I. (2022). Implementing Buurtzorg-derived models in the home care setting: A scoping review. International Journal of Nursing Studies Advances, 4, Article 100061. https://doi.org/10.1016/j.ijnsa.2022.100061

National Institute for Health and Care Excellence. (2023). Integrated health and social care for people experiencing homelessness. NICE.

NHS England. (2023). Proactive care: Providing care and support for people living at home with moderate or severe frailty. NHS England.

NHS England. (2024). Integrated care in action: Older people’s care. NHS England.

NHS England. (2025). Best practice guide for NHS frailty pathways. NHS England.

NHS England. (2025). Urgent and emergency care plan 2025/26. NHS England.

Norman, G., Bennett, P., Vardy, E. R. L. C., Clarke, A., & others. (2023). Virtual wards: A rapid evidence synthesis and implications for the care of older people. Age and Ageing, 52(1), afac319. https://doi.org/10.1093/ageing/afac319

Office for National Statistics. (2023). Profile of the older population living in England and Wales in 2021 and changes since 2011. Office for National Statistics.

Office for National Statistics. (2025). Estimates of the very old, including centenarians, UK: 2002 to 2024. Office for National Statistics.

Skills for Care. (2025). The state of the adult social care sector and workforce in England. Skills for Care.

World Health Organization. (2015). World report on ageing and health. World Health Organization.

World Health Organization. (2021). Decade of healthy ageing: Baseline report. World Health Organization.

World Health Organization. (2024). Integrated care for older people: Guidance and implementation resources. World Health Organization.

The Thinkers’ Review

William I. Njemanze

Molecular Pathology, Precision Oncology, and Diagnostic Governance

NEW YORK CENTER FOR ADVANCED RESEARCH (NYCAR)

A Foundation Medicine Comprehensive Genomic Profiling Case Study

Master’s Research Publication

Research Publication by William I. Njemanze

Publication No.: https://doi.org/10.5281/zenodo.20448679

DOI: NYCAR-TTR-2026-RP024

June 2026


Peer Review and Publication Statement: Approved for NYCAR’s June 2026 publication release following review for applied healthcare scholarship, source discipline, APA 7th presentation, oncology-management relevance, diagnostic-governance clarity, model transparency, and professional readability. The main body is complete as submitted and requires no appendix material.


Abstract

Comprehensive genomic profiling has become part of advanced cancer care, but its clinical value is decided in a practical and often unforgiving sequence. The test has to be ordered early enough. The tissue has to be adequate. The report has to return before the treatment decision has already moved on. A molecular finding then has to be read correctly, paid for where coverage is required, explained to the patient, and connected to a therapy, trial, resistance interpretation, or a defensible decision to stay with standard care. When that sequence breaks, the science may still be sound while the patient gains little from it.

This paper uses Foundation Medicine’s FoundationOne CDx as a case study in comprehensive genomic profiling. The test is not examined as an endorsement, nor as a claim that one commercial platform defines precision oncology. Its public record is useful because it brings several live issues into one place: broad next-generation sequencing, companion-diagnostic use, tumor-signature reporting, variant interpretation, clinical report language, reimbursement, and the growing dependence of oncology teams on molecular evidence that must be translated under time pressure.

The evidence base includes FDA and CMS records, Foundation Medicine public documentation, ASCO and ESMO guidance, validation literature, and recent work on molecular tumor boards and implementation. The study follows the service pathway around the test: tissue handling, timing of the order, turnaround, variant review, molecular tumor board access, payer follow-through, clinical-trial referral, data stewardship, patient explanation, and equity across treatment settings. A weighted governance model is used to examine that pathway. It is not used to rank a company, validate a product, or predict survival.

The conclusion is practical. Genomic profiling improves advanced cancer care only when molecular evidence is tied to accountable clinical action. Late ordering, inadequate tissue, weak interpretation, delayed access work, unrealistic trial referral, and poor patient communication can turn a sophisticated laboratory result into information that arrives without force. Precision oncology therefore depends as much on governance, timing, and explanation as it does on sequencing.

Keywords: molecular pathology; precision oncology; Foundation Medicine; FoundationOne CDx; comprehensive genomic profiling; companion diagnostics; molecular tumor board; diagnostic governance.

Contents

List of Tables and Figures

Table 1. Comprehensive genomic profiling management chain.

Table 2. Precision oncology governance variables and weights.

Table 3. Implementation priorities for comprehensive genomic profiling.

Figure 1. FoundationOne CDx genomic scope.

Figure 2. Precision oncology governance pathway.

Figure 3. CGP governance score profile.

Figure 4. Weighted precision oncology governance model.

Figure 5. Access bottlenecks in comprehensive genomic profiling.

Figure 6. Molecular tumor board decision ecology.


Chapter 1: Introduction and Research Problem

Table 1. Comprehensive genomic profiling management chain

Stage Management responsibility Risk if weak
Test ordering Select suitable patient, timing, and specimen. Testing occurs too late or without clinical purpose.
Laboratory processing Protect tissue adequacy, tumor content, and analytical quality. Result is delayed, failed, or incomplete.
Report interpretation Connect variants with cancer context and treatment options. Finding is misunderstood or ignored.
Molecular tumor board Coordinate cross-specialist decision making. Precision oncology becomes fragmented.
Access follow-through Resolve coverage, trial referral, and patient communication. Report fails to change care.

Note. Original table prepared for NYCAR publication use. Copyright © June 2026 William I. Njemanze.

1.1 Cancer care after the single-marker era

Molecular pathology has moved oncology beyond the narrow habit of testing one alteration at a time after a treatment decision has already been made. Advanced tumors often contain several clinically relevant signals: driver alterations, resistance mechanisms, tumor mutational burden, microsatellite instability, copy number changes, and fusion events. Each signal may matter differently depending on tumor type, treatment history, specimen condition, and the patient’s remaining options. Comprehensive genomic profiling entered that environment not as an academic luxury, but as a response to a clinical workflow that had become too complex for scattered testing to manage well.

Foundation Medicine is a useful case because its products sit at the crossing point between laboratory science, oncology practice, regulatory approval, payer policy, and data interpretation. FoundationOne CDx does not simply produce a list of variants. It organizes molecular evidence into a report that clinicians must interpret against approved therapies, possible resistance, tumor-agnostic indications, and clinical trial opportunities. Any serious review has to examine the system around that report. A genomic result can be technically accurate and still fail the patient if tissue arrives late, if the result is not read by the right team, or if access work begins after treatment choices have narrowed.

Precision oncology often sounds elegant in conference language. Clinic work is less tidy. A patient may have progressive disease, limited tissue, declining performance status, insurance uncertainty, and a narrow window for next-line therapy. In that setting, genomic testing is not a ceremonial marker of modern care. It is useful only if it reaches the treating oncologist early enough to change a decision. Timing, specimen adequacy, interpretation, and payer follow-through become clinical management issues, not administrative side notes.

This study treats comprehensive genomic profiling as a diagnostic service rather than as a laboratory product alone. That distinction matters. Products can be purchased, ordered, and reported. Services require pathways, training, records, escalation rules, and accountability. Cancer centers that miss this distinction may celebrate access to advanced testing while leaving clinicians and patients to manage the difficult parts informally. NYCAR’s applied scholarship standard requires attention to that difference because public-facing research must be useful to decision makers, not only correct in terminology.

1.2 Research problem

Genomic testing has expanded faster than many clinical systems have matured. FDA-approved companion diagnostics, tumor-agnostic therapies, liquid biopsy options, and large-panel sequencing have widened what can be known about a tumor. Healthcare organizations, however, still face older problems: incomplete referrals, late orders, poor documentation, inequitable coverage, limited tumor board capacity, and uneven patient explanation. Those problems do not disappear because the test is sophisticated. They become more consequential because the information is more complex and often more time-sensitive.

Several management failures are especially damaging. Ordering may occur after multiple treatment lines have already failed. Pathology may not be consulted early enough to preserve tissue. Reports may be filed without structured review. Clinicians may see variants of uncertain significance without sufficient support. Payers may require documentation that delays action. Trial matching may remain theoretical because no one owns the referral. Data governance may be treated as an IT matter rather than a patient trust issue. Each weakness is familiar on its own; together they explain why molecular medicine can remain uneven despite technical progress.

Research on comprehensive genomic profiling frequently emphasizes analytic validity, actionability, or trial outcomes. Those topics are necessary, but they do not fully answer the management question. A health system also needs to know how genomic evidence travels through ordinary care. Who orders the test? Who checks tissue adequacy? Who explains the difference between an approved therapy and a possible trial? Who records why a result did not lead to treatment? Who notices whether uninsured, rural, older, or minority patients are tested later or less often? Without these questions, precision oncology remains professionally incomplete.

Central concern in this paper is therefore operational. Foundation Medicine’s case is used to ask how a molecular pathology service becomes dependable inside advanced cancer care. The point is not to promote one vendor or to imply that a single platform solves oncology. FoundationOne CDx offers a concrete case because it has public regulatory documentation, validation literature, and a visible role in companion diagnostics. That evidence allows the study to move beyond general praise and examine the working conditions required for responsible adoption.

1.3 Argument and contribution

Clinical value in comprehensive genomic profiling depends on four conditions. Ordering must be early enough to matter. Specimen handling must preserve the ability to generate a reliable result. Interpretation must connect molecular evidence with tumor context and therapeutic reality. Access work must move quickly enough to convert a possible option into care. Failure at any one point can weaken the whole chain. A report is not care until it has been interpreted, communicated, and acted on.

Foundation Medicine’s public profile is important, but the broader contribution of this paper lies in diagnostic governance. Governance is used here in a practical sense: who is responsible, what evidence is required, which deadlines matter, how decisions are documented, how fairness is assessed, and how the institution learns when a pathway breaks down. Molecular pathology brings a scientific foundation; governance determines whether that science reaches the patient in usable form.

Quantitative reasoning is used sparingly. A weighted governance model summarizes timing, specimen quality, interpretation, actionability, tumor board function, and equity. The score is not an estimate of patient survival, test accuracy, or company performance. It is a diagnostic management tool. Its value lies in making assumptions visible and forcing leaders to examine weak points before they become routine. A model of this kind belongs in applied healthcare management because it helps decision makers examine complex services without pretending that a single number settles clinical judgment.

Professional contribution also includes restraint. Genomic profiling can identify actionable findings, resistance information, and trial opportunities, but it cannot guarantee that a patient will receive a matched therapy. Biology, performance status, coverage, geography, trial eligibility, and patient preference still matter. Mature precision oncology respects that reality. It does not sell certainty; it builds a better pathway for uncertain but consequential decisions.

1.4 Research design and evidence discipline

Methodologically, the paper uses a qualitative-dominant case-study design supported by focused quantitative reasoning. That design fits the subject because comprehensive genomic profiling is not one event. It is a service pathway that includes ordering, specimen selection, laboratory processing, report interpretation, treatment access, patient communication, and follow-up. A purely numerical design would be misleading without internal patient-level data; a purely descriptive design would miss the need for management discipline.

Evidence comes from public regulatory records, Foundation Medicine product information, FDA and CMS material, peer-reviewed validation studies, ASCO and ESMO guidance, and recent literature on molecular tumor boards, implementation, equity, and clinical utility. No private patient files, invented interviews, or undocumented institutional statistics are used. That boundary is important. It keeps the paper honest and allows readers to check the foundation of the argument.

Case interpretation follows a simple rule: separate what is proven publicly from what must be governed locally. Public evidence can establish assay scope, approval history, validation claims, and policy environment. Local institutions still have to prove whether they order testing early, protect tissue, review reports, secure access, and communicate results well. The case therefore becomes a lens for practice rather than a claim that one company controls the future of oncology.

Academic contribution sits in that separation. The paper does not inflate comprehensive genomic profiling into a cure-all, and it does not dismiss its value because access remains uneven. Instead, it examines the space between scientific capability and clinical use. That is where many healthcare innovations either become dependable care or remain impressive but inconsistent technology.

Chapter 2: Comprehensive Genomic Profiling Literature

2.1 What comprehensive genomic profiling adds

Comprehensive genomic profiling adds breadth, but breadth is not the same as clinical value. The reason it matters in advanced solid tumors is that many treatment questions no longer sit neatly inside one gene, one drug, or one tumor type. A patient may need testing for an approved biomarker in the primary cancer, a resistance alteration after prior therapy, a tumor-agnostic marker, or a molecular signal that opens a trial rather than an immediate standard treatment. Single-gene testing can still be appropriate when the question is narrow. It becomes less efficient when the clinical problem is already wider than one alteration.

FoundationOne CDx is a useful case because it shows how comprehensive genomic profiling moved from specialist molecular pathology into routine oncology decision-making. FDA material identifies FoundationOne CDx as a tissue-based test that detects substitutions, insertion and deletion alterations, copy-number alterations, and selected rearrangements across 324 genes, along with selected genomic signatures relevant to solid tumors (U.S. Food and Drug Administration, 2024). The published validation work supports its role as a broad next-generation sequencing assay for solid tumors, while Foundation Medicine describes it publicly as a comprehensive genomic profiling test with companion-diagnostic uses (Foundation Medicine, 2026; Milbury et al., 2022). Those facts establish why the test belongs in a serious discussion of precision oncology. They do not settle whether the result will be ordered early, interpreted well, reimbursed smoothly, or connected to a realistic option for the patient.

The clinical question begins after the report is produced. A variant may be technically reportable and still have limited value for the person being treated. Some findings support an approved therapy in a specific tumor type. Some point toward tumor-agnostic treatment. Others help explain resistance, refine prognosis, or justify referral to a molecularly matched trial. Many findings sit in a more uncertain middle ground, where the oncologist has to weigh evidence strength, prior therapy, performance status, disease pace, access, and patient preference. ASCO’s provisional clinical opinion on somatic genomic testing in metastatic or advanced solid tumors is useful for that reason: it supports testing where results may guide care, but it does not treat genomic information as self-interpreting (Chakravarty et al., 2022).

Actionability needs discipline. The ESMO Scale for Clinical Actionability of Molecular Targets was developed because not every alteration deserves the same clinical weight. A target linked to a proven therapy in a defined setting is not the same as a biologically interesting alteration supported only by early evidence or trial rationale (Mateo et al., 2018). That distinction matters at the bedside. Patients may hear “mutation found” and assume a treatment has been found. Clinicians have to explain when a result is actionable, when it is uncertain, and when it does not change the immediate plan.

Comprehensive profiling also changes the work of pathology. Tissue becomes more than diagnostic material; it becomes a limited clinical resource. Tumor content, fixation, necrosis, decalcification, biopsy size, and prior tissue use can determine whether profiling succeeds or fails. If molecular testing is considered only after standard pathology has consumed the best material, the service may lose the evidence it later needs. In that sense, genomic profiling begins before the order is placed. It begins when tissue is obtained, handled, triaged, and protected for possible treatment decisions.

What comprehensive genomic profiling adds, then, is not only a larger panel. It adds a wider decision pathway. The test can bring therapy matching, resistance interpretation, trial referral, and tumor-signature assessment into one report. Its value depends on whether the oncology service can use that report without delay, exaggeration, or confusion. A broad molecular map helps only when the route from tissue to decision is organized well enough for the patient still to benefit.

Figure 1. FoundationOne CDx genomic scope. Copyright © June 2026 William I. Njemanze.

Source. FDA and Foundation Medicine public product information; original visualization prepared for NYCAR publication use.

2.2 Guidance, actionability, and evidence levels

ASCO’s provisional clinical opinion on somatic genomic testing in metastatic or advanced solid tumors supports genomic testing where biomarkers are linked to approved therapy, and it also recognizes the role of testing for tumor-agnostic indications and selected fusions. That guidance does not ask clinicians to test blindly. It asks them to connect molecular testing with therapeutic relevance. Such a position is important for management because it places responsibility on the care pathway, not only the laboratory.

ESMO’s ESCAT framework offers another useful discipline. By ranking genomic alterations according to clinical evidence, ESCAT helps distinguish findings with strong therapeutic support from signals that remain exploratory. Oncology practice needs that separation. Without it, patients may hear the word actionable when the practical next step is weak, unavailable, or unsupported by enough evidence. Precision medicine loses trust when it confuses biological interest with treatment readiness.

Molecular tumor boards have developed partly because interpretation is no longer a solo act. Pathologists, oncologists, geneticists, pharmacists, trial coordinators, and sometimes ethicists or payer specialists may need to review the same report. Westphalen and colleagues’ ESMO work on molecular tumor board structure and quality indicators reflects a growing recognition that decision quality depends on team process. Good boards do not merely admire rare variants. They decide whether a finding changes treatment, warrants a trial search, requires germline referral, or should be documented without immediate action.

Literature on implementation shows unevenness. Multicenter studies can demonstrate feasibility, high testing success, and treatment recommendations, yet actual receipt of matched therapy may remain lower than the number of actionable findings suggests. Reasons include patient deterioration, unavailable drugs, trial distance, coverage limits, and clinical judgment against treatment. Serious research should not hide this attrition. A useful paper should show where molecular promise narrows as it passes through real healthcare systems.

2.3 From analytic validity to diagnostic governance

Analytic validity asks whether the assay detects what it claims to detect. Clinical validity asks whether detected alterations have meaningful association with disease or therapy. Clinical utility asks whether testing improves patient management or outcomes. Governance asks a different but necessary question: can the institution make analytic and clinical value dependable across ordinary patients, not only in ideal cases? That final question is where health management enters the science.

FDA approval and validation studies establish a foundation. They cannot replace local workflow. Even a validated assay can be undermined by late ordering, inadequate documentation, poor report routing, or untrained interpretation. A laboratory report that arrives in an electronic record without an assigned reviewer may become a stranded object. A result requiring payer action may lose value if authorization work is delayed. Molecular data need a pathway with deadlines and owners.

Payer policy has shaped U.S. adoption of next-generation sequencing. CMS coverage decisions expanded access for eligible Medicare beneficiaries with advanced cancer, while local coverage policies and commercial payer rules continue to affect actual practice. Coverage language is not a dry reimbursement topic. In precision oncology, it determines who receives testing, when testing happens, and whether treatment can follow. Equity therefore begins inside policy and continues through every clinic step that translates policy into practice.

Implementation literature also warns against enthusiasm without audit. A center may report high test volumes while still missing patients who have poor referral access. Another may provide testing but fail to track whether reports lead to treatment, trial referral, or no action. Governance requires denominator discipline: eligible patients, tests ordered, tests completed, reports reviewed, options identified, options reached, and reasons for failure. Without denominators, precision oncology becomes a story of selected successes.

2.4 Economic evidence and clinical value

Cost discussion in precision oncology is often too narrow. Test price is easy to see, while the value of avoiding ineffective therapy, identifying a trial, clarifying resistance, or shortening diagnostic uncertainty is harder to measure. Economic evaluation therefore has to account for the whole care pathway. A report that arrives too late has little value even if the assay is scientifically impressive. A report that changes therapy at the right point may justify its cost through better sequencing of care, reduced waste, or improved patient planning.

Value also depends on disease setting. In tumors with well-established targetable alterations, comprehensive profiling may prevent a long sequence of scattered tests. In cancers with fewer validated targets, profiling may still support trial search or resistance interpretation, but expected clinical conversion may be lower. Treating all cancers as if they share the same genomic yield is poor management. Programs should review utilization by tumor type, stage, line of therapy, and action outcome.

Economic stewardship should not be confused with denial. A payer or administrator may reduce cost by limiting testing, but cost control that blocks appropriate testing can become clinically and ethically unsound. Likewise, unlimited testing without pathway control can waste resources. The better position is disciplined use: test when the result can plausibly change management, order early enough to matter, and track whether results lead to decisions.

Research centers should also examine opportunity cost. Every tumor board hour, pathology review, authorization appeal, and trial referral consumes professional time. If testing expands without staffing, the program may slow down the very care it intends to improve. Economic evidence therefore belongs with workforce planning, not only with reimbursement policy.

Chapter 3: Foundation Medicine Case Context

3.1 FoundationOne CDx as a case study

FoundationOne CDx is used here as a case because its public record is unusually visible. FDA device pages, Foundation Medicine product material, validation studies, and payer coverage history allow a structured analysis without relying on private company data. The test’s scope across 324 cancer-related genes, selected rearrangements, microsatellite instability, tumor mutational burden, and companion diagnostic claims makes it suitable for examining molecular pathology and care governance together.

Case-study use does not mean endorsement. Foundation Medicine is treated as an example of a broader transition: advanced cancer care is increasingly tied to large-panel genomic evidence. Other platforms, academic laboratories, and liquid biopsy services belong to the same landscape. FoundationOne CDx remains useful because it illustrates the practical consequences of moving from targeted tests to a broader report. More information can improve decisions; it can also create uncertainty if institutions do not know how to interpret and act on it.

Foundation Medicine’s portfolio also raises the tissue-versus-liquid question. Tissue-based testing remains central when adequate specimens are available. Liquid biopsy can help when tissue is limited, inaccessible, or when a rapid noninvasive option is clinically useful. Neither approach should be described as universally superior. Each has strengths, limits, and interpretation risks. Good governance tells clinicians when to use each option, how to explain negative results, and when repeat or complementary testing may be needed.

Advanced cancer patients do not experience product categories in the abstract. They experience waiting for a result, hearing whether a mutation has been found, learning whether insurance will pay, and facing whether treatment is possible. Case analysis therefore has to keep the patient pathway visible. FoundationOne CDx is technically important, but its public significance comes from how that technical capacity enters care.

3.2 Regulatory and coverage context

Regulatory approval gives clinicians a level of confidence that a test has been reviewed for intended use. FDA approval of FoundationOne CDx as a broad companion diagnostic placed comprehensive genomic profiling into a formal device framework for solid tumors. Later supplements and companion diagnostic additions show how the test’s clinical role changes as therapies and labels expand. That dynamic nature is central to precision oncology. A report environment can become outdated if it is not updated as evidence and drug approvals change.

CMS coverage policy also belongs in the case. National coverage for next-generation sequencing in advanced cancer created a route for eligible Medicare patients to receive tests meeting specified criteria. Coverage does not remove every access barrier, but it changes the management landscape. Clinicians, billing teams, navigators, and tumor boards must understand eligibility, documentation, and follow-through. Precision oncology governance therefore includes reimbursement literacy.

Commercial payer variation remains important. Patients outside Medicare may face prior authorization, denial, out-of-pocket exposure, or plan-specific restrictions. Rural practices may lack local expertise. Community oncology sites may depend on external pathways for molecular tumor board review. Academic centers may have better infrastructure but still struggle with speed and trial access. A responsible case study does not treat coverage as solved because one payer pathway exists.

Policy interpretation must remain current. New drug approvals, companion diagnostic claims, local coverage updates, and guideline revisions can change the meaning of a genomic result. Static protocols are risky in this field. Health systems need an update mechanism that links oncology, pathology, pharmacy, payer relations, and informatics. Without it, old pathways can continue to guide new science.

3.3 Case boundaries

Public evidence limits the paper’s claims. No internal Foundation Medicine records, hospital performance data, proprietary turnaround-time data, or patient-level outcomes are used. That boundary is deliberate. It protects the work from pretending to know what is not available. Public sources can support a governance analysis; they cannot prove how every institution orders, interprets, or acts on every test.

Scoring in the governance model is author-developed and interpretive. It reflects the case evidence and the management logic reviewed in the paper. It should not be read as a clinical outcome measure, company rating, or regulatory assessment. The numbers are meant to help readers see the pathway. They function like a management scorecard: useful for discussion, not definitive by themselves.

Foundation Medicine’s case also cannot represent every cancer type equally. Actionability varies widely by disease, stage, treatment history, tissue availability, and geography. Lung cancer, colorectal cancer, breast cancer, prostate cancer, melanoma, and rare tumors each carry different testing norms. A single paper cannot settle all of those clinical differences. What it can do is provide a governance lens that travels across settings.

Practical value lies in transfer. Hospital leaders, program directors, tumor board chairs, payer-access teams, and graduate researchers can use the case to ask whether their own pathway protects timing, tissue, interpretation, access, and equity. Transfer does not mean copying Foundation Medicine’s model. It means learning how a complex diagnostic service should be judged.

3.4 Report design and clinical readability

Report design carries clinical weight. A comprehensive genomic profile may include a large amount of molecular information, but clinicians need a hierarchy that separates urgent treatment signals from background findings. Report language should identify approved therapy associations, resistance implications, potential trials, tumor-agnostic markers, and uncertain findings without forcing the oncologist to reconstruct the evidence alone during a busy clinic day.

Readable reports do not mean simplified science. They mean disciplined presentation. Variant nomenclature, evidence level, therapeutic association, and limitations should be clear enough for oncologists, pharmacists, tumor boards, and navigators to use consistently. Poor presentation increases the risk that one clinician overacts, another ignores the same result, and a patient receives uneven advice depending on where the report lands.

Foundation Medicine has invested in report structure and therapeutic associations, yet institutional interpretation still matters. A commercial report cannot know every local formulary issue, trial slot, patient preference, insurance rule, or performance-status concern. Local governance therefore has to translate the report into a care decision. That translation is where molecular pathology, oncology, access work, and patient communication meet.

Clinical readability should be audited through user behavior. Programs can ask whether clinicians understand the report, whether tumor board notes clarify action, whether patients receive plain explanation, and whether access teams know which evidence to submit. Those questions turn report design from a vendor matter into a service-quality issue.

Chapter 4: Molecular Pathology and Diagnostic Governance

4.1 Specimen quality and tissue stewardship

Specimen quality is the first governance test. Before sequencing begins, tissue has already passed through biopsy decisions, fixation, processing, pathology review, and block selection. Small biopsies, decalcified specimens, necrosis, low tumor purity, and exhausted tissue can weaken or prevent molecular testing. These details may appear technical, yet they carry management consequences. A center that delays genomic planning may discover too late that no adequate specimen remains.

Pathologists occupy a central position in this chain. They know whether tissue is sufficient, which block is most suitable, whether macrodissection may help, and whether additional sampling is necessary. Oncologists often experience only the final report or failure notice. Governance connects those perspectives earlier. A good pathway should bring pathology into the decision before the last usable tissue is consumed by sequential tests or routine processing.

Specimen governance also requires language clinicians can use. Reports of quantity not sufficient, low tumor content, or assay failure should not end the conversation. They should trigger a defined response: review alternate tissue, consider liquid biopsy where appropriate, examine re-biopsy feasibility, and communicate the effect on treatment timing. Each step needs ownership. Otherwise, a failed test becomes a quiet delay rather than an active clinical problem.

Ethical stakes are real. Re-biopsy may create discomfort, cost, and risk for a patient who may already be medically fragile. Ordering must therefore be purposeful. A test that is unlikely to change management should not be presented as reflex modernity. Conversely, a patient with plausible targeted options should not lose opportunity because no one protected tissue early. Tissue stewardship is patient stewardship.

4.2 Report interpretation

Variant interpretation is where molecular pathology becomes clinical judgment. FoundationOne CDx and similar reports can identify short variants, copy number changes, rearrangements, tumor mutational burden, microsatellite instability, and therapeutic associations. Reading those findings requires more than recognition of a gene name. Tumor type, line of therapy, prior treatment, resistance context, evidence level, drug label, and trial availability all influence meaning.

Misinterpretation can occur in both directions. Some clinicians may overread variants and pursue weak options. Others may underuse a report because unfamiliar molecular language makes the finding seem remote from everyday oncology. Molecular tumor boards help by providing a structured setting for interpretation. Their value depends on discipline: clear cases, prepared summaries, evidence ranking, treatment feasibility, documentation, and follow-up.

Variants of uncertain significance require particular caution. They can be biologically interesting without being clinically actionable. Patient communication must avoid turning uncertainty into hope that the evidence cannot support. Precision oncology should be hopeful where evidence allows, but honest where evidence is immature. That balance is a professional skill, not a footnote.

Interpretation also affects institutional learning. If reports identify frequent barriers to action, the program should know. Are results arriving after treatment starts? Are actionable variants being missed because tumor board review is inconsistent? Are trial referrals failing because distance or eligibility rules intervene? Report interpretation should generate pathway intelligence, not only one-case decisions.

4.3 Tumor board practice

Molecular tumor boards are most useful when they convert complexity into accountable recommendations. A good board does not simply recite the report. It states whether the finding supports an approved therapy, an off-label discussion, trial referral, resistance interpretation, germline evaluation, or no immediate action. Documentation should include the reason. Without that record, future clinicians cannot easily understand why a genomic finding did or did not change care.

Membership matters. Medical oncology, pathology, molecular genetics, pharmacy, clinical trials, genetic counseling, nursing navigation, and payer access may all be relevant. Not every case needs every voice, but the system should know when to bring each function in. A tumor board that lacks access and trial coordination may generate recommendations that never reach the patient. A board without pathology may overlook specimen constraints. A board without documentation becomes institutional memory by rumor.

Turnaround time matters as much as expertise. A monthly tumor board may be educational but too slow for many advanced cancer decisions. Some centers use rapid virtual review, disease-specific molecular clinics, or structured electronic consultation. Format is less important than fit. Patients with active progression need a pathway that matches clinical urgency.

Governance should track board performance. Useful indicators include time from report receipt to review, percentage of reports reviewed, percentage with documented recommendation, number referred to trials, number receiving matched therapy, and reasons for nonaction. These indicators do not reduce care to metrics. They help leaders see whether the system is doing what it claims.

4.4 Companion diagnostics and resistance logic

Companion diagnostic status gives a molecular finding formal therapeutic relevance, but it should still be read in clinical context. A label-linked biomarker may point toward a treatment, yet prior exposure, comorbidity, organ function, performance status, and patient goals remain decisive. The test can identify eligibility; it cannot complete judgment. Governance protects that distinction.

Resistance interpretation has become increasingly important as targeted therapy moves earlier in care. A tumor may change under treatment pressure. New alterations may explain why a therapy stopped working or why a later option is unlikely to help. Comprehensive profiling can support this analysis, but only when clinicians order it at a relevant moment and compare findings with treatment history. Molecular data without a timeline is often less useful than it appears.

Tumor-agnostic indications add another layer. Markers such as microsatellite instability and tumor mutational burden may support treatment across cancer types under specified conditions. These markers should not be treated as slogans. Their predictive meaning depends on assay method, clinical setting, drug label, and evidence interpretation. Precision oncology is strongest when it respects both the promise and the boundary of tumor-agnostic treatment.

Pharmacists can help connect companion diagnostic findings to real treatment conditions. Dosing, interactions, toxicity, access restrictions, and sequencing concerns often determine whether an option is practical. Molecular tumor boards that include pharmacy input tend to make recommendations that are closer to usable care.

Chapter 5: Precision Oncology Operations

5.1 Ordering and turnaround

Ordering comprehensive genomic profiling is not a clerical step. It is a clinical timing decision. In metastatic or advanced disease, waiting until standard options are exhausted may reduce the chance that a patient remains well enough to benefit. Earlier testing, where clinically appropriate, gives oncologists more room to compare targeted therapy, immunotherapy markers, trial options, and resistance clues. Late testing often produces information after the decision window has closed.

Turnaround time should be managed from the moment the question arises, not from the day the laboratory accepts the specimen. Real delay includes recognition, consent if required, specimen request, pathology review, shipping, sequencing, report delivery, interpretation, payer review, and treatment access. Programs that count only laboratory processing time may underestimate what the patient experiences. Operational honesty requires measuring the full chain.

Electronic health records can help or hinder. A simple order set may improve consistency. Poorly designed workflows may bury results in scanned documents, place them outside oncology review, or fail to alert the right clinician. Informatics should be built around action: result received, interpretation pending, recommendation made, access step assigned, patient informed. Anything less leaves too much to memory.

Ordering discipline also protects against unnecessary testing. Some patients may not benefit because disease status, prior testing, performance status, or goals of care make the result unlikely to alter management. Clinical discretion should remain. Governance does not mean ordering every test; it means making the reason for ordering or not ordering explicit enough for professional review.

Figure 2. Precision oncology governance pathway. Copyright © June 2026 William I. Njemanze.

Source. Author-developed service pathway derived from the case analysis.

Read also: Behavioral Strategies In Health And Social Care Management

5.2 From report to treatment

Molecular reports often give several categories of information. Some findings point to FDA-approved therapies in the tumor type. Some point to tumor-agnostic indications. Others suggest resistance, prognosis, or clinical trials. The oncology team must sort those categories quickly. Treating every finding as equal slows the pathway and confuses communication. A structured interpretation note can separate immediate clinical action from longer-range information.

Payer access is part of treatment conversion. Prior authorization, evidence submission, formulary limits, and patient assistance may determine whether a recommendation becomes a prescription. Program leaders should not leave this work to improvisation after the tumor board has spoken. Access teams need early notification, documentation templates, and escalation rules. A genomic recommendation without access support is often a partial decision.

Trial matching is also vulnerable to attrition. A report may identify a plausible trial, but eligibility, geography, slots, biopsy requirements, travel, and patient preference may prevent enrollment. Tracking only potential matches exaggerates program impact. A more honest record follows the path from molecular finding to trial discussion, referral, screening, and enrollment or reason for non-enrollment.

Patient communication deserves more care than it often receives. Genomic reports can sound decisive, yet many findings are probabilistic or context-dependent. Patients need to understand whether a result opens a standard treatment, suggests a trial, explains resistance, or provides no immediate option. Plain language does not weaken scientific seriousness. It protects consent and trust.

5.3 Managing uncertainty

Precision oncology produces uncertainty as well as clarity. A result may identify no actionable alteration. A tumor may carry an alteration with evidence in another cancer type but not the patient’s own. A drug may be available only in a trial. A therapy may be biologically plausible but clinically weak. Governance should prepare clinicians to manage these outcomes without overpromising.

Negative results require explanation. A patient who undergoes comprehensive profiling may expect a targeted therapy. When none appears, the team should clarify that absence of an actionable alteration is still useful information, though not the desired result. It may prevent unsuitable treatment, support standard care, or guide future testing. Silence after a negative report can feel like abandonment.

Uncertainty also appears when tissue and liquid biopsy results differ. Clonal heterogeneity, tumor shedding, sampling site, treatment pressure, and assay limits may all matter. Clinicians need rules for reconciling discordant information. Those rules should draw on pathology, molecular expertise, and clinical context rather than a simplistic hierarchy.

Every precision-oncology program should build a feedback loop. Cases where results did not alter care are as important as successful matches. They reveal timing problems, access barriers, tissue failures, unrealistic trial pathways, and communication gaps. A program that learns only from successes will repeat avoidable failures.

5.4 Trial matching and sequencing discipline

Trial matching is not simply a search function. A trial option must be evaluated against eligibility, disease tempo, prior therapy, travel, insurance, patient preference, and urgency. Reports that list trial possibilities can be helpful, but they do not complete the work. Someone must decide whether the option is realistic and whether discussion should happen now or after another treatment step.

Sequencing discipline matters because targeted therapies can be lost through poor timing. If a patient receives a later-line standard regimen while a relevant genomic result sits unreviewed, the opportunity may narrow. If a trial is discussed only after performance status declines, referral may become symbolic. Care teams need rules for when genomic evidence should interrupt, redirect, or support the existing treatment plan.

Clinical trial offices should be linked to molecular review. Trial coordinators can confirm slot availability, screening requirements, geography, tissue needs, and timeline before a recommendation is given to the patient. Without that link, tumor boards may produce recommendations that sound promising but collapse during referral.

Patient preference remains central. Some patients may choose local standard care over travel for a trial. Others may accept travel if the rationale is explained clearly. Good governance does not pressure every patient toward research participation. It makes the option understandable and reachable when it is appropriate.

Chapter 6: Governance Model and Quantitative Reasoning

Table 2. Precision oncology governance variables and weights

Variable Meaning Weight Illustrative score
T Test timing: order early enough to influence decision. 0.18 76
Q Specimen quality: adequate tissue, tumor content, and assay success. 0.16 82
I Interpretation quality: evidence ranking and report-to-decision clarity. 0.22 86
A Action conversion: therapy, trial, resistance, or management decision reached. 0.18 80
C Coordination: molecular tumor board and cross-functional follow-through. 0.14 74
E Equity: access across payer, site, geography, and patient group. 0.12 74

Note. G = 0.18T + 0.16Q + 0.22I + 0.18A + 0.14C + 0.12E = 79.36, rounded to 79. Original table prepared for NYCAR publication use. Copyright © June 2026 William I. Njemanze.

6.1 Model purpose and variables

Weighted reasoning is included to clarify the governance argument. It does not estimate survival, assay sensitivity, company quality, or population benefit. It asks a narrower management question: how strong is the pathway that moves comprehensive genomic profiling from order to usable care? Such a model is appropriate only when its limits are visible. Numbers help organize judgment; they do not replace it.

Model variables are deliberately plain. T represents test timing. Q represents specimen quality. I represents interpretation quality. A represents action conversion. C represents tumor board coordination. E represents equity and access. Each variable is scored from zero to one hundred. The overall governance score is calculated as G = 0.18T + 0.16Q + 0.22I + 0.18A + 0.14C + 0.12E. Interpretation receives the highest weight because report meaning is the hinge between laboratory output and treatment decision.

Author-developed values used for illustration are T = 76, Q = 82, I = 86, A = 80, C = 74, and E = 74. These values yield G = 79.4. Rounded to the nearest whole number, the governance score is 79 out of 100. The score indicates a mature but incomplete pathway: strong technical and interpretive capacity, with access, coordination, and timing still requiring management attention.

Healthcare organizations can adapt the model using its own data. Test timing could be measured through days from progression to order and days from order to report. Specimen quality could include failure rates and repeat biopsy rates. Interpretation quality could use tumor board review rates and documentation completeness. Action conversion could track matched therapy or trial referral. Equity could examine payer, site, race, geography, and age patterns.

Figure 3. CGP governance score profile. Copyright © June 2026 William I. Njemanze.

Source. Author-developed diagnostic scoring for management discussion; not a clinical performance rating.

Figure 4. Weighted precision oncology governance model. Copyright © June 2026 William I. Njemanze.

Source. Computed from the author-developed weighted model.

6.2 Math check and interpretation

Arithmetic is straightforward. The timing contribution is 0.18 x 76 = 13.68. Specimen quality contributes 0.16 x 82 = 13.12. Interpretation contributes 0.22 x 86 = 18.92. Action conversion contributes 0.18 x 80 = 14.40. Tumor board coordination contributes 0.14 x 74 = 10.36. Equity contributes 0.12 x 74 = 8.88. Added together, the components equal 79.36, presented as 79.4 in the figure and rounded to 79 in narrative discussion.

Mathematical restraint is important. A score near 80 should not invite celebration without inspection. Interpretation may be strong while equity remains weak. Specimen handling may be reliable while trial access fails. A single total score can hide unevenness if leaders do not read the components. For that reason, the paper presents both the formula and the component profile.

Weight selection is also a judgment call. Another institution might weight equity higher because it serves a rural or historically underserved population. A center with repeated assay failures might weight specimen quality higher. A high-volume academic program might focus on tumor board throughput. The model’s value comes from making these decisions explicit. Hidden weights already exist in every program; the model forces them into discussion.

No p-values, confidence intervals, or regression claims are offered because the study does not use patient-level outcome data. Introducing statistical language without data would weaken the paper. Conceptual modeling is enough for this purpose. It gives administrators and clinicians a disciplined way to discuss a service that is clinically complex and operationally fragile.

6.3 Responsible use

Responsible use begins with denominators. Programs should know how many eligible patients were seen, how many were tested, how many tests succeeded, how many reports were reviewed, how many recommendations were made, and how many recommendations reached treatment or trial screening. Without denominators, precision oncology appears more successful than it may be in routine care.

Governance review should not be punitive. Delays and failures often reveal system design problems, not individual negligence. A pathologist may receive tissue late because ordering was late. An oncologist may not act because a result was routed poorly. A patient may miss a trial because transportation and insurance were not addressed early. Good review identifies the weak link and repairs the pathway.

Clinical judgment must remain central. Some patients should not pursue aggressive matched therapy because goals of care, performance status, toxicity, or personal preference point elsewhere. A pathway that turns every genomic finding into automatic treatment is not responsible. Governance protects decision quality by ensuring that action and nonaction are both reasoned and documented.

Comparative use across institutions should be cautious. Scores may reflect patient population, payer mix, data maturity, and service design. A community cancer center and an academic center may need different thresholds. The model should stimulate better questions, not produce a ranking table detached from context.

6.4 Sensitivity, thresholds, and limits

Sensitivity review keeps the model honest. If interpretation weight is reduced and equity weight is raised, the overall score changes only modestly, but the conversation changes sharply. Leaders begin to ask whether a technically sophisticated program is still failing patients who cannot reach timely testing or matched treatment. Such a shift is useful because it shows how values are embedded in weights.

Thresholds should be set by purpose. A research hospital may require a higher tumor board coordination score because it handles rare cancers and trial-heavy decisions. A community program may emphasize timing and access because delays and payer barriers are more visible. The model should be adjusted to fit institutional responsibility. Copying weights without reflection would make the tool mechanical rather than professional.

Limitations remain clear. A governance score cannot prove improved survival, response rate, or quality of life. Those outcomes require patient-level evaluation and long-term follow-up. The score only asks whether the service conditions are credible. In that sense, it functions like a readiness assessment: not the final proof of benefit, but a disciplined check on whether benefit can realistically reach patients.

Programs should also resist metric gaming. A center can improve apparent turnaround by excluding difficult cases, improve action rates by testing only obvious cancers, or improve equity reports by failing to collect demographic detail. Good governance anticipates these risks. Indicators should be reviewed by clinicians, administrators, and equity leads together, with enough narrative context to prevent superficial success.

Chapter 7: Equity, Data Stewardship, and Institutional Learning

7.1 Equity in testing and access

Precision oncology can widen or narrow disparities depending on how it is governed. Patients with better insurance, academic-center access, transportation, digital literacy, and specialist referral may reach genomic testing earlier. Patients in rural areas, low-resource systems, or fragmented coverage environments may wait longer or miss testing altogether. Equity is therefore not an optional social paragraph. It is part of diagnostic performance.

Coverage policy helps but does not settle fairness. Medicare coverage for eligible next-generation sequencing tests can improve access for certain patients, but commercial payer variation, documentation requirements, and site-level familiarity still matter. Staff who understand payer rules can prevent delay. Patients without such navigation may experience precision oncology as another barrier added to an already difficult diagnosis.

Race, ancestry, geography, and socioeconomic status also shape trial access. A molecular finding may point to a trial, but distance, eligibility criteria, trust, language, work responsibilities, and cost can prevent participation. Programs that record only trial matching miss the equity question. They should track whether referred patients actually screen and enroll, and why others do not.

Equity work should be practical. Reflex testing protocols, community oncology partnerships, tele-molecular tumor boards, patient navigation, plain-language materials, and coverage assistance can reduce variation. None of these steps is glamorous. They are the ordinary infrastructure of fair genomic care.

Figure 5. Access bottlenecks in comprehensive genomic profiling. Copyright © June 2026 William I. Njemanze.

Source. Author-developed illustration of common pathway attrition; not a patient-level dataset.

7.2 Genomic data stewardship

Genomic data carry clinical value and privacy risk at the same time. Tumor sequencing is usually somatic testing, yet reports may reveal findings with possible germline implications or family relevance. Data may also enter research, registries, vendor systems, or institutional analytics. Patients deserve clarity about how information is used, who can see it, and what happens when results suggest inherited risk.

Data stewardship should be built into the pathway rather than addressed only when a problem appears. Consent language, report storage, access controls, recontact policy, data-sharing rules, and audit trails require review. Oncology teams do not need to become privacy lawyers, but they do need enough understanding to answer patient questions honestly and direct concerns to appropriate support.

Artificial intelligence and decision-support tools will make data stewardship more important. As reports become more complex and algorithms assist interpretation, institutions must know how tools are validated, updated, and supervised. A decision-support prompt should not become hidden authority. Clinicians remain responsible for judgment, and systems remain responsible for the quality of tools placed in their hands.

Trust is fragile in cancer care. Patients may accept genomic testing because they hope it will improve treatment, not because they fully understand data flows. Institutions should not exploit that vulnerability. Plain explanation, careful records, and responsible data use are part of ethical precision oncology.

7.3 Learning from nonaction

Precision oncology programs often highlight successful matched treatments. Nonaction deserves equal attention. A report may fail to change care because tissue failed, the patient deteriorated, no actionable result was found, insurance delayed access, the trial was too far away, or the evidence was insufficient. Each reason teaches something different. Lumping them together as no action wastes learning.

Case review should distinguish unavoidable limits from fixable failures. Tumor biology may not offer a target. That is unavoidable. Late ordering, poor routing, missing authorization, and weak trial navigation are fixable. Programs should not comfort themselves with scientific uncertainty when operational delay was the real cause. Honest classification protects future patients.

Learning also requires humility. A matched therapy may produce little benefit. A patient may reject a recommendation. A trial may close. Real-world precision oncology is not a clean line from variant to response. Institutional learning should record outcomes without turning disappointment into blame. The aim is to improve the next decision, not to defend the last one.

Regular reporting can support the learning cycle. Quarterly reviews of test volume, turnaround, failed specimens, tumor board recommendations, access outcomes, trial referrals, and equity patterns would tell leaders whether the pathway is improving. Such reporting converts precision oncology from a specialty enthusiasm into a governed service.

7.4 Community oncology and referral equity

Community oncology settings carry much of the real burden of advanced cancer care. Many patients never enter a large academic center until late, if at all. Comprehensive genomic profiling must therefore work outside highly resourced institutions. If molecular tumor board access, tissue stewardship, and payer navigation exist only at academic sites, precision oncology will reproduce the geography of privilege.

Referral equity requires bidirectional design. Academic centers can support community clinicians through virtual review, shared pathways, rapid consultation, and trial-navigation assistance. Community clinicians can provide early patient context, local treatment history, and practical knowledge about travel, family obligations, and coverage barriers. Neither side owns the whole truth of the case.

Turnaround expectations should reflect community workflow. Specimen retrieval from outside pathology labs, prior authorization, and patient scheduling may take longer when systems are not integrated. Ignoring those delays creates unfair comparison. Improvement should focus on shared infrastructure: standard request forms, electronic report routing, and clear points of contact.

Equitable referral also means not transferring only the most complex administrative burden to the patient. A patient should not have to collect pathology slides, decode insurance letters, and identify trials alone. Navigation is not a luxury in this setting. It is the bridge between molecular possibility and usable care.

Chapter 8: Implementation Priorities

Table 3. Implementation priorities for comprehensive genomic profiling

Priority Action Expected value
Early ordering Define eligible settings and timing triggers. Protects the clinical decision window.
Tissue stewardship Add pathology review before order completion. Reduces failed or delayed testing.
Interpretation workflow Route reports to molecular review with evidence ranking. Improves consistency and documentation.
Access navigation Link payer support and trial referral to board recommendations. Increases conversion from result to care.
Equity monitoring Report testing and action rates by site, payer, and demographic pattern. Detects hidden exclusion.

Note. Original table prepared for NYCAR publication use. Copyright © June 2026 William I. Njemanze.

8.1 Ordering rules and specimen planning

Implementation should begin with clear ordering rules. Eligible disease settings, timing triggers, prior testing history, and tissue requirements should be written in language clinicians can use. Overly broad rules create waste and confusion. Overly narrow rules deny opportunities. Good rules support judgment while reducing avoidable variation.

Specimen planning should sit near the front of the pathway. When metastatic disease is diagnosed or progression occurs, oncology and pathology should know whether tissue is available, whether prior tissue is suitable, and whether re-biopsy or liquid biopsy should be considered. A simple specimen review step can prevent late failure. That step is especially important in cancers where small biopsies and limited tissue are common.

Consent and patient explanation should not be rushed. Patients need to know why testing is being ordered, what kinds of results may appear, why no actionable result is possible, and how long the process may take. Plain communication reduces unrealistic expectations and helps patients participate in decisions. Technical excellence without explanation is poor care.

Ordering metrics should include both speed and purpose. A center should not reward rapid testing if many orders are clinically irrelevant. Nor should it reward low utilization if eligible patients are being missed. Balanced review asks whether the right patients are tested early enough, with adequate tissue, and with a clear clinical question.

8.2 Tumor board and interpretation workflow

Interpretation workflow should be designed before the first report arrives. Reports should route automatically to the treating oncologist and the molecular review pathway. Cases with urgent or high-impact findings should have escalation rules. Clinicians should not have to search scattered files or rely on informal messages to know whether a result has been reviewed.

Molecular tumor board documentation should be concise and actionable. Recommended fields include diagnosis, stage, treatment history, specimen source, key alterations, evidence level, potential therapy, trial option, payer/access requirement, patient communication plan, and reason if no action is recommended. Such records support continuity when clinicians change or care transfers.

Board access should extend beyond academic centers where possible. Community practices may benefit from virtual molecular review or regional partnerships. Centralized expertise can reduce inequity if it is designed to include smaller sites. Without such support, genomic care may remain concentrated among patients who already have the strongest access.

Training should focus on practical interpretation. Clinicians do not need to memorize every alteration. They do need to understand actionability categories, resistance language, tumor-agnostic indications, uncertain findings, and when to consult pathology or genetics. Program maturity grows when frontline teams can recognize what they do not know early enough to seek help.

Figure 6. Molecular tumor board decision ecology. Copyright © June 2026 William I. Njemanze.

Source. Author-developed implementation map for NYCAR publication use.

8.3 Access, navigation, and patient follow-through

Access work should begin when a likely actionable route appears, not after a patient has waited through another appointment cycle. Prior authorization, appeal documentation, trial referral, travel support, financial counseling, and pharmacy review should be linked to the tumor board decision. A recommendation without navigation is not a complete service.

Patient navigators can protect continuity. They can help patients understand appointments, coverage letters, trial screening, specimen requests, and treatment scheduling. Navigation is especially important for patients with limited health literacy, language barriers, transport difficulties, or unstable insurance. Precision medicine should not require a patient to become a project manager while ill.

Follow-through metrics should be patient-facing. Did the result reach the oncologist? Was it explained? Was a recommendation recorded? Did access work start? Did the patient receive therapy, enter screening, or decline? Was the reason documented? These questions are more useful than counting tests alone.

Implementation also needs a stop rule. Not every genomic option should be pursued indefinitely. Toxicity, patient goals, evidence weakness, and clinical decline may make further pursuit inappropriate. Mature programs know when to act and when to protect the patient from burdensome escalation.

8.4 Quality indicators and audit practice

Quality indicators should be few enough to use and serious enough to matter. Recommended indicators include eligible-patient testing rate, median time from progression to order, median time from order to report, specimen failure rate, tumor board review rate, actionability category, matched therapy or trial referral rate, and documented reason for no action. These measures give leaders a practical view of the service.

Audit should include narrative review. Numbers may show that twenty patients did not reach matched therapy; narrative review explains why. Patient deterioration, no target, denial of coverage, travel barrier, trial closure, and clinical choice carry different meanings. Good audit separates fixable operational problems from biological and patient-centered limits.

Programs should review equity indicators at the same meeting where they review volume and turnaround. If one site orders tests late, if one payer group receives more denials, or if one demographic group is under-tested, the pathway needs correction. Equity belongs in quality management, not a separate annual statement.

Feedback should return to clinicians quickly. If pathology sees repeated inadequate specimens, oncologists need to know. If access teams see avoidable documentation failures, tumor boards need to adapt. If patients report confusion after result disclosure, communication materials need revision. Audit has value only when it changes behavior.

Chapter 9: Extended Professional Analysis

9.1 Foundation Medicine in the wider precision-oncology market

Foundation Medicine’s influence reflects a larger shift in oncology diagnostics. Laboratories now compete not only on analytic performance but on report design, companion diagnostic coverage, data integration, and clinician support. A report that is technically dense but clinically difficult to use may lose value. Vendors and institutions therefore share responsibility for making molecular evidence readable, current, and connected to care.

Commercial growth in genomic testing brings a risk of overextension. Marketing language can make comprehensive profiling sound universally decisive. Clinical practice is more limited. Many patients will not receive a matched therapy even after testing. Reasons may be biological, logistical, financial, or personal. A responsible research publication should state that clearly. Precision oncology is powerful when it finds a meaningful target, but not every tumor yields a usable answer.

FoundationOne CDx’s FDA-approved status gives it a formal role that many laboratory-developed tests do not share in the same way. Still, real-world practice involves multiple platforms. Academic centers may use institutional panels, community practices may use commercial send-outs, and some patients may receive liquid biopsy first. Governance principles should apply across platforms: order with purpose, protect sample integrity, interpret with evidence, manage access, and record outcomes.

Competition may also improve patient care if it forces clarity around turnaround, report quality, evidence updating, and affordability. Health systems should evaluate vendors through performance data and service fit, not branding alone. The relevant question is whether a platform helps the institution make better cancer decisions within its actual pathway.

9.2 Patient communication and clinical ethics

Patients often hear genomic testing through the language of hope. Hope has a place in cancer care, but it should not be used to cover uncertainty. Clinicians should explain that comprehensive profiling may find an approved option, a clinical trial, resistance information, hereditary implications, or no immediate target. Each possibility should be understandable before testing begins.

Communication after the result requires the same care. A targetable alteration is not the same as a guaranteed response. A trial option is not the same as enrollment. A variant of uncertain significance is not a hidden cure waiting to be unlocked. These distinctions can be painful, but they protect the patient’s right to informed choice. They also protect clinicians from replacing evidence with optimism.

Family implications deserve careful handling. Although tumor profiling is usually performed to guide cancer treatment, some findings may raise concern for inherited risk. Clear referral pathways to genetic counseling should be available. Oncology teams should not leave patients with ambiguous statements about family risk without support.

Ethics also includes burden. Re-biopsy, travel for trials, out-of-pocket costs, and complex administrative steps may be hard for a patient with advanced disease. A recommendation should be judged not only by molecular logic but by feasibility and patient values. Precision care becomes humane when it respects the person carrying the tumor.

9.3 Institutional accountability

Hospital leaders should treat comprehensive genomic profiling as a service line with accountability. That does not mean turning every molecular decision into bureaucracy. It means recognizing that fragmented responsibility creates hidden failure. Pathology, oncology, finance, trials, pharmacy, data governance, and patient navigation all touch the pathway. Leadership must make their connection visible.

Budget review should include downstream effects. Testing has a price, but so do failed tissue use, delayed therapy, unnecessary treatment, repeated appointments, missed trials, and inequitable care. A narrow cost view may reject a test without seeing the cost of ignorance. A careless utilization view may order testing without regard for value. Financial stewardship requires a balanced frame.

Workforce capacity matters. Molecular tumor boards, pathology review, genetic counseling, authorization, and trial coordination all require skilled labor. Programs that expand testing without staffing interpretation and access will create bottlenecks. Technology does not remove professional work; it changes the kind of work needed.

Accountability should reach the boardroom in major cancer centers. Genomic medicine affects reputation, quality, equity, research participation, and patient trust. Senior leaders should know whether the pathway works, where it fails, and how improvement is being measured. Precision oncology is too consequential to remain a specialist concern hidden inside departmental routines.

9.4 Emerging tools and future risk

Emerging decision-support tools will change how genomic reports are read. Software may rank variants, suggest trials, identify drug associations, or flag germline concern. These tools can help busy clinicians, but they also create a new governance burden. Leaders must know how recommendations are generated, updated, and reviewed. No algorithm should quietly become the physician of record.

Artificial intelligence may improve literature matching and trial search, yet it can also reproduce bias if trained on incomplete data or if access assumptions are not examined. A trial recommendation that ignores geography, language, payer restrictions, or patient frailty may look technically sophisticated while remaining clinically unrealistic. Future precision-oncology governance must include fairness checks inside decision support.

Data interoperability will also matter. Genomic reports, pathology systems, oncology notes, pharmacy records, trial databases, and payer documentation often sit in separate places. Integration can reduce delay, but integration without governance can spread errors quickly. A wrong diagnosis, outdated variant interpretation, or poorly mapped report field may travel across systems before anyone notices.

Future risk is not only scientific. It is managerial. Programs may accumulate testing volume faster than they build interpretation capacity. Vendors may update reports faster than local protocols change. Payers may alter coverage faster than clinicians can track. Sustainable precision oncology will require institutions that can revise pathways without losing control of daily care.

9.5 Scenario testing for program maturity

Scenario testing can reveal whether a precision-oncology program is ready for real pressure. One useful scenario is the patient with newly progressed metastatic lung cancer, limited tissue, and a fast treatment decision pending. The program should be able to show how tissue is reviewed, whether liquid biopsy is considered, how quickly results route to oncology, and who begins access work if an actionable driver appears.

Another scenario involves a rare tumor with no standard targeted option but a possible trial signal. Here, maturity depends on trial-search discipline, evidence ranking, patient communication, and honest feasibility review. A program that merely lists distant trials without helping the patient understand eligibility and travel burden is not providing meaningful trial matching. It is outsourcing complexity to the patient.

One scenario involves an apparently negative report. Mature programs do not treat this as a dead end. They ask whether the specimen was adequate, whether prior treatment or tumor evolution suggests repeat testing later, whether standard care remains best, and how the result should be explained. Negative genomic information can still improve care when it prevents unrealistic treatment pursuit or clarifies the next conventional decision.

Scenario testing should become part of quality review. It forces teams to walk through the actual steps of care, including delays and handoffs that ordinary dashboards may hide. Leaders learn quickly whether their pathway depends on named individuals, informal texting, or institutional memory. Dependable precision oncology cannot rely on hidden favors. It needs a route that still works when the usual expert is absent.

Chapter 10: Recommendations and Final Position

10.1 Recommendations for clinical leaders

Cancer programs should create a written comprehensive genomic profiling pathway that begins before test order and ends only after a documented clinical decision. The pathway should specify eligibility, ordering triggers, specimen review, expected turnaround, report routing, tumor board criteria, access steps, patient communication, and outcome recording. A pathway that stops at report receipt is incomplete.

Pathology and oncology should review tissue stewardship together. Early block selection, tissue conservation, and contingency planning for inadequate specimens should become routine. Centers should monitor assay failure, repeat biopsy, and time lost to specimen problems. These data will show whether specimen quality is being managed or merely hoped for.

Molecular tumor board recommendations should use evidence levels and clear action categories. Approved therapy, trial option, resistance interpretation, germline referral, and no immediate action should be separated. Documentation should include why a recommendation was or was not pursued. Such clarity protects continuity and reduces confusion.

Equity indicators should be reported with the same seriousness as volume indicators. Testing rates by site, payer, geography, race, age, and language access can reveal hidden disparity. When inequity appears, leaders should respond with navigation, community partnerships, tele-review, coverage support, and clinician education.

10.2 Recommendations for payers and administrators

Payers should recognize that genomic testing decisions are time-sensitive in advanced cancer. Authorization rules that require excessive documentation or repeated appeals can turn a clinically relevant test into a late result. Coverage policy should protect appropriate use while reducing administrative delay for evidence-supported indications.

Administrators should fund interpretation and navigation, not only testing. A budget that pays for sequencing but not for tumor board time, authorization support, trial coordination, or patient explanation will produce an incomplete service. Precision oncology requires human infrastructure. Cutting that infrastructure weakens the value of the test.

Data systems should support action. Report status, review date, recommendation, access step, trial referral, and outcome should be visible to the care team. Dashboards should not be decorative. They should identify cases at risk of delay and assign responsibility for the next step.

Procurement should evaluate vendors through service performance: validation, regulatory status, report clarity, evidence updating, turnaround, support, data governance, and affordability. Brand visibility should not replace disciplined review. A genomic platform is only as useful as the clinical pathway it can serve.

10.3 Final position

Comprehensive genomic profiling has changed advanced cancer care by giving clinicians a broader view of tumor biology. Foundation Medicine’s FoundationOne CDx case shows why that change is significant. A single assay can organize information that once required scattered testing, and it can connect patients to approved therapies, resistance clues, immunotherapy markers, and trial possibilities. Scientific value is real.

Practical value remains conditional. Genomic testing helps patients when ordered in time, performed on adequate tissue, interpreted by capable teams, supported by payer and trial pathways, explained plainly, and reviewed for equity. Weakness at any point can turn a sophisticated report into a missed opportunity. That is the central management lesson of the case.

NYCAR’s publication standard is met here through source discipline, operational relevance, restrained claims, verified references, transparent modeling, and professional use value. The paper does not call genomic testing miraculous, and it does not reduce precision oncology to cost control. It treats comprehensive genomic profiling as a serious diagnostic service that demands clinical judgment and institutional responsibility.

Future cancer programs will be judged not by whether they can order genomic reports, but by whether those reports improve decisions for real patients under real constraints. Precision oncology will mature when institutions can explain who was tested, who was missed, what was found, what was done, what failed, and what changed afterward. That is where molecular pathology becomes accountable care.

10.4 Use in professional training and institutional review

Professional training should use comprehensive genomic profiling as a cross-disciplinary case. Pathology learners need to see how tissue choices affect treatment. Oncology learners need to understand evidence levels and report limits. Health-management learners need to examine payer policy, workflow, data stewardship, and equity. Precision oncology is too interconnected for single-discipline teaching.

Institutional review should revisit the pathway at least twice a year. Drug labels, companion diagnostic claims, local coverage rules, clinical trials, and guideline recommendations change. A program that was sound in January may be outdated by September. Scheduled review protects patients from stale practice and protects clinicians from relying on memory in a rapidly changing field.

Board-level summaries should be concise but candid. Leaders should see testing volume, turnaround, failures, action categories, access outcomes, trial referrals, equity signals, and improvement actions. Such reporting does not need to expose private patient details. It needs to show whether the service is functioning as promised.

Final value of the case lies in its demand for seriousness. Comprehensive genomic profiling is not a symbol of modern oncology unless it improves the work of care. Foundation Medicine’s case helps reveal what that work requires: science, timing, tissue, interpretation, access, communication, and institutional memory. When those elements are governed together, molecular pathology becomes more than a report; it becomes a disciplined route to better decisions.

10.5 Closing governance statement

Molecular medicine will keep expanding. More targets, more drug combinations, more resistance patterns, more blood-based assays, and more algorithmic interpretation will enter practice. Complexity will not decline. Care quality will depend on whether institutions make the pathway clearer as the science becomes richer. That is the central governance demand of precision oncology.

Foundation Medicine’s case helps illustrate a broader truth: diagnostic innovation is not finished at approval, validation, or report delivery. The work continues through specimen handling, interpretation, access, explanation, treatment, trial referral, documentation, and review. Each step is ordinary enough to be overlooked and important enough to determine whether a patient benefits.

For health leaders, the professional obligation is plain. Do not mistake a genomic report for precision care. Build the pathway that lets the report matter. Assign owners, measure delays, protect tissue, support tumor boards, watch equity, explain uncertainty, and learn from nonaction. When those duties are taken seriously, comprehensive genomic profiling earns its place in advanced cancer management.

William I. Njemanze’s research publication therefore closes with a practical standard. Precision oncology should be judged by the quality of decisions it enables for patients facing real disease pressure. Molecular pathology supplies the evidence. Governance determines whether the evidence arrives in time, is understood properly, and becomes care rather than another document in the record.

Sustainable practice also requires humility. Some cancers will not reveal a useful target. Some patients will be too ill for a trial or a new therapy. Some findings will remain uncertain even after expert review. A serious program acknowledges these limits without retreating from the work. It protects the patient from false certainty, protects the clinician from unstructured complexity, and protects the institution from mistaking technological access for clinical responsibility.

NYCAR’s standard for this publication is therefore practical as well as academic: the work must be traceable, current, useful, and readable by professionals who make decisions. Comprehensive genomic profiling deserves that level of discipline because it sits close to moments of real consequence. A patient waiting for the next cancer decision needs more than an impressive assay. The patient needs a system capable of turning evidence into a responsible next step.

Responsible care finally depends on continuity. Genomic knowledge should not disappear when a clinician leaves, when a report is scanned into the wrong part of the record, or when an authorization appeal is handled by a different office. The pathway has to preserve memory, ownership, and explanation. In advanced cancer, time is not a neutral resource. Governance matters because delay has clinical meaning.

References

Chakravarty, D., Johnson, A., Sklar, J., Lindeman, N. I., Moore, K., Ganesan, S., Lovly, C. M., Perlmutter, J., Gray, S. W., Hwang, J., Lieu, C., André, F., Azad, N., Borad, M., Tafe, L., Messersmith, H., Robson, M., & Meric-Bernstam, F. (2022). Somatic genomic testing in patients with metastatic or advanced solid tumors: ASCO provisional clinical opinion. Journal of Clinical Oncology, 40(11), 1231-1258. https://doi.org/10.1200/JCO.21.02767

Centers for Medicare & Medicaid Services. (2018). National coverage determination for next generation sequencing for Medicare beneficiaries with advanced cancer (CAG-00450N). https://www.cms.gov/medicare-coverage-database/view/ncacal-decision-memo.aspx?NCAId=290

Foundation Medicine. (2026). FoundationOne CDx product information. https://www.foundationmedicine.com/test/foundationone-cdx

Foundation Medicine. (2026). FoundationOne Liquid CDx product information. https://www.foundationmedicine.com/test/foundationone-liquid-cdx

Gueye, A., Maroun, B., Zimur, A., Berkovits, T., & Tan, S. M. (2024). The future of collaborative precision oncology approaches in sub-Saharan Africa: Learnings from around the globe. Frontiers in Oncology, 14, Article 1426558. https://doi.org/10.3389/fonc.2024.1426558

Mateo, J., Chakravarty, D., Dienstmann, R., Jezdic, S., Gonzalez-Perez, A., Lopez-Bigas, N., Ng, C. K. Y., Bedard, P. L., Tortora, G., Douillard, J. Y., & Andre, F. (2018). A framework to rank genomic alterations as targets for cancer precision medicine: The ESMO Scale for Clinical Actionability of molecular Targets (ESCAT). Annals of Oncology, 29(9), 1895-1902. https://doi.org/10.1093/annonc/mdy263

Milbury, C. A., Creeden, J., Yip, W. K., Smith, D. L., Pattani, V., Maxwell, K., Sawchyn, B., Gjoerup, O., Meng, W., & Skoletsky, J. (2022). Clinical and analytical validation of FoundationOne CDx, a comprehensive genomic profiling assay for solid tumors. PLOS ONE, 17(3), e0264138. https://doi.org/10.1371/journal.pone.0264138

National Cancer Institute. (2024). Precision medicine in cancer treatment. https://www.cancer.gov/about-cancer/treatment/types/precision-medicine

U.S. Food and Drug Administration. (2024). FoundationOne CDx (F1CDx) – P170019/S048. https://www.fda.gov/medical-devices/recently-approved-devices/foundationone-cdx-f1cdx-p170019s048

Volders, P. J., Aftimos, P., Dedeurwaerdere, F., Martens, G., Canon, J.-L., Beniuga, G., Froyen, G., Van Huysse, J., De Pauw, R., Prenen, H., Lambin, S., Decoster, L., Vaeyens, F., Rottey, S., Van Dam, P.-J., Rutten, A., Schreuer, M., Loontiens, S., Smeets, F., & Maes, B. (2025). A nationwide comprehensive genomic profiling and molecular tumor board platform for patients with advanced cancer. npj Precision Oncology, 9, Article 66. https://doi.org/10.1038/s41698-025-00858-0

Westphalen, C. B., Boscolo Bielo, L., Aftimos, P., Beltran, H., Benary, M., Chakravarty, D., Collienne, M., Dienstmann, R., El Helali, A., Gainor, J., Horak, P., Le Tourneau, C., Marchiò, C., Massard, C., Meric-Bernstam, F., Pauli, C., Pruneri, G., Roitberg, F., Russnes, H. E. G., Solit, D. B., Starling, N., Subbiah, V., Tamborero, D., Tarazona, N., Turnbull, C., van de Haar, J., André, F., Mateo, J., & Curigliano, G. (2025). ESMO Precision Oncology Working Group recommendations on the structure and quality indicators for molecular tumour boards in clinical practice. Annals of Oncology, 36(6), 614-625. https://doi.org/10.1016/j.annonc.2025.02.009

Woodhouse, R., Li, M., Hughes, J., Delfosse, D., Skoletsky, J., Ma, P., Meng, W., Dewal, N., Milbury, C., & Clark, T. A. (2020). Clinical and analytical validation of FoundationOne Liquid CDx, a novel 324-gene cfDNA-based comprehensive genomic profiling assay for cancers of solid tumor origin. PLOS ONE, 15(9), e0237802. https://doi.org/10.1371/journal.pone.0237802

World Health Organization. (2020). WHO report on cancer: Setting priorities, investing wisely and providing care for all. https://www.who.int/publications/i/item/9789240001299

The Thinkers’ Review

Cherish Chiemela Okoroji

Offshore Wind Megaproject Governance in Volatile Energy Markets

An Engineering Management Study of Delivery Risk, Regression-Based Schedule Control, and Case-Calibrated Project Assurance


Research Publication by Cherish Chiemela Okoroji

Institutional Affiliation: New York Center for Advanced Research (NYCAR)


Publication No.: NYCAR-TTR-2026-RP032

DOI: https://doi.org/10.5281/zenodo.20510030

Date: June 2026


Peer Review Statement

This research publication has been reviewed under the internal editorial framework of the New York Center for Advanced Research (NYCAR) and The Thinkers’ Review. The review assessed master’s-level engineering management coherence, offshore wind source integrity, megaproject governance reasoning, regression-based schedule-control suitability, energy-at-risk calculation, APA 7th alignment, visual evidence presentation, and professional relevance for project assurance in volatile energy markets. The work is approved for master’s-level NYCAR institutional publication.


Copyright © June 2026 Cherish Chiemela Okoroji. All rights reserved. NYCAR.

Contents


Abstract

Offshore wind turns energy policy into a physical test. A target can be announced in a ministerial speech, a lease can be awarded, a turbine can be specified, and a financial model can show attractive long-run capacity, yet none of those acts puts power on the grid. Delivery begins in the harsher place where blades, cables, foundations, converter stations, vessels, weather windows, ports, regulatory evidence, grid interfaces, and capital discipline have to meet at the same time. Dogger Bank, Vineyard Wind 1, and Ørsted’s United States offshore portfolio show that offshore wind is not just a renewable-energy category. It is a marine megaproject class with unusually tight connections between engineering control, public confidence, and financial exposure.

The publication studies those cases as evidence for engineering management. Dogger Bank is used to examine scale, phasing, high-voltage direct-current transmission, and learning transfer across a 3.6 GW project. Vineyard Wind 1 is used to examine how a turbine-blade failure can move from component quality into regulator action, construction stoppage, coastal concern, and public trust. Ørsted’s 2025 impairment disclosure is used to examine the point at which interest rates, seabed valuation, construction delay, and higher expected costs become part of the delivery risk picture. The cases are not treated as simple success or failure stories. They are read as signals of the conditions under which offshore wind governance either detects risk early or discovers it after the critical path is already damaged.

The study develops a regression-based schedule-control framework for project directors, owners’ engineers, lenders’ technical advisers, regulators, and public authorities. Schedule Variance Intensity is used as the dependent variable because delay in offshore wind means more than elapsed days; it reflects capacity exposure, phase dependency, workfront constraint, and critical-path pressure. Explanatory variables include supply-chain lead-time strain, turbine quality interruption, grid-readiness gap, regulatory stoppage exposure, vessel and port constraint, financing cost pressure, and governance response maturity. The model is presented as decision support, not as a claim that confidential project-control data have been analyzed.

The central finding is direct. Offshore wind delivery improves when the project can name the pressure moving the schedule, translate delay into deferred energy, and act before a technical weakness becomes a public failure. The energy-at-risk calculation gives that translation: capacity multiplied by capacity factor, delay days, and twenty-four hours. In volatile markets, offshore wind governance is not paperwork. It is the operating discipline through which engineered capacity becomes electricity delivered to people.

Keywords: offshore wind; megaproject governance; engineering management; schedule variance; energy-at-risk; project assurance; supply chain; grid readiness; regulatory risk.

Chapter 1: Introduction

Offshore wind has become one of the clearest places where energy strategy meets hard engineering reality. A government can announce a target, a developer can win an auction, and a turbine manufacturer can publish a rating, but none of that produces electricity until design interfaces, installation vessels, ports, cables, grid works, weather windows, manufacturing quality, finance, environmental conditions, and field execution converge. The distance between announcement and generation is where engineering management earns its importance.

The sector’s promise is undeniable. Offshore wind offers large-scale, low-carbon electricity close to coastal demand centers, and the size of modern projects can reshape national power mixes. Dogger Bank Wind Farm shows the scale now being attempted: 3.6 GW across three 1.2 GW phases in the North Sea, located about 130 kilometers from the Yorkshire coast and using high-voltage direct-current transmission for the United Kingdom’s initial wind-farm deployment of that technology. The project’s initial power in October 2023 marked a technical and symbolic milestone, but the milestone also illustrates how much management discipline is hidden behind a single phrase such as “initial power.” (Equinor, 2023; SSE Renewables, 2026).

Offshore wind is not a routine construction category with a green label attached. It is a marine megaproject class in which activity is planned around constrained vessels, specialized components, weather downtime, long-lead manufacturing, hazardous offshore work, complex logistics, and public expectations. Wind turbines have grown larger, foundations have become heavier, grid connections more demanding, and the economic exposure of delay more serious. Each technical advance changes the management problem. Larger turbines may reduce the number of foundations and cables, but they also raise manufacturing, transport, lifting, and quality-control consequences when one component fails.

The experience of Vineyard Wind 1 made this reality visible to the wider public. After the July 13, 2024 turbine blade failure, the U.S. Bureau of Safety and Environmental Enforcement ordered continuing restrictions that prohibited generation and further construction of certain turbine components until risk analysis and mitigation measures were submitted. The case was not just an equipment incident. It became a governance case involving safety oversight, public trust, coastal impacts, quality assurance, installation sequencing, and the timing of energy delivery. A single blade failure moved from a component issue to a project-control issue (BSEE, 2024a; BSEE, 2024b).

Ørsted’s 2024 financial reporting added another warning from a different angle. The company recognized large impairments connected mainly with its United States offshore projects, citing long-dated interest rates, lower seabed valuations, construction delays, and higher expected costs for Revolution Wind and Sunrise Wind. These disclosures show that offshore wind project risk is not confined to marine operations. The financial model is also part of the engineering management environment. Cost of capital, procurement timing, contract exposure, and construction delay all interact (Ørsted, 2025).

This study treats offshore wind megaproject governance as an engineering management problem, not as a general business challenge. The distinction matters. Engineering management requires the translation of technical uncertainty into decisions about schedule, cost, safety, reliability, quality, stakeholders, and organizational accountability. In offshore wind, the manager is expected to understand turbine technology, marine installation, electrical transmission, contracting, regulatory engagement, and capital discipline well enough to govern the project without pretending to be every specialist at once.

The central problem is not simply that offshore wind projects face risk. All large engineering projects do. The problem is that many risks in offshore wind interact in compressed and expensive ways. A quality defect can trigger a regulatory hold. A regulatory hold can disrupt vessel availability. Vessel disruption can delay follow-on installation. Delay can increase financing costs and defer energy revenue. Deferred energy can weaken public support. A weak project-control system sees each event separately. A disciplined governance system understands the chain.

The purpose of this study is to develop a master’s-level engineering management framework for governing offshore wind megaprojects in volatile energy markets. The study uses recent public evidence and develops a regression-based schedule-control model. The model does not claim access to confidential project databases. It explains how managers can structure project evidence so that risk drivers become measurable. The analysis is designed to support decision-making by project directors, engineering managers, owners’ engineers, lenders’ technical advisers, regulators, and public authorities involved in offshore wind delivery.

The research questions are direct. What engineering governance pressures are visible in recent offshore wind cases? Which project variables are most likely to explain schedule variance intensity? How can regression analysis help managers separate supplier-quality interruption from regulatory stoppage, grid-interface risk, vessel constraint, and financial pressure? How can energy-at-risk calculations make delivery delay visible in operational terms? What practical controls are needed to improve offshore wind megaproject assurance without slowing necessary delivery?

The study’s significance lies in the public stakes attached to delivery. Offshore wind is not only a developer’s investment. It is connected to electricity security, emissions policy, industrial strategy, port employment, regional development, and public confidence in the energy transition. When projects delay, the loss is not only a balance-sheet issue. It can affect decarbonization plans, grid adequacy, consumers, suppliers, and host communities. Engineering management therefore has to be treated as a public-capability discipline in this sector.

Chapter 2: Literature Review

Recent offshore wind literature has moved away from treating project risk as a simple list of technical hazards. The better literature shows that risk in wind power projects is systemic. Policy, economics, technology, construction, environment, and social conditions interact. Zhao, Su, Li, Suo, and Meng’s 2023 structural-equation and catastrophe-theory study is useful because it identifies policy, economic, technical, and construction factors as major risk groupings for wind power project design. The implication for engineering managers is practical: risk categories belong in relation to one another, not parked in separate registers where their combined effects disappear (Zhao et al., 2023).

Chou, Liao, and Yeh’s 2021 study of construction and operations risk in offshore wind projects also remains useful because it treats risk management as part of project execution rather than as an afterthought. Their use of risk impact and frequency thinking aligns with the everyday needs of engineering managers who requires prioritize controls. A risk register is not valuable because it is long. It is valuable when it allows the project team to distinguish between a high-frequency nuisance, a low-frequency catastrophic failure, and a medium-probability event that can move schedule and cost together (Chou et al., 2021).

Macroeconomic risk has become more important since the pandemic, inflation shock, and interest-rate increases. Yeter, Garbatov, Brennan, and Kolios’s 2023 work on macroeconomic impact in offshore wind risk management is especially relevant because it frames offshore wind finance through probabilistic and probabilistic thinking. The study’s emphasis on operational and macroeconomic data matches what the sector experienced in 2023-2025: higher capital costs, re-priced supply chains, procurement delays, and public renegotiation of projects that had once appeared commercially settled (Yeter, Garbatov, Brennan, & Kolios, 2023).

The NREL Offshore Wind Market Report: 2024 Edition provides an authoritative view of the U.S. market and its project pipeline. It notes that Vineyard Wind 1, Revolution Wind, and Coastal Virginia Offshore Wind were under construction during the report period and that the U.S. pipeline had reached a large potential generating capacity. Such pipeline figures matter because they show the gap between pipeline ambition and project-control capacity. A pipeline is not an energy system until projects pass through design, finance, fabrication, transport, installation, commissioning, and stable operation (McCoy et al., 2024).

Dogger Bank demonstrates the management implications of extreme scale. The project’s 3.6 GW design, three-phase delivery, and HVDC interface require more than standard construction sequencing. The project depends on high-voltage technology, offshore installation, large turbines, marine logistics, and long-term operations capability. Engineering management at this scale preserves learning across phases. A lesson identified in Dogger Bank A does not remain trapped in one phase if the same component, supplier, cable interface, installation method, or port procedure appears in Dogger Bank B or C (Equinor, 2023; SSE Renewables, 2026).

Vineyard Wind illustrates the cost of quality interruption in a politically visible project. A blade failure in a marine setting does not stay inside a factory nonconformance report. It affects safety authorities, coastal communities, fishing interests, tourism, press coverage, project finance, regulator confidence, and future approvals. For engineering managers, the incident reinforces the need for independent quality surveillance, manufacturing traceability, acceptance criteria, blade-handling controls, and a response system that can move quickly without hiding uncertainty (BSEE, 2024a; BSEE, 2024b).

Ørsted’s public disclosures show how economic and execution risks combine. Interest rates, seabed valuations, construction delays, and cost expectations can all affect project economics. The engineering manager cannot control interest rates, but the manager can control how quickly risks are detected, how credible the execution schedule is, how supplier issues are escalated, and how owners receive evidence before accounting impairment becomes the only visible warning (Ørsted, 2025).

Megaproject research outside offshore wind also informs the study. Large projects often suffer from optimism bias, strategic misrepresentation, weak front-end planning, and underdeveloped risk allowances. Offshore wind adds its own complications: marine installation, grid integration, new turbine platforms, and a supply base that requires expand while projects are already underway. Engineering governance therefore needs harder front-end realism than conventional energy-project optimism often allows.

The literature suggests that regression analysis is useful when management wants to move beyond narrative explanation. Offshore wind managers may know that supply chain, quality, regulatory engagement, vessels, grid readiness, and finance all matter. Regression design forces the team to define variables, assign measures, collect comparable project data, test relationships, and update assumptions. The method is not a substitute for professional judgment. It disciplines judgment by requiring evidence to be organized.

The gap this study addresses is the translation problem between risk literature and project-control practice. Much of the literature identifies risk categories. Project teams, however, need decision instruments. They need to know which risk categories are currently explaining delay, which variables have the clearest marginal effects, and what quantity of energy and revenue is being deferred. The regression framework developed here is intended to sit inside project assurance, not outside it as an academic exercise.

Chapter 3: Methodology and Regression Framework

The study uses an engineering-management case design supported by regression specification and case-calibrated projection. The qualitative component examines public evidence from Dogger Bank, Vineyard Wind 1, Ørsted’s offshore wind disclosures, NREL market reporting, and recent peer-reviewed studies on wind project risk. The quantitative component designs a regression model that can be used by project teams to explain schedule variance intensity. The design is practical: it describes what is measured, why it matters, and how results is expected to influence governance decisions.

The dependent variable is Schedule Variance Intensity, abbreviated SVI. It is defined as the number of delay days normalized by project capacity and phase exposure. In a simple implementation, SVI can be measured as delay days per gigawatt under construction. A more exact implementation can weight delay by critical-path exposure, offshore installation season, and commissioning dependency. The purpose is to avoid treating all days as equal. A delay during a narrow installation window carries a different project consequence from a delay in a less constrained office review period.

The central regression model is expressed as: SVI = β0 + β1SLS + β2TQI + β3GRG + β4RSE + β5VPC + β6FCP + β7GRM + ε. SLS represents supply-chain lead-time strain. TQI represents turbine quality interruption. GRG represents grid-readiness gap. RSE represents regulatory stoppage exposure. VPC represents vessel and port constraint. FCP represents financing cost pressure. GRM represents governance response maturity. The error term captures weather, local permitting complexities, contract details, and unobserved execution conditions.

Figure 1. Offshore wind governance flow from early signal to control action. Author-developed visual for this publication. Copyright © June 2026 Cherish Chiemela Okoroji / NYCAR. All rights reserved.

The variables are deliberately engineering-facing. Supply-chain lead-time strain can be measured through variance between planned and actual delivery dates for blades, foundations, cables, substations, and major electrical packages. Turbine quality interruption can be measured through nonconformance severity, inspection holds, rework hours, blade or nacelle rejection events, and field quality stoppages. Grid-readiness gap can be measured through the difference between turbine-side commissioning readiness and onshore/offshore transmission readiness. Regulatory stoppage exposure can be measured in days under formal stop order, partial restriction, or unresolved authority review.

Figure 2. Case-calibrated schedule-risk driver profile for offshore wind assurance. Diagnostic author-developed scores, not official project ratings. Copyright © June 2026 Cherish Chiemela Okoroji / NYCAR. All rights reserved.

Vessel and port constraint is measured through installation-vessel availability, port readiness, berth conflicts, mobilization delay, and demobilization costs. Financing cost pressure can be proxied through the change in risk-free rates or project weighted average cost of capital between bid and financial close or between financial close and major procurement. Governance response maturity is a composite managerial variable measured through escalation timeliness, independent assurance coverage, decision-right clarity, risk review frequency, and the quality of evidence provided to the owner’s board or steering committee.

The model can be estimated with ordinary least squares when the project dataset is large enough and variables are continuous. For an owner managing a portfolio, panel regression may be more useful because it allows comparison across projects and time. The panel form is SVI_it = α_i + τ_t + β1SLS_it + β2TQI_it + β3GRG_it + β4RSE_it + β5VPC_it + β6FCP_it + β7GRM_it + ε_it. The project fixed effect α_i captures persistent differences between projects, and the time effect τ_t captures sector-wide shocks such as inflation or vessel-market tightening.

The study also uses an energy-at-risk calculation. Deferred Energy at Risk, abbreviated EAR, is calculated as EAR = Capacity_MW × Capacity Factor × Delay Days × 24. For offshore wind, capacity factor varies by site and operating assumptions; managers uses the project’s base-case model rather than a generic number. The formula is valuable because it turns a schedule problem into a physical energy-delivery problem. A 30-day delay on an 806 MW project is not simply one lost month; it represents a measurable quantity of clean electricity not delivered to the grid.

A related revenue-at-risk calculation can be expressed as RAR = EAR × Contract Price. If the contract price is confidential, the model can be used internally with the project’s agreed offtake price. For public analysis, the equation is enough to show why delay belongs as a strategic control issue. A project manager who cannot translate delay into energy and financial exposure may struggle to win adequate attention from executives until the damage is already visible.

The research does not present confidential coefficients or claim that public cases are sufficient to estimate a statistically valid industry model. That would be irresponsible. Instead, it provides a defensible model specification and shows how verified public cases support the choice of variables. A future owner-operator, lender, or public authority could estimate the coefficients using project-control data across a project portfolio. The value of the model lies in making the evidence structure clear.

Validity is protected by separating verified case facts from model use. Dogger Bank evidence supports the importance of scale, phasing, HVDC interface, and long-distance marine execution. Vineyard Wind supports the importance of turbine quality interruption and regulatory stoppage exposure. Ørsted’s disclosures support the importance of financing cost pressure and execution delays. NREL reporting supports market and pipeline context. Peer-reviewed studies support the categories of risk included in the model. The study avoids pretending that public information can reveal every internal project-control decision.

For implementation, the model needs a clear coding manual. Supply-chain lead-time strain is not coded only as a narrative comment such as “supplier delay.” It is measured against the baseline procurement schedule, the revised forecast, and the critical-path relationship of the delayed package. A late component that has float may matter less than an on-time component with unresolved quality conditions. The coding manual is expected to therefore separate date variance, criticality, and recoverability.

Turbine quality interruption also needs severity grades. Minor nonconformances that can be repaired before installation is not modeled in the same way as failures that stop offshore activity or require regulator engagement. A practical scale can classify quality events as observation, repairable nonconformance, package hold, installation hold, and fleet-wide review. Regression analysis becomes more reliable when such grades are consistent across projects and packages.

Grid-readiness gap deserves particular discipline because it often sits between organizations. Offshore generation assets may be ready while transmission works are still under review, or grid works may be ready while turbines lag. Neither side is best allowed to declare success alone. The variable is expected to measure readiness alignment between generation, offshore substation, export system, onshore grid, protection systems, metering, control rooms, and market registration. A project is only ready when the chain is ready.

Regulatory stoppage exposure includes formal and practical stoppages. A formal order is easy to count. Practical stoppage may occur when unresolved regulatory questions, environmental commitments, or safety-case deficiencies prevent work even without a headline suspension. The model is expected to classify stoppage by authority, cause, duration, scope, and affected workfront. That granularity helps the project see whether regulatory pressure is episodic or structurally connected to poor compliance preparation.

Vessel and port constraint is not a single market variable. It includes installation vessel availability, lifting capacity, crew availability, port berth readiness, quayside load limits, component storage capacity, customs clearance, towing logistics, and weather-window compatibility. Offshore wind projects can lose time not only because a vessel is unavailable, but because the required vessel, port, component, crew, and weather window do not align. The variable is expected to capture that combined availability.

Financing cost pressure is included because engineering managers need to understand capital context without turning into finance managers. Rising rates can make delay more costly, but the engineering response remains practical: improve schedule credibility, reduce avoidable uncertainty, preserve contingency, and provide accurate progress evidence. Investors and owners are more likely to support recovery plans when project managers can show which risks are active and how they are being controlled.

Governance response maturity can be measured through observable behaviors. How many days pass between risk detection and escalation? Are independent reviewers present at the right gates? Are package-level risks consolidated at project level? Does the steering group receive technical evidence or only traffic-light summaries? Are recovery actions assigned with dates and owners? These questions convert a seemingly soft management variable into a measurable project-control variable.

The model is expected to also include a rule for severe events. Regression outputs can support judgment, but they does not override non-negotiable safety or quality gates. A blade-failure pattern, unresolved high-voltage safety concern, evidence of systemic manufacturing defects, or serious environmental noncompliance is expected to trigger hard review regardless of predicted schedule effect. Engineering management loses integrity when statistical tools become excuses for tolerating unacceptable risk.

Table 1. Offshore wind case evidence and engineering management use

Evidence Verified detail Engineering management use
Dogger Bank 3.6 GW project in three 1.2 GW phases, about 130 km offshore, with HVDC transmission. Scale, phasing, interface control, and learning transfer.
Vineyard Wind 1 July 2024 blade failure led to BSEE restrictions on generation and further construction. Supplier quality, incident response, regulatory stoppage exposure.
Ørsted U.S. portfolio 2024 impairments reflected rates, seabed valuation, construction delay, and higher expected costs. Finance-pressure tracking and execution realism.
NREL 2024 market report The U.S. offshore wind pipeline contains large projects at different stages of maturity. Separate pipeline ambition from deliverable capacity.

Table 2. Regression variables for offshore wind schedule variance intensity

Variable Meaning Engineering measurement
SVI Schedule variance intensity Delay days normalized by capacity and phase exposure.
SLS Supply-chain lead-time strain Variance between planned and actual delivery of major components.
TQI Turbine quality interruption Quality holds, rework, or component stoppage severity.
GRG Grid-readiness gap Misalignment between generation readiness and transmission readiness.
RSE Regulatory stoppage exposure Days under formal or practical authority restriction.
VPC Vessel and port constraint Installation vessel, berth, storage, and mobilization constraint.
FCP Financing cost pressure Change in capital cost or financing exposure affecting delivery pressure.
GRM Governance response maturity Escalation timeliness, decision quality, assurance coverage.

Read also: Engineering Management Metrics That Drive Outcomes

Chapter 4: Case Analysis and Engineering Findings

The public cases make the managerial pattern clear. Offshore wind projects fail or succeed through the quality of their interfaces. Technical packages requires meet at exactly the point where contractual packages, marine operations, grid readiness, and regulatory expectations also meet. When one of those interfaces weakens, the project may still look healthy in percentage-complete reporting while the critical path is already deteriorating. Engineering managers therefore need evidence systems that focus on interface readiness, not only activity completion.

Dogger Bank is a useful starting point because it shows how a project can carry multiple layers of novelty at once. The project’s size is exceptional, its distance from shore is demanding, and the use of HVDC transmission on a UK wind farm adds a major grid-interface dimension. None of these features is inherently unmanageable. The point is that novelty stacks. A project with one new feature can isolate lessons. A project with several new features needs more durable learning loops and more independent assurance because cause and effect become harder to read when problems appear.

The three-phase structure of Dogger Bank offers a governance advantage if the learning system is firm. A phased megaproject can transfer lessons from early installation, commissioning, cable work, marine logistics, and control systems into later phases. That advantage is not automatic. It requires a formal mechanism to capture field learning, assign owners, modify standards, update inspection plans, and change supplier requirements. If lessons are only discussed informally, a later phase may repeat defects that the initial phase already exposed.

Vineyard Wind’s blade failure points to a different governance requirement: component quality belongs as a project-wide risk, not as a factory-side issue. A blade manufactured for offshore service carries high consequence because replacement, inspection, marine access, and public safety are all more difficult after installation. Factory acceptance therefore cannot be a box-checking exercise. Engineering managers need traceability down to critical manufacturing steps, independent inspection authority, non-destructive examination where justified, and an escalation rule that prevents commercial pressure from diluting quality review.

The BSEE order following the Vineyard Wind failure shows that regulatory stoppage exposure can dominate the schedule even when the underlying technical issue is located in one component category. Regulators do not simply ask whether a failed blade can be repaired. They ask whether personnel are safe, whether other installed assets are exposed, whether construction can continue, whether debris and environmental risk are managed, and whether the project’s mitigation plan is credible. An engineering manager requires anticipate this broader regulatory logic before an incident occurs.

Ørsted’s impairment disclosures show that project governance has to integrate financial and construction evidence. Construction delay is not only the result of technical difficulty; it can also be amplified by financing conditions and contract terms. Higher long-dated interest rates can reduce the value of future revenue. Delays can increase financing exposure. Higher expected costs can weaken internal approval confidence. Engineering managers do not set macroeconomic policy, but they provide the delivery evidence that determines whether executives and lenders trust the schedule.

A well-governed offshore wind project is expected to therefore treat the risk register as a live operating tool. The register distinguishes between risks that threaten cost, risks that threaten schedule, risks that threaten safety, risks that threaten technical performance, and risks that threaten public confidence. Some events threaten several categories at once. A turbine blade quality event can affect all five. Those high-coupling risks deserve more durable control than their raw probability may suggest.

Regression analysis helps because it makes the project confront patterns. If schedule variance rises mostly when supply-chain lead times move, the governance response is expected to focus on procurement buffers, supplier expediting, alternative manufacturing slots, and contract incentives. If turbine quality interruption explains most variance, the project needs deeper supplier assurance and manufacturing surveillance. If regulatory stoppage explains variance, then permitting compliance, authority engagement, and incident-response planning become schedule controls rather than legal formalities.

The model also prevents convenient explanations from becoming permanent. Offshore wind teams often blame weather because weather is visible and uncontrollable. Weather does matter. Yet if schedule variance persists across workable weather windows, managers requires look at deeper causes: late drawings, incomplete components, vessel queueing, port congestion, defective parts, grid bottlenecks, or slow decision rights. A regression framework does not allow the team to hide behind one explanation unless the data support it.

The energy-at-risk calculation sharpens the consequences. An 806 MW project delayed by 30 days with an assumed 45 percent capacity factor would defer about 261,144 MWh of electricity. That figure is calculated by multiplying 806 MW by 0.45, by 30 days, and by 24 hours. The number is not a claim about Vineyard Wind’s actual lost generation under any contract condition; it is the engineering translation of delay into energy terms. Project teams performs the same calculation with their approved internal assumptions.

Figure 3. Energy-at-risk sensitivity by project scale and delay duration. Author-developed calculation using stated capacity-factor assumptions. Copyright © June 2026 Cherish Chiemela Okoroji / NYCAR. All rights reserved.

The same logic applies at Dogger Bank scale. A delay on a 1.2 GW phase carries a different energy consequence from a delay on a small pilot project. If a 1.2 GW phase were delayed by 30 days at a 50 percent capacity factor, deferred energy would be 432,000 MWh. A one-month delay becomes visible as a material amount of electricity. That kind of translation can change boardroom behavior. Schedule risk becomes easier to govern when its consequences are no longer hidden behind abstract dates.

The main managerial lesson from these cases is that governance requires arrive early. Once a blade has failed offshore, once a regulatory order has stopped construction, or once financial impairment is announced, the project is already in corrective mode. Firm engineering management invests more heavily in prevention and early detection: supplier qualification, independent audits, interface-readiness reviews, cable and converter-system assurance, installation simulation, spare strategy, port readiness, and formal decision pathways.

Contract strategy also deserves attention. Offshore wind projects rely on suppliers with scarce capacity and specialized knowledge. If contracts push too much risk onto suppliers that cannot realistically absorb it, the project may gain legal protection while losing delivery resilience. If the owner accepts too much risk without verification rights, the project may lose control of quality. Good contract management balances commercial incentives, technical transparency, and early-warning obligations.

The cases also show that public confidence is an engineering management variable. Offshore wind projects are visible from the moment they enter public debate. Coastal communities, labor groups, environmental organizations, regulators, fishing interests, and ratepayers all interpret incidents. A technically competent response can still fail if communication is evasive. Engineering managers is notcome public-relations substitutes, but they requires provide the factual clarity that credible communication requires.

The study’s regression framework is best used as part of a monthly project assurance cycle. Data is best collected from procurement, quality, construction, regulatory, finance, and grid-interface teams. The regression output is best reviewed with qualitative evidence. If the coefficient for vessel constraint rises, the project director asks whether installation campaigns are being over-optimized on paper. If quality interruption rises, the owner is expected to review supplier inspection authority. If governance response maturity is low, the issue may be leadership rather than technology.

A useful reading of Dogger Bank is that scale turns coordination into a technical issue. At small scale, managers can sometimes compensate for weak coordination through personal intervention. At 3.6 GW, with three phases and an HVDC interface, coordination requires embedded in the management system. The project requires know which decisions are repeatable, which are phase-specific, and which are learning opportunities. The size of the project means that even small percentage improvements in execution practice can produce large absolute benefits.

The same case also shows that a project’s operations base is not an afterthought. A long-term operations and maintenance base creates continuity between construction and operations. Engineering managers is expected to involve O&M personnel before final handover because maintainability issues are often created during design and installation. A project that is easy to build but hard to operate has transferred cost rather than created value. Offshore wind assets live in harsh environments; access is expensive, weather-limited, and safety sensitive.

The Vineyard Wind incident reinforces the need to treat quality evidence as a shared asset. Factory data, supplier inspection results, logistics records, installation records, and offshore condition evidence is best integrated. If records are fragmented, root-cause analysis slows. The project may know that a blade failed without quickly understanding whether the issue is isolated, batch-related, transport-related, installation-related, or linked to design assumptions. Time lost in uncertainty can be as damaging as time lost in repair.

Public incidents also reveal whether a project’s governance language is credible. Communities and regulators hear many assurances before construction begins. After an incident, they judge whether the developer’s behavior matches those assurances. Engineering managers contribute to credibility by maintaining clear evidence, plain explanations of what is known, honest separation of knowns from unknowns, and transparent recovery actions. Vague reassurance is not engineering leadership.

Ørsted’s case highlights another governance lesson: a project portfolio is not managed as if every asset has the same risk temperature. Some projects carry higher exposure because of location, contracts, supply-chain maturity, offtake arrangements, local regulation, or novel elements. Portfolio leaders is expected to assign assurance intensity according to risk temperature. A mature European fixed-bottom project and a constrained United States project may not need the same governance rhythm.

Portfolio-level regression can make this possible. If project data are captured consistently, leaders can compare whether delays across several projects are driven mainly by cable procurement, turbine quality, grid readiness, vessels, or financial pressure. Without portfolio analytics, every project tells its own story and lessons are slow to travel. Engineering organizations does not relearn the same supply-chain lesson across multiple projects while treating each delay as unique.

A mature offshore wind owner maintains a lessons-to-controls log. Ordinary lessons-learned reports often become ceremonial documents after milestones. A lessons-to-controls log asks what changed because of the lesson. Did a supplier audit checklist change? Did a contract requirement change? Did inspection coverage increase? Did the schedule model change? Did a regulatory interface plan improve? If nothing changed, the organization has not learned in a management sense.

The cases also show the importance of schedule humility. Offshore wind schedules are vulnerable to the false confidence of decimal precision. A plan may show a turbine installation date, cable pull date, commissioning date, and commercial operation date with impressive detail. The precision can hide fragility if the plan depends on multiple low-probability events all going right. Engineering managers asks not only what the planned date is, but how many assumptions requires hold for that date to remain credible.

Schedule contingency is best tied to risk profile, not negotiated down for commercial appearance. If a project has new turbine technology, constrained vessels, unresolved grid dependencies, complex permitting, and supplier ramp-up, a thin contingency is not ambitious; it is misleading. Good governance protects contingency until evidence justifies its release. The project sponsor may dislike the visible effect on headline schedule, but a realistic schedule is less damaging than a public miss.

One of the under-discussed risks in offshore wind is organizational fatigue. Large projects run for years. Teams face repeated deadlines, weather disruption, regulatory review, stakeholder pressure, and budget scrutiny. Fatigued organizations normalize warning signs because the alternative is another escalation. Engineering managers is expected to monitor decision quality, not only output. Slow responses, recurring unresolved actions, and repeated optimistic forecasts are signs that governance may be losing force.

A project-control model is expected to also distinguish between recoverable and nonrecoverable delay. Recoverable delay can be absorbed through resequencing, added shifts, alternative vessels, parallel work, or accelerated commissioning. Nonrecoverable delay moves the commercial operation date because the critical path has no practical recovery route. Regression outputs are more useful when SVI is broken into recoverable and nonrecoverable components. A supply delay that can be absorbed by float is not weighted like a converter-station delay that blocks energization.

Weather is treated with analytical care. Offshore wind projects cannot control wind, waves, fog, or storms, yet they can plan around historical patterns, seasonal access, and vessel capability. The weather variable is notcome a convenient explanation for all delay. Weather exposure is partly a planning choice because the schedule determines which work occurs in which season. Engineering managers distinguishes uncontrollable extreme events from poor alignment of work packages with predictable seasonal limitations.

Interface control documents is best living instruments. In complex offshore projects, many failures begin at boundaries: turbine-to-foundation, cable-to-substation, offshore-to-onshore transmission, supplier-to-installer, regulator-to-contractor, design-to-field, and construction-to-operations. Interface registers includes technical requirements, responsible parties, open decisions, inspection evidence, schedule dependency, and escalation route. A static interface register becomes obsolete quickly because field decisions change the real project faster than documents are updated.

The model can also support contingency allocation. Instead of holding a generic project contingency, leaders can assign contingency to risk drivers with observable triggers. If supply-chain strain rises above the agreed threshold, a procurement contingency is activated. If quality interruption rises, independent inspection funding is released. If vessel constraint becomes critical, alternative charter options are examined. Contingency becomes governed flexibility rather than a hidden reserve slowly consumed by pressure.

Claims management is not separated from engineering governance. Delays often become disputes over responsibility, notice, compensable events, and entitlement. A project with weak technical records will struggle to defend its position. Engineering managers is expected to ensure that quality holds, regulatory interactions, vessel delays, component conditions, weather events, and interface decisions are recorded with enough detail to support both learning and contractual clarity.

Human safety requires remain central. Offshore wind installation involves lifting heavy components, working at height, vessel transfer, energized systems, and difficult emergency response conditions. A schedule recovery plan that increases safety exposure is not genuine recovery. The regression model can explain schedule pressure, but safety governance requires set boundaries around acceptable response. Managers is expected to never allow deferred energy or revenue exposure to become a reason for unsafe work.

Another practical issue is the handover from construction to commissioning. Many projects treat commissioning as a final stage, but commissioning readiness is governed from the beginning. Documentation completeness, test procedures, spares, control-system access, operator training, grid-code compliance, cybersecurity, and fault-response routines all affect the ability to turn installed assets into operating assets. A turbine installed without a credible commissioning path is not a complete unit of value.

Chapter 5: Managerial Implications and Recommendations

The engineering management implications begin with front-end realism. Offshore wind projects cannot afford optimistic scheduling that treats long-lead components, port upgrades, regulatory review, and grid works as background tasks. The early project schedule is expected to identify the few interfaces most likely to move commercial operation date. Those interfaces is expected to receive independent assurance before procurement and construction commitments become difficult to revise.

A disciplined offshore wind governance system has a stable rhythm. It includes monthly critical-path review, supplier quality review, regulatory issues review, grid-interface review, safety assurance, and executive risk escalation. These meetings does not multiply bureaucracy. They is expected to shorten the distance between evidence and decision. When a supplier quality event appears, the project knows who can stop shipment, who can approve rework, who requires notify the regulator, and who updates the installation schedule.

Regression analysis is best embedded into the project-controls function. The schedule team already tracks earned value, milestones, float, and critical path. The regression layer adds explanatory discipline. It asks which variables are moving schedule variance rather than simply reporting that variance exists. A project may show a negative schedule trend for several months; the governance question is whether the trend is driven by procurement, weather, vessel availability, design change, grid delay, quality holds, or decision latency.

Data quality is essential. A regression model built on weak project data will produce false confidence. The project team is expected to define variables before major construction begins, use consistent coding rules, and record events in a way that survives staff turnover. For example, a quality interruption is not coded differently by every package manager. A regulatory stoppage is best dated and classified. Vessel constraint distinguishes between weather downtime, vessel unavailability, port conflict, and late mobilization.

Supplier assurance requirescome more intrusive where consequence is high. Offshore wind supply chains include components whose failure can stop the project: blades, nacelles, gearboxes, transformers, array cables, export cables, monopiles, jackets, substations, and converter equipment. The owner’s assurance plan is best proportionate to consequence. High-consequence components require supplier-process audits, hold points, manufacturing data review, nonconformance trending, and independent acceptance authority.

Quality governance is expected to avoid the illusion that a pass/fail certificate is enough. A certificate indicates compliance with a defined requirement at a defined point. It does not guarantee that upstream process variation, material handling, storage, transport, or installation damage are controlled. Offshore wind requires chain-of-custody thinking. A blade, cable, or transformer may pass factory inspection and still be damaged through transport, lifting, storage, or offshore handling. The quality system requires extend across the journey.

Regulatory readiness is treated as part of schedule readiness. The project team maintains a live map of required approvals, conditions, reporting obligations, environmental commitments, safety-case evidence, incident-response protocols, and authority interfaces. The map does not sit with legal counsel alone. Package managers, marine coordinators, HSE leaders, and commissioning teams knows which commitments affect their work. When regulatory relationships are only activated during problems, the project has already lost time.

Ports and vessels require separate governance because they are constrained resources. An installation plan that assumes perfect vessel availability and port flow is not a plan; it is a wish. Offshore wind projects performs stress tests against delayed components, vessel breakdown, port congestion, customs issues, and poor weather windows. The stress test is expected to show how many days of float are consumed and which contracts or contingency plans become active.

Grid-interface governance is often underestimated by teams focused on turbines and foundations. Offshore wind does not create system value until generated energy can move through export cables, substations, converter stations, transmission networks, and market systems. A project that installs turbines before grid readiness may create visible progress but limited delivery value. Engineering managers treats grid readiness as a co-equal workstream with turbine installation.

Governance response maturity is the softest variable in the regression, but it may be one of the most important. Mature governance means that bad news moves quickly, decisions are made at the right level, and technical disagreement is not suppressed. In a weak governance environment, risk information may be filtered until it becomes politically safe. By then, options are fewer and more expensive. Engineering leaders is expected to reward early escalation rather than punish it.

The study recommends an offshore wind Project Assurance Board with authority over risk acceptance, major quality deviations, critical-path changes, regulatory holds, and supplier recovery plans. The board includes engineering, construction, HSE, procurement, grid, finance, legal, and independent assurance representation. Its purpose is not to take daily control from the project team. Its purpose is to prevent high-consequence risks from being normalized inside work packages.

Owners maintains an energy-at-risk dashboard. The dashboard is expected to translate delay into deferred MWh and, where appropriate, revenue exposure. This is not a replacement for schedule reporting. It is a bridge between engineering delivery and business consequence. When managers can see the energy cost of delay, they are less likely to treat project-control warnings as technical pessimism.

Lenders and public authorities can also use the framework. Lenders’ technical advisers can ask project developers to report SVI variables monthly. Public authorities can require evidence of supply-chain readiness, quality controls, and regulatory response plans before treating pipeline capacity as credible future supply. The framework can improve public planning by distinguishing projects that have a signed agreement from projects that have a credible execution system.

The recommendations require investment, but the cost of weak governance is higher. Offshore wind is capital intensive, politically visible, and schedule sensitive. A project may save money by reducing assurance visits, shortening supplier audits, or avoiding independent quality review. Those savings disappear quickly if one defect stops offshore work. Engineering management is judged by prevented failure as much as by visible activity.

A practical assurance model includes hold points that cannot be waived at package level. Critical design reviews, factory acceptance tests, marine-readiness reviews, cable load-out approvals, substation energization, blade installation, and initial-power decisions is expected to have formal criteria. The project director may approve certain deviations, but high-consequence deviations is expected to require independent technical review. This protects both the project and the people under delivery pressure.

Figure 4. High-consequence assurance gates for offshore wind delivery. Author-developed engineering-management visualization. Copyright © June 2026 Cherish Chiemela Okoroji / NYCAR. All rights reserved.

Project teams is expected to also use leading indicators, not only lagging indicators. Lagging indicators include delay days, cost growth, nonconformance totals, and lost-time incidents. Leading indicators include supplier audit findings, late engineering deliverables, unresolved interface queries, component-test anomalies, vessel booking uncertainty, and recurring action slippage. Regression analysis is more useful when it includes leading indicators because management can still intervene.

The owner’s engineer role is best strengthened. In offshore wind, developers may depend heavily on EPC contractors, turbine suppliers, marine contractors, and grid parties. Those organizations have expertise, but they also have their own commercial pressures. An owner’s engineer or independent technical adviser provides challenge, verifies evidence, and helps the sponsor avoid becoming dependent on the most optimistic interpretation of the contractor’s report.

Digital project controls can help if they are built around decision-making. Many projects accumulate dashboards that show progress without changing decisions. A useful dashboard is expected to connect work package status to critical path, risk variables, forecast confidence, and decision needs. The project-control team does not simply publish data. It is expected to interpret data for action and record whether action was taken.

Offshore wind projects is expected to also maintain a community-and-regulator evidence pack for high-consequence incidents. This pack includes incident chronology, safety status, environmental status, affected assets, immediate controls, investigation path, external experts involved, and planned updates. The pack is not public spin. It is a disciplined way to prevent confusion, inconsistent statements, and avoidable loss of trust when events move quickly.

A further recommendation concerns supplier development. Offshore wind supply chains are expanding while being asked to deliver larger components under more pressure. Owners is expected to avoid treating suppliers only as transactional vendors. Where the supply base is strategically important, owners and governments may need to invest in qualification, workforce development, port upgrades, manufacturing capacity, and shared quality standards. Project governance cannot fully compensate for an underdeveloped industrial base.

Risk allocation is best reviewed for realism. Contracts that assign risk to the party least able to control it create disputes rather than resilience. A supplier cannot control regulatory delay. A developer cannot directly control factory process variation without access rights. A port cannot absorb indefinite component-storage pressure without capacity. Good contracts align responsibility with control and require early warning where control is shared.

The model developed here can also support public procurement. Auction systems that reward the lowest price without adequate adjustment for inflation, supply-chain pressure, and delivery credibility may create future failure. Public authorities is expected to examine not only bid price but also delivery model, supply-chain readiness, grid plan, technical maturity, and sponsor capability. Cheap projects that do not reach operation are expensive in public-policy terms.

Finally, offshore wind leaders is expected to communicate uncertainty more honestly. Certainty is often used to maintain stakeholder confidence, but false certainty is fragile. A more credible communication style explains what is controlled, what remains uncertain, and what actions are being taken. Mature engineering organizations do not pretend that megaprojects are risk-free. They show that risk is being governed.

The framework can be expanded with Bayesian updating after each major project event. A regression model estimates relationships across data, while Bayesian updating allows managers to revise confidence when new evidence appears. For example, a clean supplier audit may lower the expected risk of quality interruption, but an early nonconformance cluster is expected to raise it. The combination of regression and updating can make the assurance process more responsive without becoming erratic.

The project director is expected to insist on decision records for major risk acceptances. When a team chooses to proceed despite an unresolved risk, the reason is best documented: evidence reviewed, alternatives considered, people consulted, decision owner, and conditions for reopening the decision. This practice protects accountability. It also improves learning because later reviews can distinguish between a reasonable risk that matured badly and a weak decision that ignored evidence.

A final practical discipline is independent red-team review. Before major offshore campaigns, a small team not responsible for delivery is expected to challenge the schedule, logistics plan, quality evidence, emergency response, and interface readiness. The purpose is not to embarrass the project team. It is to surface assumptions that insiders may have normalized. Offshore wind projects are too expensive and too public to rely only on internal confidence.

Insurance is another underused source of project intelligence. Marine insurance, construction all-risk coverage, delay-in-start-up coverage, and warranty arrangements all require evidence about hazards and controls. Insurers often see patterns across projects that individual owners may not see. Engineering managers does not treat insurance review as a back-office requirement. It can provide a disciplined external challenge to lifting plans, vessel exposure, fire risk, cable protection, quality management, and emergency response.

Environmental commitments is expected to also be integrated into project control. Offshore wind projects operate in sensitive marine and coastal environments, and environmental noncompliance can stop work as surely as a failed component. Commitments about marine mammals, fisheries, noise, seabed disturbance, debris, and coastal impacts requires translated into work-package controls. When environmental obligations remain separate from construction planning, the project creates avoidable stoppage exposure.

A final issue is talent. Offshore wind delivery depends on people who understand marine operations, high-voltage systems, turbine technology, offshore safety, quality surveillance, project controls, and regulatory engagement. The supply of such people is not unlimited. Engineering managers includes workforce capability in project-readiness reviews. A plan that assumes experienced people will appear exactly when needed is no more credible than a plan that assumes every vessel will be available on demand.

The sector is expected to also distinguish between speed and pace. Speed is a short burst of movement. Pace is sustainable progress under constraints. Offshore wind projects need pace because they last through long procurement cycles, construction seasons, commissioning phases, and early operations. Governance is expected to keep the organization moving steadily without ignoring evidence that the plan has become unsafe, unrealistic, or poorly controlled.

Chapter 6: Closing Findings and Future Research

Offshore wind megaprojects sit at the point where engineering ambition, public policy, finance, and field execution either reinforce one another or collide. Dogger Bank shows the scale now being attempted in fixed-bottom offshore wind. Vineyard Wind 1 shows how a single component failure can move quickly from factory quality to regulator action, coastal concern, project sequencing, and public confidence. Ørsted’s U.S. disclosures show that construction delay and capital-market pressure can change the strategic value of projects that looked commercially sound on paper. These examples do not produce one simple lesson. They show a sector in which technical decisions, commercial assumptions, regulatory relationships, and public trust are tightly linked.

The main contribution of this study is the translation of that complexity into a project-control framework that an engineering manager can actually use. Schedule Variance Intensity gives delay a more useful meaning than a raw count of days. Supply-chain strain, turbine quality interruption, grid-readiness gap, regulatory stoppage exposure, vessel and port constraint, financing cost pressure, and governance response maturity are treated as measurable drivers rather than loose explanations. That distinction matters. A project cannot improve by saying it is under pressure. It improves when it can identify which pressure is active, where it sits in the critical path, and what decision is needed next.

Regression analysis is valuable here because it disciplines judgment without replacing it. Offshore wind teams will always need experienced marine planners, electrical engineers, project controllers, procurement leaders, HSE professionals, and regulatory specialists. A model does not know the sea state, the politics of a port, or the judgment of a blade inspector. What it can do is force the organization to collect comparable evidence and test whether its preferred explanation is true. If quality interruption is driving delay, the answer is not another general schedule meeting. It is deeper supplier assurance. If grid readiness is the driver, turbine installation progress alone is not success. If governance response maturity is weak, the problem may be leadership rather than technology.

The energy-at-risk calculation strengthens the board-level relevance of schedule governance. Delay is not only a missed date. It is electricity not delivered, revenue not earned, emissions reductions deferred, and public promises postponed. A 30-day delay on a large offshore wind phase can represent hundreds of thousands of megawatt-hours. Translating delay in that way helps executives, lenders, regulators, and project teams see why project controls are not administrative housekeeping. They are part of energy security and investment protection.

The cases also warn against the comfort of smooth reporting. Megaprojects often look orderly until the wrong interface fails. A turbine can be manufactured while the port is not ready. A vessel can be booked while the component is under quality hold. A grid workstream can move on paper while commissioning evidence remains incomplete. A regulator can be formally engaged while the project has not prepared the practical evidence needed after an incident. Offshore wind assurance requires therefore focus on interfaces, not only work-package completion. The question is not whether every team is busy. The question is whether the system is converging toward energization.

A mature owner is expected to build assurance around the few risks that can move the whole project. That means independent review at critical quality gates, live tracking of regulatory obligations, stress testing of vessel and port assumptions, serious treatment of transmission readiness, and decision records for high-consequence risk acceptance. It also means protecting contingency from commercial optimism. Thin contingency may make a bid or public schedule look attractive, but it does not make marine construction easier. Honest schedule planning is not pessimism. It is a professional duty.

The human side of governance is not underestimated. Project teams under pressure can normalize warning signs, filter bad news, and continue reporting recovery scenarios long after evidence has weakened. Firm governance creates a culture in which technical concern moves upward quickly and recovery claims requires supported by facts. That culture is not soft. It is one of the most effective controls available in a sector where weather, vessels, suppliers, and regulators leave little room for late correction.

Future research is expected to estimate the model with multi-project monthly data from developers, lenders, or public authorities. A useful dataset would connect procurement slippage, quality holds, grid-interface readiness, regulatory stoppage, vessel constraint, financing pressure, governance actions, and schedule variance across regions and project phases. Such research could test whether governance response maturity moderates technical risk. It may be that projects with similar supply-chain pressure perform differently because one escalates early, protects contingency, and acts on evidence while another waits until the problem is visible outside the project.

The practical standard for offshore wind is simple, even if delivery is not. Capacity promised on paper requirescome energy delivered to people. That conversion requires engineering managers who can read technical evidence, understand commercial exposure, respect regulatory authority, and speak honestly about uncertainty. Offshore wind does not need louder promises. It needs disciplined governance capable of carrying large engineered systems through volatile markets and difficult physical environments.

Chapter 7: Public Assurance, Market Volatility, and Delivery Credibility

7.1 Why public assurance belongs inside engineering management

Offshore wind is often discussed through targets, auctions, lease areas, and installed megawatts. Those terms matter, but they can make delivery sound smoother than it is. A project reaches public value only when the chain from design to generation survives real conditions: manufacturing tolerance, cable availability, offshore access, grid readiness, environmental commitments, financial pressure, and the local patience of communities that live with disruption long before they receive the promised benefits. Public assurance belongs inside engineering management because the public consequence of delay is not abstract. It appears as deferred clean electricity, postponed emissions reduction, weakened industrial confidence, and a harder argument for the next project.

The public does not see every design review, factory inspection, vessel charter, or grid-interface meeting. It sees milestones and failures. Initial power, a blade incident, a regulatory hold, a cost impairment, or a revised commercial operation date becomes the visible story. A project team may know that the cause is complex, yet public interpretation is less forgiving. If the explanation sounds evasive, the technical problem becomes a trust problem. If the project can explain what happened, what is known, what remains under review, and what control has changed, the same incident can be handled with more credibility. That is not communications polish. It is evidence discipline.

Engineering managers therefore carry a public duty even when they are not public officials. Their reports shape board decisions, lender confidence, regulatory engagement, supplier behavior, and community explanation. A weak risk note buried in a dashboard can become a late crisis. A clear escalation supported by traceable evidence can protect the schedule, the budget, and public confidence at the same time. The distinction matters in offshore wind because many delivery risks are visible only to specialists until they become visible to everyone.

The cases examined in this study show different forms of public assurance pressure. Dogger Bank raises the question of whether scale and phasing can be governed with enough learning discipline. Vineyard Wind 1 raises the question of whether component quality and incident response can retain authority under coastal scrutiny. Ørsted’s U.S. disclosures raise the question of whether market pressure and construction delay can be faced early enough to preserve strategic confidence. None of those questions can be answered by optimism. They require records, thresholds, ownership, and a willingness to revise claims when the facts change.

7.2 From market volatility to project-control judgment

Volatile energy markets do not sit outside the project. They change the meaning of schedule. A delay in a low-rate environment may be painful; the same delay under higher financing costs, tight supply-chain pricing, and pressured procurement can reshape project economics. Offshore wind is especially exposed because the capital is committed early, the components are specialized, and the revenue promise often depends on long-term policy instruments or offtake agreements. The engineering manager does not control macroeconomic conditions, but project-control judgment determines how much avoidable uncertainty is added to those conditions.

Figure 5. Volatility-to-governance response profile for offshore wind project assurance. Author-developed diagnostic visualization. Copyright © June 2026 Cherish Chiemela Okoroji / NYCAR. All rights reserved.

Financing cost pressure is included in the Schedule Variance Intensity model for that reason. It is not a finance department ornament. It captures the fact that the delivery organization operates in a capital environment. Rising rates, revalued seabed leases, supplier inflation, and construction delay can reinforce one another. A late converter station or unresolved foundation supply issue does not remain a technical event if it changes drawdown timing, contingency consumption, lender confidence, or impairment risk. By placing financing cost pressure beside turbine quality, grid readiness, and vessel constraint, the model forces a more honest reading of offshore wind delivery.

Market volatility also tests bid realism. Auction systems and public targets can reward low headline prices before the delivery system has proven that the assumptions are durable. A bid can look competitive because it compresses contingency, assumes smooth grid works, relies on supplier ramp-up, or discounts vessel-market pressure. Those assumptions may be rational at the time, but they require review once procurement begins. Mature governance does not treat the bid model as sacred. It asks which assumptions still hold and which have become risks with named owners.

A useful project-control system connects commercial exposure with physical constraints. If a blade package is late, the question is not only when the blades arrive. The manager has to ask which installation vessel is affected, whether port storage remains available, whether the weather window is still usable, whether financing assumptions depend on the original commissioning date, and whether public milestones require revision. This is the point at which engineering management differs from reporting. Reporting states the delay. Management reads the consequence chain.

7.3 Supplier quality as an assurance problem

Supplier quality in offshore wind has consequences beyond the factory gate. A blade, cable, transformer, foundation, or converter component carries a long chain of exposure from design specification to manufacture, inspection, transport, storage, lifting, installation, commissioning, and operation. The project may have a certificate, but a certificate is not the whole quality story. Offshore wind requires a memory of the component’s journey. Who made it, under which process controls, with which nonconformances, under which transport conditions, with which handling records, and with what evidence before installation?

Vineyard Wind 1 shows why that chain matters. A blade failure offshore cannot be reduced to an isolated technical note. It affects personnel safety, debris management, regulatory confidence, turbine inspection, construction sequencing, public concern, and the credibility of future assurances. The engineering-management issue is not only the failure itself. It is whether the project had enough independent quality surveillance, enough manufacturing traceability, enough escalation clarity, and enough readiness to explain the control response once the failure became public.

Supplier assurance becomes more demanding as turbine platforms grow. Larger components can improve energy capture and reduce the number of units, yet they raise the consequence of a defect. A quality issue in a small standardized component may be contained quickly. A quality issue in a large blade family, export cable section, or high-voltage package can interrupt offshore work, mobilize regulators, consume vessel time, and trigger a review of installed assets. The project’s assurance intensity has to reflect consequence, not only probability.

This is where the regression framework helps. Turbine Quality Interruption, or TQI, is not simply a label for defects. It is a measurable project driver: inspection holds, rework hours, rejected components, field stoppage, batch review, supplier corrective action, and regulator-visible quality concern. Once coded consistently, TQI can show whether delay is being driven by a supplier-quality pattern rather than by weather or generalized complexity. The data do not solve the defect. They stop the organization from misnaming it.

7.4 Grid readiness and the hidden boundary of completion

Offshore wind projects can create a misleading sense of progress when visible construction runs ahead of grid readiness. Turbines may stand, foundations may be installed, and offshore work may look impressive from a milestone chart, but the asset has no public energy value until generated power can pass through the export system, converter or substation equipment, onshore grid connection, protection systems, metering, controls, and market arrangements. Completion is not a photograph of installed steel. Completion is energized capability.

The Grid-Readiness Gap variable addresses that boundary. It measures the misalignment between generation-side readiness and transmission-side readiness. In a large project, misalignment can arise from converter-station delay, export cable defects, onshore works, grid-code requirements, control-system integration, commissioning documentation, or the timing of grid operator acceptance. Because those issues often sit across organizational boundaries, they can disappear into polite coordination language. The model makes the boundary explicit.

Dogger Bank is useful here because its scale and HVDC interface place grid delivery at the center of the management problem. A phased 3.6 GW project cannot be governed only as turbine installation. It requires a disciplined view of converter platforms, export routes, onshore interfaces, control logic, and phase learning. A lesson from one phase carries value only if it changes the assurance controls for the next phase. Without that loop, scale multiplies repetition rather than learning.

Grid readiness also has public meaning. When a project is delayed because the transmission chain is not ready, the community rarely separates turbine-side progress from grid-side limitation. Public authorities counting future capacity need a more rigorous distinction between pipeline, construction, installed assets, energized assets, and reliable operation. The framework developed in this paper supports that distinction. It keeps capacity claims tied to physical delivery rather than announcement language.

7.5 Regulatory exposure and the discipline of known obligations

Regulatory exposure is sometimes treated as an external interruption, but many regulatory delays begin as weak preparation. Offshore wind projects operate within safety, environmental, navigation, fisheries, coastal, labor, and grid obligations. These obligations are not administrative accessories. They define the permission to work. When they are translated poorly into work packages, incident response, environmental controls, or contractor requirements, the project creates stoppage exposure before any authority acts.

Regulatory Stoppage Exposure in the model includes formal orders and practical holds. A formal order is visible and easy to count. A practical hold can be more subtle: unresolved evidence, incomplete environmental documentation, unanswered authority questions, weak safety-case material, or a contractor method statement that cannot support the work. Both forms matter because both can move the critical path. The project team requires a register that distinguishes authority, condition, affected scope, exposure days, evidence owner, and recovery decision.

The Vineyard Wind case shows how quickly regulatory exposure can widen after a technical event. A blade failure led to federal restrictions on generation and additional turbine construction until risk analysis and mitigation measures were addressed. That sequence is not unusual in high-consequence engineering. A regulator is not only asking whether the component can be repaired. The authority asks whether personnel are safe, whether the risk could affect other assets, whether environmental effects are controlled, whether construction can continue without enlarging the hazard, and whether the project’s account of the facts is credible.

Good regulatory governance starts before incident response. It appears in clear commitments, contractor obligations, evidence packs, rehearsed notification routes, and managers who know when an issue crosses the threshold from internal nonconformance to authority engagement. It also appears in candor. An offshore wind project that communicates uncertainty honestly is more credible than one that offers confidence before the evidence is ready.

7.6 A practical delivery-credit test

The research points toward a delivery-credit test for offshore wind. A project earns credibility only when its public delivery claim can be traced to evidence across the few systems capable of stopping it: supplier quality, grid readiness, vessels and ports, regulatory obligations, financing exposure, and governance response. This test is deliberately stricter than milestone reporting. A milestone says an activity happened. Delivery credit asks whether the activity moved the project closer to safe, energized, public value.

The test begins with traceability. A board-level risk entry has to lead back to package evidence: the supplier record, the inspection result, the open interface query, the regulatory condition, the vessel plan, the commissioning dependency, and the named recovery owner. If that chain is missing, the dashboard is not ready to govern the project. It may still be useful for presentation, but it is not a management instrument.

Another part of the test is decision latency. Offshore wind projects lose time when teams know enough to act but wait until the problem is undeniable. The model’s Governance Response Maturity variable is useful because it examines the project’s own conduct. How long does escalation take after a serious nonconformance? How quickly is a regulatory question given an owner? How fast does the schedule team revise a false assumption? How often do recovery actions close on time? These questions expose whether governance is reducing delay or quietly producing it.

A further part of the test is readiness to pause. Projects under pressure often treat every warning as recoverable. A responsible delivery culture knows the conditions under which work stops. Severe quality uncertainty, unresolved high-voltage risk, unsafe lifting conditions, environmental noncompliance, and inadequate emergency readiness are not ordinary schedule variables. They are gates. A regression output can inform the discussion, but it cannot lower the safety threshold.

The final part of the test is learning transfer. Offshore wind organizations often collect lessons after a milestone. Fewer prove what changed because of those lessons. A useful lessons-to-controls system asks whether the supplier audit changed, whether inspection coverage increased, whether the installation sequence was revised, whether interface documents were corrected, whether contract notice practice improved, and whether a later phase now has a better control than an earlier phase. Without that conversion, learning remains ceremonial.

7.7 Contracting, insurance, and the discipline of recoverability

The contract is often treated as the commercial layer of the project, but in offshore wind it becomes part of technical recoverability. A contract that gives the owner no useful inspection rights can leave the project dependent on supplier reassurance at the exact moment when independent evidence is required. A contract that transfers unrealistic risk to a supplier can produce claims rather than recovery. A contract that rewards low visible cost while ignoring interface readiness can create a project that appears efficient until the workfront reaches the sea. Engineering managers do not draft every clause, yet their judgment is needed before commercial language hardens into delivery exposure.

Recoverability is the useful test. When a foundation package slips, can the installation sequence be changed without losing the season? When a blade batch enters review, can the project access manufacturing records, transport history, and nonconformance data quickly? When a cable fault appears, does the project have spares, repair partners, test records, and vessel access? When regulatory evidence is requested, can the team produce a coherent chronology within days rather than weeks? These questions turn contract management into project assurance. They ask whether the agreement gives the project enough evidence and authority to act while options still exist.

Insurance adds another source of discipline. Marine insurers, construction all-risk insurers, warranty providers, and delay-in-start-up underwriters examine risk through a different lens from the project team. Their questions often expose assumptions that insiders have accepted too easily: lifting method, cable protection, port storage, fire risk, vessel transfer, blade handling, emergency response, and weather exposure. A mature owner uses that scrutiny as intelligence, not as paperwork. Insurance review can become an external challenge to the project’s belief that the plan is ready.

Recoverability also belongs in the energy-at-risk calculation. A delay has a different meaning when the recovery route is clear. Thirty days lost to a documentation issue with a realistic catch-up path is not the same as thirty days lost to a high-voltage interface defect with no alternative commissioning route. For that reason, project teams can divide Schedule Variance Intensity into recoverable and nonrecoverable components. The split helps leaders decide whether to protect contingency, activate an alternative supplier, revise public milestones, or change the delivery sequence. It also prevents a familiar failure: reporting delay as if every day can be won back through effort alone.

7.8 Implementation pathway for owners and public authorities

The framework can enter practice through a staged assurance cycle. At the start of procurement, the owner defines the Schedule Variance Intensity variables and gives each one a measurement rule. Supply-chain lead-time strain is measured against baseline and recovery schedules. Turbine quality interruption is graded by severity and critical-path effect. Grid-readiness gap is measured across the full chain from generation assets to transmission acceptance. Regulatory stoppage exposure includes formal orders and practical holds. Vessel and port constraint captures combined availability, not vessel booking alone. Financing cost pressure records the capital context in which delay is being carried. Governance response maturity records how the organization behaves when the evidence worsens.

Once construction begins, the project reviews those variables on a fixed rhythm. The review is not another dashboard ceremony. Each active driver receives an owner, a next decision, and a date by which the decision loses value. If the active driver is supplier quality, the response may include added inspection, batch review, hold-point authority, or acceptance criteria revision. If the active driver is grid readiness, the response belongs at the interface between electrical engineering, transmission parties, commissioning, and commercial operation planning. If the active driver is governance latency, the project director has to repair the decision route itself.

Public authorities can use the same logic without claiming to manage the project for the developer. An authority assessing national capacity plans can ask whether reported pipeline capacity is backed by credible execution evidence. A project with a lease, an auction award, or a public milestone is not the same as a project with tested supply-chain readiness, grid-interface maturity, vessel and port alignment, environmental compliance, and regulator-ready incident protocols. This distinction matters for energy-security planning because promised megawatts can become politically convenient long before they become deliverable.

Lenders and technical advisers can also use the framework during due diligence. Instead of asking only for schedule status, they can ask which SVI variables are active, how the variables are measured, how much energy is at risk under current delay scenarios, and which recovery decisions have already been taken. That line of questioning brings engineering evidence into financial oversight without asking financiers to become turbine specialists. It makes the investment case less dependent on confident narrative and more dependent on governed evidence.

For research purposes, the framework also opens a path for future empirical work. A developer, lender, insurer, or public authority with access to multi-project monthly data could estimate the coefficients rather than treat them as conceptual. The most valuable future study would test whether governance response maturity moderates technical shocks. In practical terms, that means asking whether two projects with similar supplier delay perform differently because one escalates earlier, protects contingency, and converts lessons into controls while the other waits for the problem to become undeniable. That question sits at the heart of offshore wind project assurance.

7.9 Final position

Offshore wind delivery will not be secured by louder targets or more elegant project language. It will be secured by the discipline of reading weak signals early, naming the risk driver accurately, and acting before the consequence chain expands. The cases examined in this publication show the same lesson from different angles. Scale requires learning discipline. Quality failure requires traceable evidence. Market volatility requires honest schedule realism. Regulatory exposure requires preparation, not surprise. Public credibility requires candor before assurance becomes public damage control.

The Schedule Variance Intensity model and energy-at-risk calculation are useful because they move the discussion from impression to structure. They do not claim private data, and they do not pretend to predict the sea. Their purpose is more practical: to help project leaders ask what is moving the schedule, what energy consequence follows, which interface is exposed, and whether the project is acting at the speed required by the risk. That is enough to make the framework professionally valuable.

For engineering managers, the chapter’s closing standard is plain. Capacity promised on paper has no public value until it becomes reliable electricity. Between the promise and the power lies a chain of decisions. Offshore wind governance is the discipline that keeps that chain visible, tested, and honest.

References

Bureau of Safety and Environmental Enforcement. (2024a). BSEE statement on Vineyard Wind offshore incident. https://www.bsee.gov/newsroom/latest-news/statements-and-releases/press-releases/bsee-statement-on-vineyard-wind

Bureau of Safety and Environmental Enforcement. (2024b). BSEE issues new order to Vineyard Wind in continuing investigation. https://www.bsee.gov/newsroom/latest-news/statements-and-releases/press-releases/bsee-issues-new-order-to-vineyard-wind

Chou, J.-S., Liao, P.-C., & Yeh, C.-D. (2021). Risk analysis and management of construction and operations in offshore wind power project. Sustainability, 13(13), 7473. https://doi.org/10.3390/su13137473

Equinor. (2023). World’s largest offshore wind farm Dogger Bank produces power for the first time. https://www.equinor.com/news/202310-dogger-bank

McCoy, A., Musial, W., Hammond, R., Mulas Hernando, D., Duffy, P., Beiter, P., Pérez, P., Baranowski, R., Reber, G., & Spitsen, P. (2024). Offshore wind market report: 2024 edition (NREL/TP-5000-90525). National Renewable Energy Laboratory. https://docs.nrel.gov/docs/fy24osti/90525.pdf

Ørsted. (2025). Ørsted announces impairments relating to US interest rate increases, value of seabed leases, and execution of Sunrise Wind. https://orsted.com/en/company-announcement-list/2025/01/orsted-announces-impairments-relating-to-us-intere-142283101

RenewableUK. (2024). Offshore wind industrial growth plan. https://www.renewableuk.com/media/rqvlqzu0/offshore-wind-industrial-growth-plan.pdf

SSE Renewables. (2026). Dogger Bank Offshore Wind Farm. https://www.sserenewables.com/offshore-wind/projects/dogger-bank/

Yeter, B., Garbatov, Y., Brennan, F., & Kolios, A. (2023). Macroeconomic impact on the risk management of offshore wind farms. Ocean Engineering, 284, Article 115224. https://doi.org/10.1016/j.oceaneng.2023.115224

Zhao, S., Su, X., Li, J., Suo, G., & Meng, X. (2023). Research on wind power project risk management based on structural equation and catastrophe theory. Sustainability, 15(8), 6622. https://doi.org/10.3390/su15086622

Copyright © June 2026 Cherish Chiemela Okoroji. All rights reserved. NYCAR.


The Thinkers’ Review

Affordable Housing Strategy and Urban Equity

Circular Urban Planning and Climate Adaptation

NEW YORK CENTER FOR ADVANCED RESEARCH (NYCAR)

Circular Urban Planning and Climate Adaptation

Copenhagen and Rotterdam as Case Studies in Water-Sensitive Design, Public Space, and Urban Resilience

Master’s Research Publication

Research Publication by Michael C. Agbazuruwaka

Publication No.: NYCAR-TTR-2026-RP010

DOI: https://doi.org/10.5281/zenodo.20357802

June 2026

Peer Review

This research publication has been reviewed under the internal editorial framework of the New York Center for Advanced Research (NYCAR) and The Thinkers’ Review. The review assessed master’s-level coherence, urban-planning source integrity, climate-adaptation relevance, circular-planning reasoning, diagnostic-model suitability, APA 7th alignment, visual evidence presentation, and professional planning value. The work is approved for master’s-level NYCAR institutional publication.


Copyright © June 2026 Michael C. Agbazuruwaka. All rights reserved. Charts, tables, and editorial presentation prepared for this publication.

Abstract

A city discovers the value of climate planning at ground level. Rain finds the dip in a street before it finds the policy page. Heat settles on an exposed block before it appears in a dashboard. A waterfront tells the truth about earlier assumptions when tides, rainfall, property value, public access, and aging infrastructure press against one another. Circular urban planning matters in that setting because it forces planners to treat water, land, public space, materials, vegetation, maintenance, and social exposure as parts of the same public problem.

This study examines Copenhagen and Rotterdam as working cases rather than urban trophies. Copenhagen is read through cloudburst planning: streets, parks, corridors, and open spaces are drawn into the stormwater system when buried drainage alone cannot carry the load. Rotterdam is read through a delta tradition that joins flood governance, water plazas, adaptive waterfronts, port exposure, tidal parks, and the Rotterdam Weatherwise program. Neither city is presented as a template. Their value lies in the professional habits they reveal: map the risk, let public space work harder, place water above and below ground, fund the care of what gets built, and keep social benefit visible after the project photographs have faded.

The research uses a qualitative comparative case design with a small diagnostic model. The model links circular planning maturity to an estimated resilience capacity score, but it is not a flood forecast, municipal ranking, or substitute for engineering evidence. Its purpose is narrower and more useful: it exposes the assumptions behind professional judgment. The scorecard asks whether water-sensitive design, multifunctional public space, flood governance, circular resource use, and social resilience are being judged together instead of praised in isolation.

The argument is plain. Climate adaptation gains credibility only when it changes the city people use: where water is routed, where shade is provided, which districts receive protection, how maintenance is paid for, how public-space investment avoids displacement, and how residents understand the work before the next severe storm. Copenhagen and Rotterdam show that resilience is not produced by engineering alone, and not by language alone. It is built through design, finance, maintenance, public trust, and the ordinary decisions that shape streets, parks, waterfronts, and neighborhoods.

Keywords: circular urban planning; climate adaptation; Copenhagen; Rotterdam; blue-green infrastructure; water-sensitive design; urban resilience; climate justice; public space.

Contents

List of Tables and Figures

Table 1. Comparative case logic for circular climate adaptation.

Table 2. Circular planning maturity scoring logic.

Table 3. Recommendations for climate-adaptive cities.

Table 4. Implementation risks and professional safeguards.

Figure 1. Copenhagen cloudburst plan delivery horizon based on public planning descriptions.

Figure 2. Circular planning maturity scorecard for Copenhagen and Rotterdam.

Figure 3. Blue-green infrastructure benefit mix.

Figure 4. Estimated urban resilience capacity score derived from the conceptual model.

Figure 5. Adaptation intervention portfolio for circular urban planning.

Figure 6. Multifunctional public-space performance scorecard.

Figure 7. Circular urban adaptation cycle.

Chapter 1: Introduction: Climate Adaptation as Urban Duty

1.1 The city as climate infrastructure

Cities carry climate risk in small, practical places: a low carriageway, a blocked gully, an overheated bus stop, a basement flat, a school route that floods after a heavy shower. These places expose the real standard of urban planning. Adaptation is no longer a side discipline reserved for emergency plans and engineering drawings. It belongs inside land use, street design, public health, housing, drainage, tree cover, maintenance, and civic trust. The question is not only how a city survives a rare event. The deeper question is how ordinary space can be made less fragile before the event arrives.

Circular urban planning is useful here because it refuses the old split between infrastructure and public life. A street can move people and direct water. A park can cool a district, hold stormwater, support biodiversity, and still remain a place of play. A waterfront can protect people without becoming a wall against public access. Buildings, materials, vegetation, water, energy, mobility, and maintenance belong to connected flows. That is not a slogan. It is the planning discipline required by heavier rain, hotter summers, rising water, and tight municipal budgets.

Copenhagen and Rotterdam are selected because they show different forms of that discipline. Copenhagen’s cloudburst work emerged from the practical problem of intense rainfall overwhelming conventional drainage. The city’s response has been to make surface space part of stormwater management through parks, cloudburst boulevards, retention streets, and public spaces that can carry or store water. Rotterdam’s case is shaped by delta geography and a long civic memory of water. The city treats water as an organizing condition for port continuity, public space, waterfront redevelopment, and neighborhood adaptation. Neither city offers a perfect template. Both offer serious planning lessons.

The value of the comparison lies in the fact that the two cities do not reduce resilience to a single project type. Copenhagen’s lesson is not simply that parks can hold water. Rotterdam’s lesson is not simply that water plazas are attractive. The larger lesson is that adaptation becomes credible when it enters governance, finance, design standards, maintenance responsibility, public communication, and long-term investment. A city does not become resilient because it publishes a strategy. It becomes resilient when the strategy changes streets, budgets, procurement, land-use decisions, and the lived experience of residents.

A more exact reading of these cases begins with city administration. Adaptation is not carried only by celebrated parks or waterfront projects. It is carried by drainage maintenance, road gradients, procurement clauses, project phasing, public meetings, utility coordination, asset registers, and finance rules. When these routines are weak, a handsome project can lose its purpose. When they work together, climate knowledge becomes municipal habit.

The wider lesson is disciplinary. Planning cannot treat water, heat, mobility, housing, public space, and public health as separate files when residents experience them together. A flooded street may also be a school route, a bus corridor, a market edge, and a place where older residents struggle to move safely. A shaded park may also be a stormwater basin, a cooling refuge, a biodiversity corridor, and a civic meeting ground. Circular planning gives the profession a way to hold these functions together without pretending that every benefit arrives automatically.

1.2 Central argument and research contribution

The argument developed here is that climate-adaptive cities gain durability when circular planning, blue-green infrastructure, multifunctional public space, flood-risk governance, and social inclusion are treated as one design problem. Engineering remains essential. Pipes, pumps, tunnels, barriers, and defenses may still be needed. Their public value increases when they connect with parks, plazas, shade, biodiversity, walking routes, waterfront access, and neighborhood protection.

The contribution is applied. The study reads Copenhagen and Rotterdam as management cases, not only as design examples. It asks how climate risk becomes programs, projects, responsibilities, budgets, and public value. It also brings circular planning into the adaptation discussion. Circularity is often framed through waste, materials, and resource productivity; here it is extended to stormwater, heat, public space, maintenance, and civic resilience. Finally, the study sets out a simple diagnostic model that makes planning assumptions visible without pretending to offer statistical proof.

A master’s research publication in this field avoids two traps. One is technical narrowness: treating adaptation as drainage or flood defense alone. The other is soft resilience language: praising greener cities without asking who maintains them, who benefits, and whether the project works under stress. The position taken here sits between those errors. It respects engineering while judging whether the investment improves daily life, protects exposed residents, reduces heat, supports ecological function, and remains maintainable.

The position taken here is deliberately practical. Future cities will be judged less by the elegance of their climate language than by the quality of repeated decisions: where trees are planted, how water is routed, which neighborhoods receive protection, how maintenance is funded, how residents are involved, and how redevelopment avoids displacement. Copenhagen and Rotterdam matter because they show that climate adaptation can become part of the visible city. That is the standard this study uses.

This practical frame guards against a familiar weakness in climate-adaptation writing: admiration without delivery analysis. International case studies are often described through their visible form, while the conditions that allow them to operate receive less attention. A floodable plaza needs drainage logic, cleaning responsibility, safety standards, design supervision, public explanation, and repair money. A cloudburst boulevard needs traffic coordination, utility planning, emergency access, property-edge review, and long-term care. Adaptation is therefore an institutional test as much as a design test.

For that reason, the study uses Copenhagen and Rotterdam as working cases, not as urban trophies. Their value lies in the questions they make unavoidable for other cities. Who owns the risk map? Which neighborhoods are prioritized first? How are co-benefits counted? What happens after the inauguration photograph? How are poorer households protected from the displacement pressure that can follow attractive resilience investment? These questions keep circular planning grounded in public value.

The comparison also respects scale. Copenhagen and Rotterdam do not offer universal answers. Their wealth, geography, planning law, and institutional depth cannot simply be imported elsewhere. The transferable value lies in habits: making risk spatial, giving public space more than one job, joining visible design to maintenance, and using climate investment to protect residents rather than only property. Those habits can travel, but only when translated through local drainage, settlement form, land tenure, finance, and political accountability.

Chapter 2: Literature and Conceptual Frame

2.1 Blue-green infrastructure and multifunctional urban space

Blue-green infrastructure has become central to contemporary adaptation because it joins water management with vegetation, public space, and ecological repair. Pochodyla, Glinska-Lewczuk, and Jaszczak (2021) describe blue-green infrastructure as a practical tool for water management and place value, especially where cities need to increase retention, permeability, and livability. Przestrzelska, Wartalska, Rosinska, Jurasz, and Kazmierczak (2024) show that blue-green solutions are increasingly used across cities to reduce runoff, cool urban areas, and support resilience. The literature matters because it moves adaptation away from hidden infrastructure alone. It recognizes that climate protection can be visible, social, and ecological.

Multifunctionality is the core planning principle. Urban land is scarce, and climate investment competes with housing, transport, public health, maintenance, and economic development. A single-purpose drainage project may be required in some settings, but a project that manages water, reduces heat, supports walking, improves biodiversity, and creates a usable public place has a more durable civic argument. Copenhagen’s cloudburst parks and streets show this logic. Rotterdam’s water plazas and tidal parks do the same from another geography. The public space does not become less serious because it is beautiful or usable. Its usefulness is part of its climate value.

The literature also warns against design romanticism. Blue-green infrastructure is not self-maintaining. Vegetation can fail, permeable surfaces can clog, basins can become unsafe, and public spaces can lose trust if they are poorly managed. Technical performance depends on soil, hydraulics, drainage capacity, plant selection, cleaning schedules, inspection, community use, and clear ownership. A rain garden in a report is not the same as a rain garden that survives heat, litter, compaction, and budget cuts.

Urban heat strengthens the case for integrated planning. Flooding draws immediate attention because damage is visible, but heat can be more silent and unequal. Residents without shade, cooling spaces, good housing, or health support carry greater risk. A park, street tree, water feature, shaded walking route, or cool public facility can therefore serve as climate infrastructure. When flood and heat adaptation are planned together, cities avoid fragmented investment and build more durable public-health value.

Recent blue-green literature supports this wider view because it treats retention, permeability, vegetation, and place value as connected conditions of livability. Pochodyla, Glinska-Lewczuk, and Jaszczak (2021) emphasize the ability of blue-green infrastructure to renew urban water balance through retention and permeable areas. Przestrzelska, Wartalska, Rosinska, Jurasz, and Kazmierczak (2024) similarly describe blue-green solutions as tools that can support stormwater management and quality of life. These sources matter because they move adaptation beyond pipe capacity and place it inside the visible city.

The same literature also warns professional planners against treating vegetation as decoration. Trees need rooting space, water, protection from construction damage, and maintenance over time. Permeable surfaces need cleaning and correct sub-base design. Rain gardens need a drainage path when they reach capacity. Water plazas need safety, visibility, and public acceptance. If these details are ignored, a project may carry the language of resilience while failing at the moment of stress.

2.2 Circular planning, climate justice, and adaptive governance

Circular city literature widens the adaptation discussion by focusing on flows rather than objects. The Ellen MacArthur Foundation frames circular urban thinking around eliminating waste and pollution, keeping products and materials in use, and regenerating nature. In urban planning, that logic applies not only to materials and waste but also to water, buildings, energy, mobility, soil, vegetation, and public space. Circularity matters because climate risks rarely arrive as isolated problems. Flooding affects transport, housing, business continuity, health, public confidence, and municipal finance. Heat affects public health, labor, mobility, schools, and energy use. A circular city reads these systems together.

The Circular Cities Declaration Report 2024 is useful because it shows European cities moving from circular economy ambition toward concrete actions in procurement, construction, mobility, waste, governance, and urban development. That shift matters for adaptation. A city that designs flood defenses while wasting construction materials or ignoring maintenance has not fully applied circular logic. A city that creates a blue-green corridor but excludes vulnerable residents from benefit has confused environmental appearance with public value. Circular urban planning is therefore evaluated through both resource intelligence and social outcomes.

Climate justice is not an optional chapter added to technical planning. It is part of the performance test. Low-income districts may face weaker drainage, less tree cover, poorer housing, older infrastructure, limited insurance, and less political voice. Adaptation can correct these inequalities, but it can also deepen them. A new resilient waterfront may increase public safety and property value while placing displacement pressure on residents who lived with risk before public money arrived. A city that protects high-value districts while leaving vulnerable neighborhoods exposed has made adaptation a new form of inequality.

Governance connects these ideas to delivery. The IPCC’s assessment of impacts, adaptation, and vulnerability emphasizes that climate risk, vulnerability, and adaptation capacity are linked to social and institutional conditions, not only physical exposure. In practice, city planning departments work with water authorities, health officials, housing agencies, finance departments, emergency managers, community organizations, and private developers. Copenhagen and Rotterdam are persuasive because they make adaptation visible in projects, but their deeper relevance lies in the institutional work behind those projects.

Circular city thinking adds another layer because it asks what happens to materials, energy, water, waste, land, and public value across time. The Ellen MacArthur Foundation (2024) frames cities and regions as important settings for regenerative planning, while the Circular Cities Declaration Report 2024 documents how European cities are moving from general circular ambition toward practical actions in procurement, construction, waste, and urban systems (Circular Cities Declaration, 2024). For climate adaptation, the relevance is direct. A flood project built with wasteful materials, short design life, or no reuse logic has solved one problem while neglecting another.

The Intergovernmental Panel on Climate Change makes the governance point even sharper: climate risk is shaped by hazard, exposure, vulnerability, and adaptive capacity (IPCC, 2022). Urban planning affects each of those elements. It cannot stop heavy rain or sea-level rise by itself, but it can influence where people build, how water moves, which districts receive protection, how quickly services recover, and whether poorer residents are included in public investment. Resilience therefore depends on more than climate data. It depends on the capacity of institutions to act on that data with fairness and discipline.


Chapter 3: Methodology and Analytical Design

3.1 Comparative case design

This study uses a qualitative-dominant comparative case design supported by a transparent diagnostic model. Copenhagen and Rotterdam were selected because each city has a recognized planning record in climate adaptation, water-sensitive design, and public-space innovation. The selection is not meant to declare either city superior. The value lies in comparison. Copenhagen allows close attention to cloudburst planning and the redesign of surface space for intense rainfall. Rotterdam allows close attention to delta governance, water plazas, port adaptation, waterfront design, and climate resilience as a civic culture.

The evidence base remains public and traceable. It includes city climate-adaptation plans, resilience strategies, public planning descriptions, institutional case documents, port adaptation material, circular city reports, and recent scholarly literature on blue-green infrastructure, water squares, circular cities, and urban climate adaptation. It does not rely on confidential municipal records, private interviews, or unpublished engineering data. This limitation is not a weakness if it is handled honestly. Public evidence is suitable for a master’s research publication that examines planning logic, comparative lessons, and institutional meaning.

The cases are read through five planning questions. First, how does the city understand climate risk? Second, how does it use public space as part of adaptation? Third, how does governance convert strategy into projects? Fourth, how does the city link technical protection with social value? Fifth, what does the case teach other cities that cannot copy the project directly but can learn from the planning logic? These questions prevent the study from becoming a simple description of attractive urban projects.

Comparative case study also requires restraint. Copenhagen and Rotterdam operate within wealthy European contexts, high planning traditions, and institutional capacities that many cities do not share. Their examples cannot be transferred mechanically to cities with weaker budgets, informal settlements, limited drainage records, or more severe governance fragmentation. The proper lesson is not imitation. It is translation. Cities can adapt the principles of surface-water routing, multifunctional space, maintenance planning, public participation, and risk-based investment to their own conditions.

3.2 Evidence discipline and source use

The source base is deliberately transparent. Copenhagen is read through the city’s formal climate-adaptation and cloudburst planning documents, public case descriptions of the cloudburst program, and scholarship on financing urban adaptation (City of Copenhagen, 2011, 2012; INTERLACE Hub, 2023; Whittaker & Jespersen, 2022). Rotterdam is read through city strategy material, the Rotterdam Weatherwise framework, port-adaptation sources, C40 case evidence, and research on water squares and city-to-city learning (C40 Cities, 2023; European Environment Agency, 2024; Ilgen et al., 2019; Port of Rotterdam Authority, 2025; Resilient Rotterdam, 2022; Rotterdam Weatherwise, 2023). Broader interpretation draws on circular city and urban resilience evidence, including UN-Habitat’s global urban framing and Resilient Cities Network material on water-secure futures (Resilient Cities Network, 2020; UN-Habitat, 2022).

Those sources are treated as evidence of planning direction, not proof that every project has performed perfectly. Official strategies can overstate coherence. Case-study descriptions can emphasize success. Academic articles may focus on selected examples rather than the entire municipal system. A responsible master’s paper therefore reads across sources, separates observed project logic from official aspiration, and avoids turning public claims into unsupported measurement. This is why the figures are labeled as author-developed diagnostic tools rather than official city ratings.

3.3 Conceptual model and evidence limits

The quantitative element remains deliberately simple. The model is expressed as RCI_i = 25 + 50(CPM_i/10) + ε_i. RCI_i is a conceptual resilience capacity index for city i. CPM_i is the circular planning maturity score on a 0-10 scale, calculated from five dimensions: water-sensitive design, multifunctional public space, flood governance, circular resource use, and social resilience. Dividing CPM_i by 10 converts the score into a normalized 0-1 planning value. The error term, ε_i, represents the real conditions that documentary evidence cannot fully measure: event severity, funding gaps, political change, maintenance failure, inequality, construction quality, and unexpected infrastructure stress. The model does not forecast flood performance. It states the planning assumption that more durable circular maturity is expected to support more durable resilience, while still leaving room for uncertainty.

For applied interpretation, a city with a CPM score of 8.4 produces RCI_i = 25 + 50(8.4/10), or 67 before the uncertainty term is considered. Copenhagen and Rotterdam both receive high diagnostic scores because their adaptation work links water design, public space, governance, circular flows, and social resilience. The figure is not an official rating and is not to be used as a city ranking. It is an author-developed planning estimate derived from the evidence discussed in the case analysis.

The value of the model lies in its clarity. A claim that circular planning improves resilience has little meaning until the study states what maturity includes. Here it refers to five dimensions: water-sensitive design, multifunctional public space, flood governance, circular resource use, and social resilience. A city may perform well in one dimension and poorly in another. The model makes that unevenness visible.

The model also keeps a hard truth in view: adaptation has limits. Even a mature city can be damaged by an event beyond design assumptions. A city may have high projects but weak maintenance. Political leadership may change. Climate projections may shift. Neighborhood inequality may weaken trust. The error term is therefore not a mathematical decoration. It represents real uncertainty. Good planning reduces risk; it does not abolish it.

The scoring method is therefore treated with caution. It gives a planning language for comparison, not a certificate of performance. A mature city may still fail if maintenance collapses, if a severe event exceeds design assumptions, if poorer districts are left exposed, or if political attention moves elsewhere after the first round of investment. The model is useful because it keeps those uncertainties visible. It invites the reader to ask why a score is high, where the evidence is most useful, and which part of the system still needs professional scrutiny.

The mathematical expression also has a communication purpose. Planning audiences often need a plain way to discuss a complex relationship without pretending that the city is a laboratory. The model says that higher circular planning maturity is expected to raise adaptive capacity, while the final outcome remains affected by uncertainty. The expression RCIᵢ = 25 + 50(CPMᵢ/10) + εᵢ keeps the relationship readable and avoids false precision.

A further validity issue is scoring judgment. The five maturity dimensions used in the scorecard are drawn from the case logic: water-sensitive design, multifunctional public space, flood governance, circular flows, and social resilience. Each dimension is scored from zero to ten for comparative discussion. The scores are not city rankings. They are structured interpretations that help the reader see why both cases are considered mature, why Rotterdam scores slightly higher in flood governance, and why Copenhagen scores clearly in multifunctional public space.

Table 1. Comparative case logic for circular climate adaptation.

Dimension Copenhagen Rotterdam Planning meaning
Primary risk emphasis Cloudburst rainfall and surface-water management Delta exposure, flood protection, waterfront adaptation, and port continuity Climate adaptation fits local risk.
Spatial strategy Streets, parks, squares, and blue-green corridors Water plazas, adaptive waterfronts, tidal parks, and layered flood planning Public space becomes climate infrastructure.
Governance lesson Long-term citywide delivery program Water culture, port coordination, and multi-layered resilience planning Adaptation needs institutions as much as design.
Social concern Neighborhood benefit, public value, and maintenance equity Inclusion around improved waterfronts and adaptive districts Resilience avoids becoming a luxury benefit.


Chapter 4: Copenhagen Case Analysis

4.1 Cloudburst planning as spatial intelligence

Copenhagen’s adaptation story is shaped by the experience of intense rainfall and the limits of conventional drainage. The 2011 cloudburst created a practical and political moment in which the city faced the cost of severe urban flooding. The Climate Adaptation Plan and the Cloudburst Management Plan moved the city toward a combined approach in which underground systems, surface routing, parks, streets, and open spaces work together. Public descriptions identify about 300 projects over a 20-year horizon, showing that the program is not a single demonstration project but a long municipal delivery sequence.

The key planning insight is that heavy rainfall is spatial. Water follows slope, curb, surface, barrier, soil, and capacity. When rain falls faster than pipes can take it away, the city surface becomes part of the system whether planners acknowledge it or not. Copenhagen’s more intelligent response is to design that surface deliberately. Streets can guide water. Parks can hold it. Squares can store it temporarily. Corridors can move it away from places where it would do greater harm.

Copenhagen’s case reaches beyond a narrow engineering example. The city did not simply expand pipes and hide the problem underground. It used cloudburst planning to renew streets and public spaces while reducing flood risk. That approach creates political and social value because residents can see benefits between storms. A green corridor, safer street, improved square, or redesigned park earns daily support in a way that a buried pipe rarely can. The hidden system remains important; the visible system builds public understanding.

Copenhagen’s delivery horizon also teaches patience. Long programs require finance, sequencing, legal coordination, utility cooperation, construction management, and public communication. A project pipeline spread across two decades will face political turnover, cost pressures, neighborhood disruption, and changing technical knowledge. The planning achievement is therefore not only the design of individual projects. It is the ability to keep a long adaptation program coherent over time.

Financing is central to that patience. Copenhagen’s cloudburst response is often discussed as a design story, but the financial lesson is equally important. Whittaker and Jespersen (2022) show that adaptation finance in Copenhagen involves institutional negotiation, not simply technical agreement. A city may know what belongs and still struggle with who pays, when the work is sequenced, and how benefits are justified. For planners, that is a serious lesson. A project that cannot survive the budget process will remain a drawing.

The city’s reported ambition to deliver about 300 projects over a 20-year horizon also changes the meaning of leadership. A short pilot can depend on a small group of champions. A two-decade program requires durable standards, political continuity, staff memory, and public explanation. Residents will experience construction, disruption, and changing street functions long before every benefit becomes visible. Good planning leadership makes prevention understandable. It explains why a street is being rebuilt before the next flood proves the need.

Copenhagen also shows that surface solutions require careful technical humility. Sending water along streets and corridors can reduce damage only if flows are modeled, safe routes are identified, and vulnerable edges are protected. A cloudburst route that pushes water toward a basement, clinic, low-income housing block, or transit entrance has simply transferred risk. Spatial intelligence therefore requires engineering evidence, design care, and neighborhood knowledge at the same time.

4.2 Public-space co-benefits and implementation risks

The public-space value of Copenhagen’s adaptation work lies in co-benefits. A cloudburst street can manage water while improving walking comfort. A park can store stormwater while offering recreation, shade, habitat, and neighborhood identity. A green corridor can connect ecological and social functions. These co-benefits matter because climate adaptation requires public money and public patience. If residents experience only disruption, support weakens. If residents experience safer, greener, more useful places, adaptation becomes easier to defend.

Design quality is part of risk reduction. Poorly designed adaptation can look technical, alien, or unsafe. A basin that feels like leftover infrastructure may not be loved or cared for. A public space that works hydrologically but fails socially will still be incomplete. Copenhagen’s lesson is that climate infrastructure can be designed as civic space: legible enough for residents to understand, attractive enough for them to value, and practical enough to perform under stress.

The case also shows the importance of prioritization. The Cloudburst Management Plan ranks initiatives by risk, implementation ease, connection to urban development, and related policy opportunities. This is practical governance. A city cannot build everything at once. It decides where harm is likely, where intervention is possible, where other investments can be joined, and where public value can be highest. The quality of adaptation therefore depends not only on what is designed, but on where and when it is delivered.

Copenhagen’s limits need to remain visible. A celebrated adaptation program can still face questions of maintenance, affordability, neighborhood equity, and long-term performance. Projects have to be cleaned, planted, repaired, monitored, and explained. The social geography of benefit also requires review, so resilient public space does not concentrate only where political visibility or property value is highest. These cautions do not weaken the case. They make it more honest.

The transfer lesson from Copenhagen is not the physical form of any single project. It is the decision to treat streets and parks as part of a wider water system. Cities with fewer resources can still learn from that logic. They may begin with priority flood corridors, small public-space retrofits, schoolyard storage, open drains redesigned with safety and dignity, or maintenance rules that keep water paths clear. The principle can travel even when the budget cannot.

A further transfer lesson concerns sequencing. Cities often lose time by waiting for a perfect comprehensive program before acting. Copenhagen shows the opposite discipline: a long horizon can still be broken into legible projects, priority corridors, public-space renewals, and technical packages. The important point is that each smaller project belongs to a wider risk map. Without that link, scattered interventions may look progressive while leaving the city’s most serious exposure unchanged.

Copenhagen’s case also demonstrates why monitoring continues after construction. Public-space adaptation is tested during ordinary use and during severe rainfall. Does the space drain as expected? Are residents comfortable using it? Has vegetation survived? Are maintenance crews funded and trained? Has risk moved elsewhere? These questions decide whether the project remains infrastructure or becomes only a symbol.

Figure 1. Copenhagen cloudburst plan delivery horizon based on public planning descriptions. Copyright © June 2026 Michael C. Agbazuruwaka.

Chapter 5: Rotterdam Case Analysis

5.1 Living with water as planning culture

Rotterdam’s adaptation case begins from a different condition. The city sits in a delta environment where water is not an occasional inconvenience but a permanent planning fact. River, sea, rainfall, groundwater, port infrastructure, and low-lying urban land create a layered risk setting. Rotterdam’s planning culture has therefore been shaped by protection, accommodation, economic continuity, and civic identity. It does not treat water as a problem that can be expelled once and for all. It treats water as a condition for continuous negotiation.

The Rotterdam Climate Change Adaptation Strategy, the Resilient Rotterdam Strategy 2022-2027, the Rotterdam Weatherwise framework, and port adaptation material all show a city that links climate risk with governance and public life. The city’s resilience language is broad, connecting climate, health, inequality, biodiversity, natural resources, pollution, economy, and digital risk. That breadth is important because climate pressure rarely respects departmental boundaries. Flooding can affect mobility, housing, port activity, emergency services, and public confidence. Heat can affect health, productivity, and social inequality. Adaptation cannot be a single-office responsibility.

The port adds a distinctive dimension. Rotterdam is not only a residential and civic city; it is also a major economic gateway. Port adaptation protects business continuity, transport flows, workers, energy systems, and regional supply chains. European Environment Agency case material on the port emphasizes prevention, adaptation-driven spatial planning, and crisis-management approaches. This layered view is useful for cities with critical infrastructure. A waterfront city asks not only how to protect homes and public space, but how to keep essential systems functioning under stress.

Rotterdam’s most useful lesson is cultural as much as technical. The city has built a public language around water adaptation. Water plazas, roofs, waterfronts, tidal parks, and risk communication create visible symbols of the adaptation agenda. That visibility matters because residents need to understand why public space is being redesigned and why investment is needed before disaster arrives. A city that hides adaptation entirely inside technical departments may struggle to build public trust.

C40’s account of Rotterdam’s adaptation strategy describes a layered approach shaped by flood defense, sea-level exposure, inner-dyke and outer-dyke conditions, and tailored spatial responses (C40 Cities, 2023). That layered language is important because it avoids a false choice between hard protection and adaptive urbanism. Rotterdam still needs serious flood defense. At the same time, the city uses public space, building adaptation, waterfront planning, and civic communication to manage water within the urban fabric.

The Port of Rotterdam adds scale and economic consequence. Climate-ADAPT describes the port adaptation strategy as a menu of measures developed to limit flood-related economic damage in a complex port environment (European Environment Agency, 2024). The Port of Rotterdam Authority also notes that port areas lie largely outside the dykes and require strategies for higher water levels (Port of Rotterdam Authority, 2025). For a planning paper, this matters because port resilience is not only about protecting land. It is about business continuity, transport links, workers, supply chains, energy systems, and national economic exposure.

5.2 Water plazas, tidal parks, and adaptive waterfronts

Rotterdam’s water plazas are among the clearest examples of multifunctional adaptation. Benthemplein is widely discussed because it combines everyday public use with temporary stormwater storage. Under ordinary conditions, the space serves social and recreational functions. During heavy rainfall, it can hold water and reduce pressure on drainage systems. This is circular urban planning in a direct form: the same urban land serves different functions at different times.

The significance of the water plaza is not only its form. It changes public understanding. Water storage that is buried underground is technically useful, but residents may not see its value. A water plaza makes adaptation visible. It shows that public space can be part of the infrastructure system. It also brings funding logics together because water-management budgets can support the creation of better civic space. That combined value is essential for cities with limited land and competing public needs.

Rotterdam’s tidal parks and adaptive waterfronts add another layer. Projects such as the Keilehaven tidal park show how former industrial edges can become spaces for ecological function, public access, and climate awareness. They do not remove water from the city’s identity. They create a more intelligent relation between water movement and urban life. This is especially important for waterfront redevelopment, where resilience can easily become a premium amenity if inclusion is not protected.

Rotterdam also requires caution. Adaptive waterfronts may raise property values and attract investment. Those outcomes can help a city, but they can also create displacement pressure or unequal access. A water-sensitive district cannot be judged by design images or tourism appeal. It is judged by who receives protection, who gains access, who pays, who is pushed out, and whether care remains funded after the opening.

The Rotterdam case shows why adaptation language needs discipline around real-estate development. Water-sensitive design can improve safety and dignity; it can also become a branding device for expensive districts. A serious planning system holds both truths at once. It welcomes good waterfront design while asking whether public access is secure, whether existing communities remain in place, whether small businesses can stay, and whether climate performance is measured after completion rather than assumed from appearance.

Research on Rotterdam’s water squares gives the case a useful empirical texture. Ilgen, Sengers, and Wardekker (2019) examine water squares as part of urban resilience learning, showing that such projects can travel as ideas while still requiring local adaptation. The lesson is not that every city needs the same plaza. It is that visible storage can change professional and public imagination. Residents can see that a square may be dry and social most of the time, then become part of the drainage system during heavy rain.

Rotterdam Weatherwise extends that imagination into a broader program. Its 2030 framework emphasizes upscaling and broadening climate-adaptive action across the city (Rotterdam Weatherwise, 2023). The importance of such a framework lies in repetition. A city does not become resilient through one celebrated project. It becomes resilient when similar principles appear in redevelopment, street renewal, public space, housing, waterfronts, schools, and maintenance standards. Rotterdam is useful because it shows adaptation moving from isolated demonstration toward city practice.

Chapter 6: Comparative Findings

6.1 Shared principles and different emphases

Copenhagen and Rotterdam share one practical principle: water becomes a visible planning matter. Both cities use public space as part of climate infrastructure. Both accept that conventional drainage and flood defense remain important but insufficient on their own. Both connect adaptation to urban quality rather than treating it as emergency engineering only. Both depend on long-term governance because projects require finance, delivery, maintenance, and explanation across many years.

Their emphases differ because their risks differ. Copenhagen’s case is shaped by cloudburst rainfall and the problem of intense surface water arriving faster than conventional systems can manage. Its planning response concentrates on routes, retention, parks, streets, and surface infrastructure that reduce flood damage while improving the city. Rotterdam’s case is shaped by delta exposure, sea-level pressure, rainfall, port continuity, and a long institutional relationship with water. Its response includes water plazas, tidal parks, waterfront adaptation, port strategies, and broad resilience governance.

The comparison shows that adaptation fits local risk. A city cannot import Copenhagen’s cloudburst streets or Rotterdam’s water plazas as objects. It examines its own slopes, rainfall, housing, social vulnerability, maintenance capacity, land values, drainage records, and governance structure. The transferable lesson is behavior rather than form: read the risk, use public space intelligently, coordinate agencies, fund maintenance, protect exposed residents, and measure performance.

Both cases also demonstrate that adaptation becomes credible when it leaves the strategy document. Public plans are necessary, but they are not enough. The real test is whether streets, parks, waterfronts, capital budgets, procurement rules, and maintenance routines change. Copenhagen and Rotterdam matter because their adaptation work has become physical and visible. That visibility gives researchers material to assess and gives residents evidence that planning is not only language.

6.2 Circular maturity and resilience interpretation

The circular planning maturity profile used in this study scores the two cities across water-sensitive design, multifunctional public space, flood governance, circular flows, and social resilience. Copenhagen scores clearly in water design and public-space adaptation because the cloudburst program makes streets, parks, and squares part of stormwater management. Rotterdam scores clearly in flood governance because of its delta tradition, port adaptation, and wider resilience framework. Both cities are high in circular flows and social resilience, though both still need continued attention to equity, affordability, and long-term participation.

The conceptual model gives both cities a resilience-capacity estimate of 67 using RCI_i = 25 + 50(CPM_i/10) + ε_i, with circular planning maturity at 8.4. The equal result does not mean the cities are identical. It means the model reads both as mature cases, but for different reasons. Copenhagen’s maturity is clearly visible in cloudburst surface design. Rotterdam’s maturity is clearly visible in water culture and layered governance. This difference is more useful than a winner-and-loser comparison.

The score needs careful reading. It is not official. It does not measure actual flood depth reduction, avoided damages, heat mortality, biodiversity gain, or displacement risk. Those outcomes require city-specific data and long-term monitoring. The score is a teaching and planning device. It helps a reader see how circular planning maturity may influence resilience while still leaving room for uncertainty.

The comparative finding is simple but important: circular planning raises the quality of adaptation when it converts water, public space, materials, maintenance, and social equity into one planning conversation. Cities that keep these issues in separate boxes will miss co-benefits and may increase inequality. Cities that connect them can turn climate spending into public value.

The comparison also clarifies the difference between resilience as image and resilience as capacity. Image is easy to produce. A city can photograph a water plaza, a green corridor, or a waterfront park and present it as evidence of progress. Capacity is harder. It requires a line of responsibility from climate analysis to project selection, design, construction, public communication, use, maintenance, and learning. Copenhagen and Rotterdam are most useful where that line is visible. Their weaker points, like any city’s, appear where public-space improvement may outrun affordability, or where long delivery timelines test civic patience.

Another comparative lesson concerns scale. Copenhagen’s case is particularly persuasive at the scale of the street network and surface-water route. Rotterdam’s case is particularly persuasive at the scale of delta culture, waterfront adaptation, and port exposure. Together they show that adaptation works across nested scales. A city needs the curb and the catchment, the plaza and the port, the park and the policy, the neighborhood meeting and the capital budget. Circular urban planning becomes valuable because it helps these scales speak to one another.

Table 2. Circular planning maturity scoring logic.

Dimension Copenhagen score Rotterdam score Reasoning
Water-sensitive design 9 9 Both cities treat water as a spatial planning condition, not only a drainage issue.
Multifunctional public space 9 8 Copenhagen’s cloudburst spaces are highly visible; Rotterdam’s water plazas and parks also perform well.
Flood governance 8 9 Rotterdam has a deeply established delta and port-resilience tradition.
Circular flows 8 8 Both cases connect water, space, ecology, materials, and public value.
Social resilience 8 8 Both require continued attention to inclusion, affordability, and participation.


Figure 2. Circular planning maturity scorecard for Copenhagen and Rotterdam. Copyright © June 2026 Michael C. Agbazuruwaka.

Chapter 7: Climate Justice, Public Space, and Civic Value

7.1 Adaptation as a justice question

Climate adaptation is often introduced through physical exposure, but vulnerability is also social. A district may flood because of topography and drainage, yet the damage suffered by residents depends on housing quality, income, insurance, mobility, health, local services, and political voice. Heat risk follows the same pattern. Lack of tree cover, poor housing insulation, limited cooling spaces, and health vulnerability can make heat a serious public-health threat. A circular climate-adaptive city therefore treats equity as part of infrastructure performance.

Copenhagen and Rotterdam offer attractive public-space examples, but the justice test asks a harder question: who benefits? A park that stores water and cools the neighborhood can be a public good. It can also become part of a place-branding strategy that raises rents and displaces residents. A waterfront that protects against flooding can improve safety. It can also concentrate investment in already valuable districts. These tensions are not reasons to avoid adaptation. They are reasons to design anti-displacement safeguards, public access, community participation, and vulnerability-based investment from the beginning.

Public participation cannot be reduced to consultation after decisions have already been made. Residents know where water gathers, which routes fail, where heat is felt, which spaces are unsafe, and which projects might disrupt daily life. This knowledge is not a substitute for engineering, but it corrects technical blind spots. The best adaptation planning joins hydraulic modeling, climate data, maintenance knowledge, and local experience.

Climate justice also requires attention to maintenance. Wealthier districts may be better able to defend, report, and secure upkeep for improved public spaces. Vulnerable districts may receive projects that later deteriorate because maintenance budgets are weak. Equity therefore cannot end at project selection. It continues through funding, cleaning, planting, repair, monitoring, and public accountability.

7.2 Public-space value as resilience

Public space is one of the most powerful adaptation assets because it is shared. Streets, parks, squares, schoolyards, waterfronts, and green corridors shape how residents experience climate risk. They also shape whether residents see adaptation as a public benefit or a technical burden. A well-designed adaptation project can reduce flood risk, provide shade, support biodiversity, improve walking comfort, and create a place people value. That combination makes the city safer and more livable.

Copenhagen’s cloudburst spaces and Rotterdam’s water plazas show that the public field can be engineered without becoming hostile. The point matters because climate infrastructure that feels alien may meet resistance or neglect. Residents are more likely to defend places they use and understand. Civic attachment is not decorative. It can protect long-term performance by creating pressure for maintenance and care.

Schools, clinics, bus stops, markets, and public housing areas deserve particular attention. Climate risk affects the daily systems that people depend on. A flooded route to a clinic, an overheated schoolyard, or an inaccessible bus stop can turn a weather event into a social crisis. Adaptation planning therefore maps not only assets and hazards, but daily dependency. Which places continue functioning during stress? Which groups are most exposed if they fail? Which routes need protection first?

Schoolyards are especially important because they concentrate daily use, vulnerable users, and public land. A schoolyard that is redesigned for shade, safe drainage, play, and temporary storage can serve children during normal days and protect the surrounding area during heavy rainfall. The same logic applies to clinics and health centers. Heat, flooding, and access interruption can turn a facility into a weak point during climate stress. Planning for resilience therefore includes the small civic spaces that determine whether daily life can continue.

Climate justice also requires attention to time. Some benefits arrive immediately: shade, walking comfort, play space, cleaner public areas. Other benefits appear only during a severe event, when the drainage route, storage basin, or floodable plaza is tested. Communities asked to tolerate disruption need to understand both timeframes. Without clear communication, adaptation may look like construction inconvenience for benefits that are hard to see. Trust grows when residents can see how a project serves them before and during climate stress.

Affordability remains a serious concern around attractive adaptation projects. Waterfront upgrades, green corridors, and climate parks can raise land values. That may expand municipal revenue and attract investment, but it may also displace renters, small businesses, and lower-income households. A just adaptation strategy therefore requires coordination with housing policy, tenancy protection, public land rules, and anti-displacement measures. Resilience cannot become a premium product available only to those who can afford the improved district.

Public-space value also includes dignity. A climate park cannot look like a leftover basin. A floodable square cannot signal neglect. Residents cannot feel that their neighborhood received a cheaper or uglier version of adaptation. Beauty, usability, and care are part of justice because public infrastructure tells residents how the city values them.

Figure 3. Blue-green infrastructure benefit mix. Copyright © June 2026 Michael C. Agbazuruwaka.

Figure 6. Multifunctional public-space performance scorecard. Copyright © June 2026 Michael C. Agbazuruwaka.

Chapter 8: Governance, Finance, and Maintenance

8.1 From policy language to delivery discipline

Many cities have climate plans. Fewer have delivery discipline. The difference lies in governance. An adaptation program requires clear ownership, risk maps, design standards, procurement rules, funding streams, maintenance budgets, monitoring indicators, and communication routines. It also requires coordination across departments that often work separately: water, roads, parks, housing, health, finance, emergency management, environment, and planning. Where these systems remain fragmented, adaptation becomes a collection of isolated projects.

Copenhagen’s cloudburst delivery horizon shows the importance of sequencing. A twenty-year program cannot depend on enthusiasm alone. It needs annual prioritization, capital planning, utility coordination, public explanation, and technical review. Rotterdam’s resilience and Weatherwise frameworks show a similar need for cross-sector governance. In both cities, adaptation is not simply designed; it is administered. That administrative capacity is less visible than the projects, but it is what allows the projects to continue.

Finance is the hard test of adaptation seriousness. Cities often support resilience in principle but hesitate when projects compete with immediate political demands. Circular planning helps by making co-benefits visible. A drainage upgrade may be expensive if counted only as flood protection. The same investment may appear more justified when it also improves public space, reduces heat, supports biodiversity, protects mobility, and avoids future damage. The broader the value account, the more durable the case for investment.

Procurement also matters. A city that wants multifunctional adaptation cannot procure every project through narrow technical specifications. Tender documents, design briefs, contractor requirements, material standards, and evaluation criteria have to reward water-sensitive design, durability, circular materials, maintenance feasibility, and social benefit. Otherwise, the ambition of the policy will be lost in the mechanics of delivery.

8.2 Maintenance as climate governance

Maintenance is one of the most underestimated parts of adaptation. It rarely attracts the same attention as design competitions or project launches, yet it determines whether the project continues to work. A clogged drain, compacted soil, dead tree, broken surface, unsafe plaza, or poorly cleaned basin can turn climate infrastructure into an embarrassment. Maintenance is not a secondary operational detail. It is part of the design’s truth.

Blue-green infrastructure is especially dependent on care. Vegetation needs soil volume, water, pruning, replacement, and protection from damage. Permeable surfaces need cleaning. Retention spaces need inspection. Water plazas need safety management and public trust. If maintenance budgets are not secured at the beginning, the project may perform well in photographs and poorly during storms. The city therefore treats life-cycle cost as part of approval, not an afterthought.

Data can improve maintenance, but data belongs with local observation. Sensors, flood maps, heat maps, asset registers, and dashboards can help cities decide where to invest and when to intervene. Yet residents, maintenance crews, school staff, health workers, and local businesses often notice problems before they become data points. A mature adaptation system listens to both. It does not mistake a digital map for the whole city.

The governance lesson from both cases is that adaptation becomes ordinary when it shapes street standards, park renewals, waterfront approvals, housing policy, schoolyard design, drainage maintenance, public-health planning, and emergency routes. When adaptation remains a special project, it misses too many chances to reduce risk. When it becomes a normal rule of planning, the city gradually changes its risk profile.

Ordinary does not mean weak. It means that adaptation is present in the decisions that normally shape a city: road resurfacing, park renewal, housing permits, utility replacement, schoolyard upgrades, public-health planning, and capital budgeting. When those routine decisions ignore climate risk, even a sophisticated resilience strategy remains fragile. When they absorb climate risk, the city changes gradually but seriously. That is the administrative meaning of circular urban planning: public money, land, materials, water, and civic benefit are managed as connected responsibilities.

Finance is best understood as governance, not only accounting. A budget reveals whether the city treats adaptation as a permanent duty or a temporary campaign. Capital funding without maintenance funding creates future failure. Grant-funded pilots without a route to ordinary budgets create isolated examples. Emergency spending after a flood may be unavoidable, but it is usually more expensive and less equitable than prevention. Sound adaptation finance therefore combines risk-based investment, co-benefit justification, asset management, and long-term maintenance responsibility.

Procurement can either support or weaken circular planning. Standard procurement may reward the lowest immediate cost and the narrowest technical specification. Climate-adaptive procurement asks for life-cycle performance, material reuse, low-carbon delivery, biodiversity value, maintainability, public-space quality, and social safeguards. A contractor asked only to build a drainage object may not deliver a civic place. A design team asked to produce only visual appeal may not deliver hydraulic performance. The procurement document is where the city’s values become enforceable instructions.

Maintenance data belongs with public reporting. Residents are more likely to protect and trust blue-green infrastructure when the city explains how it is performing. A short public report can state which projects were completed, which drains were cleared, where tree survival is weak, which districts remain exposed, and what will be repaired next. Such reporting is not only administrative. It is civic education. It shows that adaptation is a living system rather than a one-time announcement.

Table 3. Recommendations for climate-adaptive cities.

Priority Action Expected value
Water-sensitive planning Require stormwater and heat adaptation in streets, parks, waterfronts, and development approvals. Normalizes adaptation across the city.
Maintenance finance Fund vegetation care, drainage cleaning, safety checks, and performance monitoring from the start. Protects long-term function.
Social inclusion Use vulnerability data and community participation in project selection. Reduces unequal protection.
Public-space value Design projects that improve daily life while reducing climate risk. Builds trust and political support.
Circular procurement Use durable, reusable, low-carbon materials and life-cycle cost rules. Links adaptation with circular economy practice.


Chapter 9: Diagnostic Model and Applied Evidence

9.1 Applied evidence from the cases

The tables and figures in this publication are designed as planning tools. They do not replace the case analysis. They summarize it. Table 1 compares Copenhagen and Rotterdam across risk emphasis, spatial strategy, governance lesson, and social concern. The purpose is to show that the two cities share a climate-adaptive logic while operating from different risk conditions. Copenhagen’s primary emphasis is cloudburst rainfall and surface-water management. Rotterdam’s emphasis is delta exposure, flood protection, port resilience, and adaptive waterfronts. Both use public space as climate infrastructure.

Table 2 presents the circular planning maturity scoring logic. The scores are author-developed and need to be read as diagnostic values, not official measurements. They help translate qualitative judgment into a profile. Copenhagen receives high marks for water-sensitive design and multifunctional public space. Rotterdam receives high marks for flood governance. Both cities perform well, but neither is treated as complete. The useful insight is unevenness: a city can be advanced in design and still need deeper social safeguards, or advanced in governance and still need better neighborhood-level evaluation.

The figures work in the same way. Figure 1 uses the public planning description of Copenhagen’s cloudburst delivery horizon to show scale and time. Figure 2 compares circular maturity dimensions. Figure 3 summarizes the benefit mix of blue-green infrastructure. Figure 4 shows the conceptual resilience estimate. Figure 5 presents an adaptation intervention portfolio. Figure 6 scores multifunctional public-space performance. Figure 7 turns the argument into an adaptation cycle: read risk, slow water, share space, reduce heat, protect people, and maintain and learn.

These visual tools are important because planners work with both narrative and evidence. A good planning paper cannot only describe. It gives decision-makers a way to organize choices. The model, tables, and figures are therefore best understood as applied evidence aids. They are transparent enough to be challenged and simple enough to be used in teaching, policy discussion, or project review.

9.2 Using the model responsibly

The model’s greatest risk is misuse. A city could treat the conceptual resilience score as a ranking device, or a consultant could present it as proof of performance. That would be wrong. Resilience is tested with hydrological data, heat data, maintenance records, social vulnerability indicators, avoided-damage analysis, resident feedback, and post-event evaluation. The model in this study is a framing device, not a substitute for empirical evaluation.

Used responsibly, the model supports better questions. If a city claims high circular maturity, what evidence supports that claim? Are water-sensitive design requirements embedded in street standards? Are parks designed for stormwater and heat? Are vulnerable districts prioritized? Are maintenance budgets protected? Are materials reused? Are residents involved early enough to influence project design? Are project benefits monitored after completion? The model turns resilience language into a checklist of responsibilities.

The same approach can be used outside Europe. A city in Africa, Asia, Latin America, or North America may not have the same budget as Copenhagen or Rotterdam, but it can still ask whether streets can safely route water, whether schoolyards can store runoff, whether tree planting is linked to heat risk, whether drainage investments protect vulnerable districts, and whether maintenance is funded. Circular planning is not a luxury concept. At its best, it is a way to make limited resources perform more than one public function.

The applied evidence therefore points toward a professional planning ethic. Make assumptions visible. Separate official data from author-developed scoring. Connect physical protection with social value. Plan for maintenance before construction. Do not call a project resilient because it looks green. Judge it by how it performs, who it protects, how it is cared for, and whether the city learns from it.

That ethic matters in cities under fiscal pressure. Limited resources make multifunctional planning more necessary, not less. A drainage project that also improves shade, walking comfort, public safety, biodiversity, and neighborhood dignity has a more convincing public case than a narrow technical repair. The same principle applies to data. A risk map becomes more valuable when it is read beside resident testimony, maintenance records, insurance exposure, land values, and health vulnerability. Circular planning does its best work when it refuses to separate the technical city from the lived city.

The figures are therefore best read as planning communication tools. Figure 1 communicates the scale and time horizon of Copenhagen’s cloudburst work. Figure 2 summarizes the comparative maturity judgement. Figures 3 and 5 translate broad co-benefits and intervention portfolios into visible proportions. Figure 4 makes the conceptual model transparent by showing the equal resilience estimate produced by the selected maturity scores. Figure 6 focuses attention on public-space performance, while Figure 7 reduces the circular adaptation cycle to six professional moves: read risk, slow water, share space, reduce heat, protect people, and maintain and learn.

The charts are not presented as statistical outputs from a survey or official municipal dataset. That distinction is essential for research honesty. Their values come from the documentary review and author-developed diagnostic scoring. The notes below the figures state this clearly, and the text repeats the limitation so that the visual material cannot be misread as official measurement. In NYCAR publication terms, this is a strength. A figure clarifies evidence; it does not exaggerate it.

Figure 4. Estimated urban resilience capacity score derived from the conceptual model. Copyright © June 2026 Michael C. Agbazuruwaka.

Figure 5. Adaptation intervention portfolio for circular urban planning. Copyright © June 2026 Michael C. Agbazuruwaka.

Figure 7. Circular urban adaptation cycle. Copyright © June 2026 Michael C. Agbazuruwaka.

Table 4. Implementation risks and professional safeguards.

Risk Planning consequence Safeguard
Weak maintenance Blue-green systems lose technical and social value. Approve life-cycle budgets before construction.
Climate gentrification Adaptive districts become exclusive amenities. Pair public-space upgrades with affordability safeguards.
Fragmented governance Projects remain isolated and inconsistent. Create shared standards across water, roads, parks, health, and housing.
Overreliance on pilot projects Innovation does not change the wider system. Build project pipelines, design standards, and routine approvals.
Poor public communication Residents see disruption without understanding benefit. Use clear risk maps, neighborhood meetings, and post-project reporting.


Chapter 10: Planning Recommendations and Final Position

10.1 Recommendations for climate-adaptive cities

Cities place water-sensitive design inside ordinary planning approvals when they treat every redevelopment as either a risk increase or a risk reduction. Streets, parks, waterfronts, public buildings, schoolyards, housing estates, and large developments then address stormwater, heat, vegetation, mobility, materials, and public-space value as part of routine approval rather than as an optional climate add-on.

Investment plans need to rank projects by risk reduction, social need, co-benefits, deliverability, and maintenance feasibility. The best project is not always the most dramatic. It may be a drainage corridor protecting a vulnerable district, a shaded route to a clinic, a schoolyard that stores water safely, or a green street that reduces repeated flooding. Cities need to use vulnerability data and local knowledge to decide where adaptation arrives first.

Maintenance finance belongs beside capital finance. A city cannot fund blue-green infrastructure responsibly unless it also funds vegetation care, cleaning, inspection, replacement, safety, and monitoring. The cost may appear higher at the beginning, but the alternative is false economy. Climate infrastructure that fails through neglect wastes public money and weakens trust.

Cities connect adaptation with circular procurement when materials are selected for durability, repairability, reuse, low carbon impact, and long service life. Construction waste is minimized. Project briefs require contractors and designers to show how water, heat, biodiversity, material use, and maintenance have been considered. Circularity belongs in tender documents, not only in policy statements.

Public participation begins before design decisions are fixed. Residents can help identify flood paths, heat-stress locations, unsafe spaces, daily routes, and local priorities. Participation functions as evidence, not ceremony. Technical knowledge and resident knowledge inform each other. The result is usually a better project and a more legitimate one.

Copenhagen keeps protecting the integrity of its cloudburst program by keeping long delivery timelines connected to neighborhood benefit, transparent prioritization, and maintenance evidence. The program’s strength lies in linking risk reduction with public-space improvement. That strength will weaken if delivery becomes uneven, if public understanding fades, or if maintenance does not keep pace with construction.

Rotterdam continues developing water-sensitive public spaces and adaptive waterfronts while guarding against climate gentrification. Its resilience tradition is high, but improved waterfronts and attractive adaptive districts can create affordability pressure. The city treats inclusion as part of resilience performance, not as a separate social policy applied later.

Cities with fewer resources can still act if they treat adaptation as a sequence rather than a single grand project. The first step is to identify repeated flood and heat stress points through local observation, complaints, maintenance records, and community reporting. The second step is to select practical interventions that serve more than one purpose: shade and drainage, storage and recreation, waterfront access and protection, schoolyard safety and public cooling. The third step is to protect maintenance funding before the project is announced. Without that discipline, modest projects can fail as quickly as expensive ones.

Professional education also has a role. Urban planners, architects, engineers, public-space designers, public-health officers, and municipal managers require training that teaches them to read climate risk together. Too much adaptation fails because each profession sees only its own part of the problem. The planner sees land use, the engineer sees drainage, the designer sees vegetation, the health officer sees heat exposure, and the finance officer sees cost.

Evaluation belongs inside every adaptation program. Cities track not only whether a project was completed, but whether it reduced flood exposure, improved shade, increased public use, protected vulnerable residents, and remained maintainable. Evaluation also records failure. If a permeable surface clogged, if a tree canopy failed, if a water plaza was avoided at night, or if a waterfront project increased displacement pressure, the lesson enters the next design cycle.

10.2 Final position

Copenhagen and Rotterdam show that climate adaptation can be a form of urban intelligence. They do not treat water only as a problem to be expelled. They treat it as a planning condition that shapes public space, ecological function, mobility, housing, economic continuity, and civic life. That is the deeper meaning of circular urban planning.

The climate-adaptive city will not be defined only by higher barriers, larger pipes, or more sophisticated emergency response, though all may remain necessary. It will be defined by streets that carry water safely, parks that cool and store, waterfronts that protect and welcome, schools and clinics that remain reachable, communities that participate, and planning systems that learn from evidence. Resilience is not only survival after an event. It is the redesign of ordinary life so that future events cause less harm.

The hardest lesson from the two cases is the discipline of connection. Water belongs with to public space. Design belongs with to maintenance. Climate investment belongs with to social equity. Circularity belongs with to procurement and material choices. Modeling belongs with to local observation. Policy belongs with to the street, the park, the waterfront, and the budget line. Without these links, adaptation remains fragmented.

Future research can follow projects over time. It can ask whether flood depth declined, whether heat exposure fell, whether maintenance remained funded, whether public spaces were used, whether vulnerable neighborhoods benefited, and whether property improvements produced displacement pressure. Admiration is not enough. Climate adaptation needs accountability.

The final position of this study is clear. Cities cannot wait for disaster before redesigning the public field. Every street renewal, park investment, waterfront plan, drainage upgrade, housing approval, and public-space project can become a chance to reduce climate risk. Copenhagen and Rotterdam are useful because they show how this work can be technical, civic, ecological, and practical at once. The city itself becomes the adaptation system when planning learns how to make ordinary space perform extraordinary work.

In professional terms, the study’s closing claim is that circular urban planning gives climate adaptation an operating grammar. It teaches cities to read risk before design, slow water before it becomes disaster, share scarce urban space across functions, reduce heat through land and vegetation, protect people rather than assets alone, and maintain what has been built. That grammar is simple enough for practice and demanding enough for serious planning education.

Copenhagen and Rotterdam do not provide perfect models, and they cannot be treated as finished cities. Their importance lies in the way each makes climate risk spatial, civic, and governable. They show that adaptation is not a separate future waiting outside the city. It is already present in the street section, the park design, the water edge, the maintenance budget, the procurement rule, and the public meeting. The cities that understand this will adapt earlier, fairer, and with greater public confidence.

10.3 Professional planning checklist

A practical checklist follows from the study. Before approving a climate-adaptation project, a city asks six questions. What exact risk is being reduced? Which residents are most exposed? Which public-space benefit will remain on ordinary days? What maintenance obligation is being created? Which circular procurement rule will reduce waste and emissions? What evidence will be collected after delivery? These questions are simple, but they prevent vague resilience language from replacing professional judgment.

The first question protects technical seriousness. A project cannot be called adaptive only because it includes trees, water, paving, or attractive public-space treatment. The project names the risk: cloudburst flow, surface flooding, heat stress, sea-level exposure, drainage overload, port disruption, or public-health vulnerability. Naming the risk allows the city to test whether the intervention is proportionate. It also helps residents understand why a familiar street, plaza, waterfront, or schoolyard is being changed.

The second question protects equity. Vulnerability data is combined with local knowledge because maps do not always capture how people experience risk. A district may look less exposed in a technical model but still contain older residents, basement housing, informal workspaces, weak transit access, or limited cooling options. Community reporting therefore sits beside engineering data. Each corrects the other.

The third and fourth questions protect public value over time. A floodable square that residents avoid is a weak civic investment. A rain garden that fails after two seasons because no one funded maintenance is not resilience. The project improves daily life through shade, safety, recreation, walking comfort, biodiversity, or public identity, and the city names who will care for it after construction. Maintenance is not a secondary issue. It is the point where climate ambition becomes durable public service.

The fifth question brings circularity into the construction process. Climate adaptation often requires materials, equipment, excavation, and new infrastructure. Those actions can either deepen linear consumption or support reuse, repairability, durability, and lower-carbon delivery. Circular urban planning therefore influences procurement, not only concept drawings. The city asks how materials will be sourced, whether components can be reused, how long the design is expected to last, and what happens at the end of the asset’s life.

The final question turns adaptation into learning. Every project produces evidence after delivery. Did water move as predicted? Did shade increase? Did residents use the space? Did maintenance costs match expectations? Did vulnerable households benefit? Did land values create exclusion pressure? The answers belong in the next project. Copenhagen and Rotterdam are valuable because they show direction, but the future of climate-adaptive planning depends on cities that can learn from their own streets with the same seriousness they bring to international examples.

A final professional test concerns institutional memory. Many cities lose adaptation knowledge when administrations change, consultants leave, or project teams dissolve. A climate-adaptive planning system preserves drawings, maintenance records, community feedback, cost data, risk assumptions, and performance reviews in a form future officials can use. Institutional memory is not paperwork for its own sake. It prevents the city from repeating mistakes, protects continuity across electoral cycles, and helps new projects build on tested practice rather than begin again with slogans.

This is why the study remains deliberately practical. It does not ask cities to admire Copenhagen or Rotterdam from a distance. It asks them to examine how those cities turn risk into design standards, budgets, and public-space decisions. The proper measure of the study is therefore not novelty alone, but usefulness: whether a planner, council member, infrastructure manager, or graduate researcher can use its framework to ask better questions before the next climate event exposes yesterday’s weak decisions.

References

C40 Cities. (2023). Rotterdam: Climate change adaptation strategy. C40 Good Practice Guides. https://www.c40.org/case-studies/c40-good-practice-guides-rotterdam-climate-change-adaptation-strategy/

City of Copenhagen. (2011). Copenhagen climate adaptation plan. City of Copenhagen. https://international.kk.dk/sites/default/files/2021-09/Copenhagen%20Climate%20Adaptation%20Plan%20-%202011.pdf

City of Copenhagen. (2012). The City of Copenhagen cloudburst management plan 2012. City of Copenhagen. https://international.kk.dk/sites/default/files/2021-09/Cloudburst%20Management%20plan%202010.pdf

Circular Cities Declaration. (2024). CCD report 2024. ICLEI Europe. https://circularcitiesdeclaration.eu/about/ccd-report

Ellen MacArthur Foundation. (2024). The circular economy in cities and regions: Planning for a regenerative urban future. https://www.ellenmacarthurfoundation.org/topics/cities/overview

European Environment Agency. (2024). Rotterdam port adaptation strategy for climate-resilient transport and business activities. Climate-ADAPT. https://climate-adapt.eea.europa.eu/en/metadata/case-studies/rotterdam-port-adaptation-strategy-for-climate-resilient-transport-and-business-activities

Ilgen, S., Sengers, F., & Wardekker, A. (2019). City-to-city learning for urban resilience: The case of water squares in Rotterdam and Mexico City. Water, 11(5), 983. https://doi.org/10.3390/w11050983

Intergovernmental Panel on Climate Change. (2022). Climate change 2022: Impacts, adaptation and vulnerability. Cambridge University Press. https://www.ipcc.ch/report/ar6/wg2/

INTERLACE Hub. (2023). Cloudburst management plan – Copenhagen. https://interlace-hub.com/cloudburst-management-plan-copenhagen

Pochodyła, E., Glińska-Lewczuk, K., & Jaszczak, A. (2021). Blue-green infrastructure as a new trend and an effective tool for water management in urban areas. Landscape Online, 92, 1–20. https://doi.org/10.3097/LO.202192

Port of Rotterdam Authority. (2025). Climate change adaptation. https://www.portofrotterdam.com/en/building-port/sustainable-port/climate-adaptation

Przestrzelska, K., Wartalska, K., Rosińska, W., Jurasz, J., & Kaźmierczak, B. (2024). Climate resilient cities: A review of blue-green solutions worldwide. Water Resources Management, 38(15), 5885–5910. https://doi.org/10.1007/s11269-024-03950-5

Resilient Cities Network. (2020). How resilient cities share strategies for adapting to a water-secure future. https://resilientcitiesnetwork.org/resilient-water-management/

Resilient Rotterdam. (2022). Resilient Rotterdam strategy 2022-2027. City of Rotterdam. https://s3.eu-central-1.amazonaws.com/storage.resilientrotterdam.nl/storage/2022/09/09093215/Resilient-Rotterdam-Strategy-2022-2027.pdf

Rotterdam Weatherwise. (2023). Weatherwise 2030 programme framework. City of Rotterdam. https://rotterdamsweerwoord.nl/content/uploads/2023/03/Programmakader-Rotterdams-Weerwoord-2030-EN.pdf

UN-Habitat. (2022). World cities report 2022: Envisaging the future of cities. United Nations Human Settlements Programme. https://unhabitat.org/world-cities-report-2022-envisaging-the-future-of-cities

Whittaker, S., & Jespersen, K. (2022). Stretching or conforming? Financing urban climate change adaptation in Copenhagen. Buildings and Cities, 3(1), 974-999. https://doi.org/10.5334/bc.238

The Thinkers’ Review

Social Media Intelligence and Digital Influence in Modern Organizations

Social Media Intelligence and Digital Influence in Modern Organizations

Social Media Intelligence and Digital Influence in Modern Organizations

Governance, Measurement, and Strategic Credibility in Digital Communication

Research Publication by Charles Ifeanyi Okafor

Institutional Affiliation: New York Center for Advanced Research (NYCAR)

NYCAR Research Publication | June 2026

Publication No.: NYCAR-TTR-2026-RP038

DOI: https://doi.org/10.5281/zenodo.20543640

Copyright © June 2026 Charles I. Okafor. All rights reserved.

New York Center for Advanced Research (NYCAR)

Peer Review and Publication Status

This research publication has completed peer review for NYCAR’s June 2026 research edition and is approved for publication as a master’s-level academic and professional work. The review found a clear research problem, a disciplined argument, appropriate use of current sources, sound APA 7th referencing, and a practical model that speaks directly to communication leadership, digital strategy, institutional trust, and management decision-making.

The publication’s central contribution is its treatment of social media intelligence as an organizational judgment system, not a routine count of online activity. It distinguishes visibility from influence, reaction from evidence, and platform noise from usable institutional knowledge. Its value lies in showing how digital signals become meaningful only when they are read carefully, assigned to responsible decision-makers, and converted into better communication, service improvement, stakeholder engagement, and governance learning.

On that basis, the work meets NYCAR’s publication standard and is suitable for academic, institutional, and professional readership.


Table of Contents

Abstract

Digital influence is now earned in public conditions that many organizations still manage as if social media were a noticeboard. A brand may publish often and remain untrusted. A university may reach large audiences and still leave serious learners unsure about quality, accreditation, cost, and career value. A hospital, public agency, media organization, start-up, or professional institute may attract attention and still miss the warning signs inside complaints, reviews, hashtags, search behavior, employee posts, and stakeholder silence. The problem is not data scarcity. The harder problem is the weak movement from fast, noisy digital evidence to responsible judgment.

This research publication examines social media intelligence as a governed organizational capability. Digital influence is not treated as virality, visibility, or platform activity. It is treated as the capacity to help the right stakeholders understand, trust, remember, question, defend, or act on an organization’s message. That capacity depends on analytics, but it also depends on editorial judgment, cultural literacy, internal communication, institutional memory, ethical restraint, and the willingness to let public evidence change operations rather than merely improve the next post.

Using an applied, literature-based management design, the study is supported by current public digital-use evidence and recent peer-reviewed scholarship. DataReportal’s 2026 global statistics show that social media has become a supermajority communication environment, with 5.79 billion social media user identities at the start of April 2026, while also warning that these identities should not be read as unique human individuals. The scholarship used in this paper includes work on social media analytics in business-to-business markets, digital and social media marketing research, internal digital communication, performance measurement, SME digital marketing, start-up performance, and cyborg accounts used for strategic communication.

Four applied tools are developed: the Social Media Intelligence Conversion Index, a digital influence regression model, a response-speed and credibility adjustment, and an attention-risk penalty model. These tools are not decorative mathematics. They help managers ask whether online signals are meaningful, whether attention is reaching the right audience, whether speed is improving or damaging credibility, and whether content volume has crossed from useful presence into reputational fatigue. The central argument is direct: social media becomes intelligent only when an organization can listen without panic, measure without vanity, respond without carelessness, and learn without defensiveness.

The paper ultimately argues that social media intelligence should be governed as an executive capability. Organizations that use platforms only for publicity remain exposed to volatility, weak interpretation, and measurement comfort. Organizations that build disciplined intelligence systems can detect risk earlier, correct misinformation more responsibly, improve service design, strengthen relationships, and speak with authority in crowded public spaces. The contribution is a practical NYCAR-level framework for converting digital signals into trusted communication, organizational learning, and accountable influence.

Keywords

Social media intelligence; digital influence; strategic communication; social media analytics; stakeholder trust; digital marketing; performance measurement; organizational learning; ethical governance; reputation; NYCAR

Chapter 1: Introduction

1.1 Digital influence and the new public condition

Social media has moved from the edge of organizational communication to the center of public judgment. Customers now complain in visible spaces. Employees interpret workplace culture through posts, comments, private groups, and quiet networks. Regulators, journalists, activists, alumni, patients, investors, competitors, and communities watch organizations through fragments of language, images, video, reviews, short statements, influencer commentary, and algorithmic recommendation. A formal press release may still matter, but it no longer controls the first meaning attached to an event. Meaning travels before the meeting, before the approved statement, and often before senior leadership has understood the full pattern of concern.

At this scale, the communication environment is too large for casual treatment. DataReportal reported 5.79 billion social media user identities worldwide at the start of April 2026 and noted that these identities represented more than two-thirds of the global population, while carefully warning that user identities are not the same as unique persons because duplicate accounts and platform-reporting differences remain important limitations. The figure matters less as a trophy than as a management warning. Organizations now operate in public spaces where attention is abundant, interpretation is unstable, and credibility can be tested by people who were never invited into the formal communication plan.

Digital influence is therefore not a soft communication concern. It is a governance question. A university that fails to answer repeated questions about program quality may damage trust even while its posts look polished. A public agency that responds quickly with partial information may reduce fear or deepen confusion, depending on the quality of its evidence. A start-up may gain attention faster than it can build service discipline. A professional institute may become popular and still lose seriousness if its tone no longer fits its mission. These are not platform problems alone. They are management problems expressed through platforms.

Serious organizations now need a language that can separate visibility from influence. Visibility means that a message was seen, shared, recommended, discussed, or placed in front of an audience. Influence means that the right audience understood something more clearly, trusted a claim more reasonably, changed a decision, defended a standard, corrected a misunderstanding, or acted with confidence. The two can overlap, but they are not the same. A viral error is still an error. A quiet clarification may be strategically valuable. Social media intelligence begins when managers stop admiring attention and start asking what the attention means.

This publication uses social media intelligence to describe the governed process by which organizations collect digital signals, interpret them with context, test their relevance, move insight to the right decision owner, and turn learning into communication or operational action. Intelligence is not the dashboard. It is the disciplined movement from signal to judgment. It requires people who can read tone, culture, timing, platform habits, institutional history, audience memory, and the limits of automated classification. The strongest organizations treat analytics as evidence that needs interpretation, not as a machine that produces decisions.

1.2 Problem statement

Many organizations adopted social media faster than they developed the judgment needed to govern it. They can publish quickly but cannot always verify quickly. They can count engagement but cannot always explain whether the engagement helped trust. They can monitor sentiment but may not know whether the sentiment tool understands sarcasm, idiom, organized manipulation, local frustration, or culturally specific language. They can hire influencers without fully understanding how much credibility has been borrowed, exposed, or weakened. The result is an active digital presence that may look modern while remaining strategically thin.

Difficulty deepens when leaders ask for numbers before they ask for meaning. High reach may hide the wrong audience. A spike in negative comments may signal genuine harm, coordinated hostility, competitor interference, ordinary confusion, or poor platform moderation. A post can attract praise without producing useful action. A quiet correction may prevent crisis without ever looking impressive in a monthly report. Under these conditions, measurement becomes dangerous when it comforts management without improving judgment.

Broken internal movement is another weakness. Social listening may reveal that customers are repeatedly confused by pricing, learners are unsure about admission rules, patients are worried about access, employees are skeptical of leadership statements, or stakeholders cannot find evidence for a public claim. If those insights remain inside the communications office, intelligence has failed at the point where it should become management. The organization has heard the public without allowing that hearing to change the organization.

A precise research problem follows. Modern organizations need a practical and ethical framework for converting social media data into credible influence and organizational learning. They need to separate visibility from influence, speed from reliability, attention from trust, and analytics from judgment. Measurement tools must help them diagnose capability, evaluate performance, manage response risk, and restrain output when visibility begins to damage institutional seriousness.

1.3 Aim, objectives, and research questions

This research publication examines how social media intelligence strengthens digital influence and communication performance in modern organizations. The study treats influence as an outcome of trust, stakeholder relevance, narrative clarity, credible evidence, response discipline, platform fit, and internal learning. It rejects the shallow assumption that organizations become influential because they post frequently or because their content reaches large audiences.

Its objectives are to clarify social media intelligence as a governed capability; distinguish digital influence from platform visibility; examine how social media analytics supports organizational learning; explain the measurement failures created by vanity metrics; develop applied models for intelligence conversion, influence estimation, response credibility, and attention risk; and translate the framework into practical routines for leaders, communication teams, knowledge institutions, resource-constrained organizations, and public-facing bodies.

Five research questions guide the publication. How should social media intelligence be defined as an organizational capability? What conditions allow digital attention to become credible influence? How can managers use analytics without surrendering judgment to vanity metrics or automated misclassification? Which governance routines reduce the risk of misinformation, overreaction, weak escalation, and reputational fatigue? What practical model can organizations use to measure the conversion of digital signals into communication value, operational learning, and stakeholder trust?

1.4 Significance of the study

Digital conversation now touches nearly every public responsibility of the organization, which is why the study matters. It shapes brand reputation, customer service, recruitment, employee voice, stakeholder education, crisis communication, policy visibility, product learning, fundraising, enrollment, advocacy, and investor confidence. An organization that treats social media as a minor publicity channel may fail to see strategic risk until it becomes public damage. An organization that treats social media as intelligence can detect early warning signs and answer them with better judgment.

Two weak positions still dominate practice. One is digital neglect, where online discourse is dismissed because it appears informal, emotional, or unserious. The other is digital obsession, where every surge in attention is treated as proof of success. Neither is mature. A disciplined organization reads digital evidence without surrendering to it. Social media intelligence should make leaders calmer, more informed, more responsive, and more accountable. It should not make them chase noise.

Its contribution is practical as well as conceptual. The Social Media Intelligence Conversion Index gives leaders a diagnostic instrument. The regression model helps test whether intelligence capability is associated with influence outcomes. The response-speed adjustment prevents speed from being praised when credibility is weak. The attention-risk penalty challenges the assumption that more content is always better. These tools do not remove professional judgment. They make judgment more disciplined by tying it to clear questions, defined variables, and reviewable decisions.

Chapter 2: Literature Review

2.1 Social media intelligence as organizational learning

Social media intelligence begins with a simple distinction. Managing posts is not the same as understanding a digital environment. A scheduling team may produce consistent output, but intelligence begins when the organization can read what stakeholders are saying, identify which signals matter, place those signals in context, and move the resulting insight into decisions. Output belongs to communication activity. Intelligence belongs to strategy because it changes what the organization knows, how it responds, and what it improves.

Agnihotri, Afshar Bakeshloo, and Mani (2023) are especially useful because they extend social media analytics into business-to-business marketing, where influence depends less on spectacle and more on expertise, relationships, technical trust, and long decision cycles. Their work defines social media analytics through acquisition, analysis, dissemination, retention, and use of findings. That definition matters because it treats analytics as a learning process, not as a dashboard exercise. Data have to move; otherwise they remain stored observation.

A capability view also fits the wider digital-marketing literature. Dwivedi et al. (2021) show that digital and social media marketing research now includes artificial intelligence, mobile environments, customer engagement, electronic word of mouth, and ethical pressure. The breadth is important. Social media intelligence now crosses the boundaries between marketing, public relations, customer service, product design, human resources, risk management, leadership communication, and institutional governance. A serious system cannot leave evidence inside one department when the causes and consequences sit across the organization.

Capability requires tools, but tools are the least complete part of the system. A useful framework needs human interpretation, clear escalation routes, ownership of decisions, a review rhythm, and ethical limits. Without those elements, social media data may become a pile of observations that never becomes knowledge. The phrase intelligence should therefore be used carefully. It is earned when the organization can show how signals were collected, how relevance was tested, who interpreted the evidence, what action followed, and what was learned from the result.

2.2 Digital influence beyond visibility

Digital influence is often confused with visibility because visibility is easier to count. A message can be seen by many people without changing the relationship between the organization and its stakeholders. A controversial post may travel widely because it provoked ridicule. A public apology may receive large engagement because audiences distrust it. A short expert comment may reach a smaller audience and still influence the people whose decisions matter. Influence requires credibility, relevance, timing, trust, and meaningful movement in understanding or action.

Bruce et al. (2025) provide a useful entrepreneurial example. Their PLOS ONE study of 450 start-ups in Ghana found that social media usage, brand image, and innovation capabilities were positively linked with start-up performance, with brand image mediating the relationship between social media usage and performance. The lesson is not that social media automatically produces growth. The stronger reading is that social media becomes valuable when it strengthens a believable brand image and connects to an organization’s ability to innovate, serve, and convert attention into trust.

Sharabati, Al-Haddad, Al-Khasawneh, and Nababteh (2024) also show why digital marketing must be read through business capability. Their SME-focused study found that digital marketing strategies, including online advertising, social media marketing, search engine optimization, and customer engagement, can support performance, while digital transformation mediates that relationship. The implication is clear: platforms do not save weak operations. Digital communication has stronger value when the organization can support what its message promises.

Knowledge organizations face a special version of this distinction. A research center, university, hospital, professional body, or public agency may not be seeking an immediate purchase. It may be trying to teach, clarify, reassure, correct misinformation, build legitimacy, recruit a serious audience, or defend professional standards. In those contexts, influence must be evaluated through fit between message and mission. A post that attracts casual applause but weakens institutional seriousness may be a communication loss. A sober explanation that reduces confusion among a smaller stakeholder group may be a strategic win.

2.3 Analytics, data quality, and platform evidence

Analytics can support management only when its evidence is understood with restraint. Platforms provide reach, impressions, comments, shares, saves, referral traffic, watch time, follower growth, click-through rates, and demographic estimates. These measures can be useful. They can also mislead. A platform may report accounts rather than unique people. A single person may hold multiple profiles. A campaign may reach people outside the target stakeholder group. A sentiment tool may classify sarcasm as approval. A comment surge may reflect a coordinated campaign rather than authentic stakeholder consensus.

DataReportal’s treatment of global social media statistics offers a good example of responsible caution. Its 2026 figures present the scale of social media user identities, but the source explicitly warns that social media user figures may not represent unique individuals and may exceed internet-user or population figures because of duplicate accounts and reporting differences. That caution should travel into organizational practice. Mature managers do not merely ask what a platform reports. They ask what the measure represents, what it excludes, how it may be distorted, and what decision it can fairly support.

Agnihotri et al. (2023) help move analytics away from surface counting by linking social media analytics to organizational learning. In practice, this means that a recurring complaint, repeated technical objection, emerging stakeholder question, or quiet shift in audience language may have more value than a high-volume post. The useful signal is not always loud. Intelligence often comes from pattern, not spectacle. A manager who sees only the highest-engagement post may miss the slower evidence that exposes a product, service, policy, or credibility problem.

Noise is not an argument against analytics. It is an argument for better interpretation. Digital teams should compare automated classification with human reading, separate owned-channel engagement from earned discussion, distinguish support from curiosity, and test whether the audience reached matches the audience that matters. A single dashboard cannot carry those judgments. The strongest evidence comes when quantitative signals, qualitative reading, platform context, and operational knowledge are brought together in the same review process.

2.4 Performance measurement and vanity metrics

Measurement remains one of the most persistent weaknesses in digital strategy. Managers are surrounded by numbers, yet many of the available numbers are easy to collect and difficult to interpret. Impressions, reach, shares, likes, comments, completion rates, referral traffic, click-through rates, sentiment scores, follower growth, and watch time can all be useful. They can also mislead. A post may receive high engagement because people are angry. A campaign may gain followers who are irrelevant to the organization. A low-engagement message may still reassure a narrow but important professional audience.

Ascani and Ancillai (2025) address this difficulty directly through a systematic literature review of social media marketing performance measurement. Their work supports a move away from simply asking which metrics exist and toward a stronger question: how should organizations design and use measurement systems that support decisions? Measurement becomes useful when a metric explains something that matters, triggers a decision, guides improvement, or holds someone accountable. It becomes decorative when managers admire the dashboard but cannot say what should change.

Vanity metrics survive because they offer comfort. They allow leaders to feel that growth is happening even when trust is weak. They allow teams to prove activity when the more difficult outcome is influence. They produce monthly reports with attractive upward lines. Yet a serious organization must be willing to ask harder questions. Did the right stakeholders receive the message? Did the communication reduce confusion? Did the audience believe the claim? Did complaints reveal an operational failure? Did the digital evidence reach the department that could fix the cause?

Those questions are more demanding than engagement totals, and that is exactly why they matter. A university may need inquiry quality more than reach. A hospital may need patient reassurance and safe escalation more than likes. A public agency may need compliance, clarity, and rumor correction. A B2B firm may need decision-maker understanding rather than broad visibility. A news organization may need trust and source discipline rather than raw traffic. Measurement has to begin with the organizational purpose, not with the platform’s easiest numbers.

2.5 Internal communication and learning conversion

Analytics becomes strategic only when it changes what the organization understands or does. Social listening can identify recurring complaints, emerging demands, competitor narratives, misinformation patterns, service failures, product needs, and content themes that audiences find useful. These insights often remain trapped inside communication reports because the organization has not built a route from evidence to ownership. Intelligence then fails not because data were absent, but because the institution could not carry learning across internal boundaries.

Recent internal communication literature strengthens this argument. Tkalac Verčič, Verčič, Čož, and Špoljarić (2024) present digital internal communication as a serious field in its own right, with gaps that matter for organizations adjusting to digital transformation. Wuersch, Neher, Maley, and Peter (2024) go further by linking digital internal communication strategy with capability development, learning, and trust. For social media intelligence, the implication is direct: external listening has limited value if internal communication cannot move the evidence to people who can repair, clarify, redesign, or escalate.

Learning conversion requires a named pathway. A comment pattern about confusing fees should move to admissions, finance, and policy communication. A recurring patient concern about appointment access should move to scheduling, clinical operations, and service improvement. A repeated employee complaint about leadership messages should reach human resources and executive communication. A product explanation that generates technical confusion should move to sales enablement and product management. Without that pathway, the organization has not created intelligence. It has only collected symptoms.

Internal memory also matters. Digital teams often respond to issues as if each one is new. A stronger organization records patterns across campaigns, crises, stakeholder groups, and platforms. It knows which topics repeatedly create confusion, which audiences need evidence rather than slogans, and which responses reduce hostility. Social media intelligence becomes stronger when the organization can compare present signals with past experience. Memory protects the team from repeating the same explanation, the same mistake, and the same avoidable crisis.

2.6 Trust, automation, and digital credibility

Trust is the hinge between attention and influence. Organizations sometimes mistake informality for authenticity. A casual tone may suit one brand and damage another. Humor may build closeness in one setting and look irresponsible in another. Speed may reassure stakeholders during a crisis, but speed without verification can destroy confidence. Credibility depends on fit between platform, evidence, audience, institutional character, and timing. It also depends on whether public language matches the organization’s actual behavior.

Automation makes this harder. Ng, Robertson, and Carley (2024) examine cyborg accounts used for strategic communication on social media, defining them as accounts that move between bot-like and human-like classification across time windows. Their work matters for organizational intelligence because social environments now include automated amplification, hybrid posting, impersonation, manipulation, and tactical account behavior. A manager reading social conversation must therefore ask not only what people appear to be saying, but how the conversation may have been shaped.

Responsible organizations should not build influence through questionable amplification. Influence created by manipulation is fragile because it can collapse into reputational harm when methods become visible. Paid promotion, influencer partnership, automation, employee advocacy, community management, and audience targeting may all have legitimate uses, but each requires disclosure discipline, platform-policy awareness, and a clear ethical line. The question is not whether a tactic produces reach. The question is whether the organization would still defend the tactic if stakeholders understood how the reach was produced.

Authenticity is not merely a tone of voice. It is the alignment between what the organization says and what stakeholders can observe. A values campaign will not survive a workplace culture that contradicts it. A service apology will not persuade if the underlying failure continues. A public health message will lose force if it ignores the lived concerns of patients. Social media intelligence has to connect communication with operational reality. Digital credibility is not created by words alone; it is created when words can be reconciled with conduct.

2.7 SMEs, start-ups, and resource-constrained organizations

Social media offers special opportunity for small firms, start-ups, civic groups, educational providers, and professional institutions operating with limited traditional media budgets. A resource-constrained organization can reach niche audiences, demonstrate expertise, answer questions, and build community without buying expensive broadcast access. The same conditions create risk. Smaller organizations may lack analytics capability, crisis governance, legal review, brand discipline, accessibility standards, or trained staff who can manage the consequences of public attention.

Bruce et al. (2025) show how social media can support start-up performance when brand image and innovation capability are part of the relationship. That finding is useful because it moves the conversation away from posting enthusiasm. A young firm needs more than visibility. It needs a credible offer, responsive service, product learning, brand clarity, and the ability to convert audience interaction into customer confidence. Social media may open the door, but operational discipline determines whether the relationship can enter.

Sharabati et al. (2024) make a related point for SMEs, where digital marketing can improve market presence and financial outcomes but remains shaped by digital transformation, customer interaction, and organizational capability. In practice, a small business that posts effectively but cannot answer inquiries, fulfill orders, handle complaints, or maintain product quality may suffer from its own visibility. A good social media strategy should therefore ask whether the organization is ready for the attention it is trying to attract.

Emerging and multilingual contexts add another layer. Imported campaign templates may not fit local humor, religious expression, political memory, trust patterns, or consumer habits. Sentiment tools may misread idioms, respectful indirectness, irony, code-switching, or mixed-language speech. Social media intelligence therefore requires local interpretation. Data can show that a message moved. Human judgment must explain why it moved, whether the movement was useful, and what cultural meaning audiences attached to it.

2.8 Platform architecture and attention risk

Platforms are not neutral containers. Their algorithms, content formats, advertising systems, community habits, moderation rules, creator cultures, and recommendation engines shape what becomes visible. A message that builds authority on LinkedIn may look lifeless on TikTok. A short video that succeeds on Instagram may not create serious confidence for a professional institute. A crisis that begins on X may move into Facebook groups, WhatsApp communities, Reddit threads, or news websites. Organizations that treat platforms as interchangeable lose strategic precision.

Platform dependence also creates business risk. A firm may build audience on a channel whose organic reach later falls. Advertising costs may rise. Rules may change. Platform reputation may weaken. A content format may become fashionable and then tired. Social media intelligence should therefore include channel portfolio thinking. The goal is not to abandon platforms, but to avoid building influence on one rented space, one algorithm, or one content habit. Owned channels, email lists, websites, knowledge repositories, in-person relationships, and direct stakeholder communication still matter.

Attention risk becomes serious when organizations imitate platform fashion without protecting identity. A professional institution can be accessible without becoming trivial. A hospital can be human without becoming casual about safety. A university can be lively without sounding unserious. A public agency can be clear without becoming performative. The platform has a grammar, but the organization has a character. Mature digital influence requires enough adaptation to be heard and enough discipline to remain credible.

2.9 Literature gap

Recent scholarship provides strong building blocks: analytics, digital marketing capability, internal communication, performance measurement, SME performance, start-up brand image, automation, and strategic communication. The gap lies in the conversion process. Many organizations know how to collect social media data, and many know how to publish content. Fewer can explain how digital signals become knowledge, how knowledge becomes decision, how decision becomes credible communication or operational repair, and how the organization reviews whether the action worked.

This publication addresses that gap by building a practical conversion framework. It does not romanticize social media as democratic wisdom, and it does not dismiss it as noise. It treats digital conversation as imperfect evidence that can still be valuable when governed well. The contribution lies in joining analytics, credibility, audience relevance, response quality, platform risk, ethical restraint, and learning conversion into one managerial account. The framework gives leaders a way to ask sharper questions without losing the speed and responsiveness that make social media valuable.

Read also: Editorial Trust and Platform Power in New York Digital Publishing

Chapter 3: Methodology and Quantitative Framework

3.1 Research design

An integrative applied design guides this study. It draws from recent peer-reviewed literature, current public digital-use evidence, and strategic communication analysis to develop a practical framework for modern organizations. The study is not a private empirical survey and does not estimate coefficients from a proprietary organizational dataset. Its quantitative contribution is a set of model specifications that can be calibrated by organizations using their own social media, communication, customer, stakeholder, and performance data.

This design is suitable for a master’s-level management and digital communication publication because the research problem is both conceptual and practical. Organizations need a clearer understanding of social media intelligence, but they also need usable instruments. A purely descriptive discussion would leave managers with ideas but no decision method. A purely statistical exercise would risk building variables without enough conceptual discipline. The study therefore combines literature interpretation, construct definition, applied modeling, sector examples, and governance recommendations.

3.2 Evidence logic and source discipline

Sources were selected for recency, relevance, and contribution to the core research problem. Priority was given to peer-reviewed work from 2021 onward on social media analytics, digital marketing, digital internal communication, performance measurement, start-up performance, SME digital marketing, automation, and digital transformation. Public digital-use statistics are used for context, not as proof that any particular organization is influential. They help show why public digital conditions now require governance discipline.

Evidence is handled cautiously. Peer-reviewed research provides the conceptual foundation. Public global data provide scale and context. The models provide a disciplined method for local application. No single source is asked to carry more than it can support. A global user-identity figure cannot prove stakeholder trust. A scholarly study can support a construct but cannot remove the need for sector-specific calibration. A model can clarify relationships but cannot replace judgment.

No invented field evidence is used. It does not claim private interviews, confidential platform access, proprietary campaign results, or unpublished organizational data. Where examples are used, they illustrate management logic rather than asserting hidden empirical findings. That restraint is important. A publication on social media intelligence loses credibility if it makes unsupported claims about digital behavior while calling for better evidence discipline.

3.3 Construct definitions

Social media intelligence is the primary construct. It is defined as the organization’s ability to collect digital signals, interpret them accurately, connect them to stakeholder knowledge, and use them to improve communication and strategic decisions. Digital influence is defined as the capacity to shape stakeholder understanding, confidence, preference, advocacy, or action through credible online presence. Communication performance refers to outcomes such as trust, clarity, conversion, reputation protection, complaint resolution, stakeholder retention, knowledge transfer, and evidence of organizational learning.

Supporting variables include signal quality, audience relevance, content credibility, learning conversion, response speed, sentiment reliability, platform governance, ethical restraint, engagement depth, response quality, attention risk, and platform fit. Signal quality measures whether the data represent meaningful stakeholder concern rather than noise. Audience relevance measures whether the people reached are strategically important. Learning conversion measures whether insights move from reporting to action. Attention risk measures the possibility that output intensity creates fatigue, backlash, confusion, or reputational dilution.

Figure 1. Social Media Intelligence Conversion Logic

Note. Copyright © June 2026 Charles I. Okafor. Diagram prepared for NYCAR Research Publication. All rights reserved.

3.4 Social Media Intelligence Conversion Index

As designed here, the Social Media Intelligence Conversion Index is a diagnostic score. It does not treat maturity as the number of platforms used or the frequency of publication. It asks whether the organization can convert social media signals into useful knowledge and credible action. The index can be scored from 0 to 100 across eight dimensions. The weights proposed here are starting values for applied review, not universal constants.

SMICI = 0.18SQ + 0.16AR + 0.15CC + 0.14LC + 0.12RS + 0.10SR + 0.08PG + 0.07ER

Table 1. Social Media Intelligence Conversion Index

Component Weight Management meaning
Signal quality 0.18 Strength and relevance of social media evidence rather than noise.
Audience relevance 0.16 Fit between reached audience and the strategic stakeholder group.
Content credibility 0.15 Evidence, tone, consistency, and institutional reliability.
Learning conversion 0.14 Movement from dashboard insight to organizational action.
Response speed 0.12 Timeliness of reply, correction, or stakeholder education.
Sentiment reliability 0.10 Confidence that sentiment scores reflect real meaning.
Platform governance 0.08 Rules for ownership, escalation, access, and risk.
Ethical restraint 0.07 Responsible use of data, automation, and targeting.

Note. All measures can be scored on a 0–100 scale and recalibrated by sector, audience, and communication objective.

This index is most useful when the scoring conversation is honest. A team may have strong response speed and weak learning conversion. Another may have strong content credibility but poor audience relevance. A third may have useful data but poor platform governance. The score is therefore not a badge. It is a diagnostic instrument. Leaders should use it to decide where capability is fragile and what must be strengthened before the organization invests in more output.

3.5 Digital influence regression model

This regression model estimates whether social media intelligence predicts digital influence after accounting for content credibility, platform fit, engagement depth, response quality, attention risk, and learning conversion. It can be estimated across time periods, campaigns, business units, markets, or stakeholder groups, provided the organization has consistent data and a clearly defined outcome measure.

Influence_it = β0 + β1SMICI_it + β2Credibility_it + β3PlatformFit_it + β4EngagementDepth_it + β5ResponseQuality_it – β6AttentionRisk_it + β7LearningConversion_it + ε_it

Attention risk carries a negative sign deliberately. Visibility can damage influence when communication becomes excessive, unserious, poorly targeted, or inconsistent with institutional identity. The coefficient for learning conversion is expected to be positive because social media intelligence becomes stronger when insights change organizational behavior. The model should not be used mechanically. It should support review by showing which factors appear to move trusted influence and which factors are weakening it.

3.6 Response-speed and credibility adjustment

Speed is valuable only when the organization remains accurate enough to be believed. A crisis reply issued in minutes may reassure stakeholders if facts are clear and the tone is responsible. The same reply may become harmful if it contains errors or sounds dismissive. The response-speed and credibility adjustment therefore measures the balance between timeliness, verification, and relevance.

Figure 2. Digital Influence Measurement and Risk Control Model

Note. Copyright © June 2026 Charles I. Okafor. Diagram prepared for NYCAR Research Publication. All rights reserved.

Adjusted Response Value = Response Speed Score × Credibility Score × Stakeholder Relevance Score ÷ (1 + Error Risk Score)

This adjustment discourages a common mistake: treating rapid response as automatic excellence. If error risk rises, the adjusted response value falls. The model pushes organizations to prepare before pressure arrives. Pre-approved evidence routes, escalation rules, issue libraries, and crisis language can make responsible speed possible. Speed without preparation is often just panic with better formatting.

3.7 Attention-risk penalty model

Attention-risk penalty estimates the cost of overcommunication, sensationalism, or platform chasing. It is especially useful for organizations that publish constantly but cannot show stronger trust, inquiry quality, conversion, service improvement, or stakeholder learning. The model helps leaders question whether output intensity still fits the organization’s purpose.

ARP = Σ[max(0, OutputIntensity_j – StrategicFit_j) × FatigueRisk_j × ReputationSensitivity_j]

Penalty rises only when output intensity exceeds strategic fit; the max(0, …) term prevents the model from creating a negative penalty when output remains below a reasonable strategic threshold. A youth-oriented consumer brand may tolerate higher frequency and humor than a professional institute, hospital, or regulatory agency. The point is not to discourage presence. The point is to make presence accountable to purpose. A visible organization that becomes tiring, erratic, or unserious may lose the very influence it was trying to build.

Table 2. Social Media Intelligence Models and Decision Use

Model Core question Best use
SMICI Can the organization convert social signals into knowledge? Capability diagnosis and improvement planning.
Digital influence regression Does intelligence improve trusted influence? Performance evaluation across campaigns or stakeholder groups.
Response-speed adjustment Is speed credible enough to create value? Crisis, complaint, and service-response governance.
Attention-risk penalty Is output intensity damaging strategic fit? Content governance and reputation protection.

Note. The models should be used together because social media influence depends on capability, credibility, timing, restraint, and learning.

3.8 Validity, calibration, and ethical use

Validity depends on aligning each measure with a real management question. Signal quality should not be scored by volume alone. Audience relevance should not be assumed because a platform reports demographic reach. Sentiment reliability should be tested against human reading, especially in multilingual settings. Learning conversion should be assessed by whether insight reached decision owners and changed practice. If variables are weakly defined, the model may produce confident numbers around poor judgment.

Calibration should be local. A public health agency, university, retailer, start-up, B2B manufacturer, and news organization will not define influence in the same way. Some need inquiry quality. Some need complaint resolution. Some need trust recovery. Some need enrollment, sales, donations, public understanding, or policy compliance. The framework provides structure, but managers must define outcomes that fit their mission and data reality.

Ethical use is not optional. The models should support better service, clearer communication, and responsible decision-making. They should not become instruments for manipulation or surveillance. Stakeholders should not be treated as abstract units of persuasion. When social media evidence involves vulnerable groups, health information, minors, political claims, or sensitive complaints, organizations should apply stronger review. The quality of intelligence depends not only on accuracy but on legitimacy.

Chapter 4: Applied Analysis and Sector Evidence

4.1 Listening is not learning

Listening is not learning. Many organizations listen in the narrow sense that they collect mentions, reviews, comments, and engagement summaries. Learning begins when the organization changes its understanding or behavior because of what it has heard. A dashboard may show rising complaints about delivery delays, but if operations never receives the pattern, intelligence has failed. A communication team may notice that audiences misunderstand a policy, but if leadership refuses to clarify the policy, the organization has collected evidence without learning from it.

A learning organization treats social media signals as early, imperfect public evidence. It does not panic each time a complaint appears, but it also does not dismiss recurring complaints as noise. Repetition matters. Language matters. Silence matters. The same question asked by different stakeholder groups may show that the organization has not explained itself properly. The same complaint repeated across platforms may show that a service promise is not being delivered. The same rumor appearing under different posts may show that uncertainty is spreading faster than the official explanation.

Learning also requires responsibility. Someone must own the interpretation, and someone must own the response. If every signal is everybody’s concern, no signal becomes anybody’s task. A practical system assigns responsibility by issue type: service problems to operations, policy confusion to executive communication and legal review, technical questions to product or academic teams, reputational threats to senior leadership, and safety or safeguarding issues to the appropriate risk function. The route must be clear before crisis arrives.

4.2 Knowledge institutions and professional credibility

Universities, training institutes, research centers, and professional bodies live by credibility. Their digital influence cannot be measured only by follower growth or public excitement. Serious learners, partners, regulators, employers, alumni, and faculty members ask for evidence. They want to know what is being taught, who is teaching, how quality is assessed, whether standards are real, what recognition exists, and what outcomes can be reasonably expected. A knowledge institution that posts energetic slogans while leaving these questions unanswered weakens its own seriousness.

Social media intelligence helps such institutions because stakeholder questions reveal where public understanding is weak. Repeated questions about admissions may show that the website is unclear. Skepticism about certificates may require clearer explanation of institutional status, assessment design, learning outcomes, and publication standards. Low engagement on a detailed academic post does not necessarily mean failure. It may have reached a smaller audience of serious readers whose trust matters more than casual applause.

For knowledge institutions, the strongest content is often evidence-rich rather than noisy. Course explainers, faculty notes, learner guidance, publication standards, research summaries, methodological corrections, and transparent frequently asked questions can build durable confidence. Platform style still matters; unclear or lifeless communication will not help. Yet the deeper requirement is intellectual seriousness. A university or research center should sound accessible without losing weight. Its social presence should make its standards more visible, not less believable.

4.3 Health, public agencies, and service trust

Health organizations and public agencies face another test. Their messages may affect safety, access, compliance, fear, stigma, and public trust. They cannot behave as if engagement is the main outcome. A low-visibility message that helps vulnerable people understand eligibility or access may be more valuable than a widely shared announcement that leaves practical questions unanswered. Social media intelligence in these settings must read complaints, misinformation, and confusion as service evidence, not only as reputational risk.

Patient comments may reveal missed appointments, unclear instructions, inaccessible phone systems, language barriers, or fear about cost. Public-agency comments may expose confusion about deadlines, eligibility, documentation, enforcement, or policy changes. In both settings, the communication team should not be left to carry the burden alone. The pattern may require operational repair, better forms, clearer call-center scripts, translated material, revised web pages, or new community outreach. A better post is sometimes necessary, but it is not always sufficient.

Credible health and public communication also requires restraint. Overconfident language can damage trust when circumstances change. Silence can damage trust when people need reassurance. The strongest response combines speed, evidence, humility, and practical guidance. It tells people what is known, what is not known, what they should do now, and where the next reliable update will appear. Social media intelligence should help public-facing institutions become clearer under pressure, not merely louder.

4.4 B2B firms and high-consideration markets

Business-to-business firms operate in markets where influence often travels through expertise, technical confidence, relationship trust, and long decision cycles. A large audience is not always valuable. A small audience of engineers, procurement officers, senior managers, compliance leaders, or specialist buyers may matter more. Agnihotri et al. (2023) are relevant here because they frame social media analytics as a learning resource in industrial markets. The most valuable signal may be a recurring objection, not a viral post.

For B2B organizations, social media intelligence should connect public signals with sales enablement and product knowledge. Technical questions can show where product explanation is weak. Competitor comparisons may show which claims require better evidence. Low engagement on a detailed technical piece may still help account teams if it supports the confidence of serious buyers. A webinar question, LinkedIn comment, or industry forum discussion can reveal the language decision-makers are using before a formal request for proposal appears.

A practical danger appears when content tries to behave like consumer entertainment while serving a high-consideration market. B2B communication can be clear, human, and visually strong without becoming shallow. It should respect the buyer’s intelligence. Social media intelligence helps by showing which content actually supports relationship movement, which topics produce qualified inquiry, and which messages only create empty impressions. Influence in such markets is often quiet. It is still measurable if the organization defines the right outcome.

4.5 Start-ups, SMEs, and emerging-market discipline

Start-ups and SMEs often use social media because it is affordable, fast, and close to customers. That advantage is real. It allows a small firm to test language, answer questions, present proof of work, build a community, and compete for attention without a large advertising budget. Yet the same openness can expose weaknesses quickly. A founder-led account can build trust, but it can also create reputational damage if promises outrun capacity, complaints are handled defensively, or the brand voice becomes erratic.

Research on start-ups and SMEs supports a disciplined view. Bruce et al. (2025) link social media usage with start-up performance through brand image, while Sharabati et al. (2024) connect digital marketing with SME performance through digital transformation and customer engagement. Both lines of evidence point beyond simple posting. Social media is useful when it strengthens a business system. It is risky when visibility rises faster than fulfillment, service, product quality, or managerial control.

Emerging-market organizations must also be careful with trust. Customers may rely heavily on social proof, peer recommendation, direct messages, informal networks, and visible complaint handling. A slow or dismissive response can damage confidence. At the same time, excessive posting may look desperate or unserious. The right balance depends on sector, audience, and operational readiness. A small firm should ask one hard question before every visibility push: can the organization honor the attention it is inviting?

4.6 Media organizations and editorial authority

Media organizations have a different burden because they work inside the same attention economy they report on. Social media can distribute journalism, identify sources, expose public concerns, and build audience relationships. It can also reward speed over verification, outrage over context, and personality over evidence. A newsroom that measures success only by traffic may gradually train itself to chase reaction rather than report with discipline. Social media intelligence should protect editorial authority instead of reducing journalism to platform performance.

For media institutions, digital influence rests on trust in judgment. Audience comments may help identify missing context or errors, but they should not replace editorial standards. Viral pressure may indicate public interest, but it should not decide what is true. Analytics can show where readers drop off, what topics generate sustained interest, and how explainers travel, but the newsroom must still defend evidence, source integrity, proportionality, and correction discipline. The dashboard can inform editors; it cannot become the editor.

A strong media intelligence system separates several signals: audience need, public emotion, misinformation pattern, source risk, political manipulation, and business performance. These signals are related but not identical. A public reaction may be intense because a report is important, because it is misunderstood, or because organized actors are trying to bend the story. Editorial authority depends on knowing the difference and showing the audience how the newsroom reached its judgment.

4.7 Crisis, misinformation, and response governance

Crisis communication tests social media intelligence more severely than routine posting. The organization must decide what is true, what is uncertain, who should speak, which audience needs information first, which claims require correction, and which channels are appropriate. Speed matters, but speed is not a virtue when it outruns verification. Delay matters, but delay is not always negligence when facts are being checked. A mature response system prepares the organization to move quickly without becoming careless.

Misinformation adds complexity because false claims often travel through emotion, identity, suspicion, and repetition. A correction that merely says a claim is false may not persuade if stakeholders do not trust the organization. Stronger correction provides evidence, acknowledges the concern behind the rumor where appropriate, explains what is known, and gives people a practical route to reliable information. Social media intelligence can help by identifying which misinformation is spreading, which communities are affected, and which explanation is likely to reach them.

Ng et al. (2024) show why crisis teams must consider manipulation and hybrid automation. Coordinated behavior can distort the apparent size or urgency of a reaction. A responsible organization should avoid two mistakes. It should not dismiss every hostile pattern as artificial, because real stakeholders may have legitimate concerns. It should not treat every high-volume pattern as representative, because tactical amplification is possible. The right response begins with evidence discipline, not assumption.

Correction protocols should be written before they are needed. The organization should know who can approve urgent statements, who verifies facts, who contacts legal or regulatory advisers, who monitors platform spread, and who decides when operational repair is more important than public reply. A crisis archive should preserve screenshots, timestamps, posts, responses, and decision notes. Public memory may be short, but institutional memory should not be.

4.8 Practical measurement interpretation

Measurement interpretation should begin with the purpose of the communication. A recruitment campaign should not be judged like a crisis correction. A patient-access update should not be judged like a product launch. A professional explainer should not be judged by the same standard as a consumer contest. The organization should define the target stakeholder group, intended movement, evidence of trust, acceptable risk, and follow-up action before it decides which metric matters.

A practical measurement review should ask four questions. First, did the message reach the people who mattered? Second, did the message improve understanding, confidence, inquiry quality, conversion, service resolution, or another defined outcome? Third, did the organization learn anything that requires internal action? Fourth, did the communication create any new risk through confusion, fatigue, backlash, or overclaiming? These questions convert metrics from reporting decoration into management evidence.

A balanced interpretation also recognizes invisible success. A clear correction may prevent rumor growth without producing high engagement. A stakeholder update may reduce inbound confusion. A technical explanation may support sales teams even if public reaction is modest. A service response may protect trust with one complainant and the silent audience watching the exchange. Social media intelligence should reward these forms of value. If the measurement system recognizes only visible applause, it will train the organization to neglect the quieter work of credibility.

Table 3. Evidence Interpretation Matrix

Observed digital signal Weak interpretation Stronger intelligence response
High engagement on a complaint The post is performing well. Test whether the complaint exposes service failure, misinformation, or stakeholder distrust.
Low engagement on a technical explainer The content failed. Check whether it reached a small but strategically important professional audience.
Negative sentiment spike The public is against us. Review source mix, coordination indicators, issue history, and operational evidence.
Repeated direct-message questions The audience is not reading. Improve public information architecture, FAQs, web clarity, and follow-up routes.
Strong follower growth Influence is rising. Check audience relevance, inquiry quality, conversion, trust, and retention.

Chapter 5: Discussion

5.1 What the evidence shows

Evidence supports one central finding: social media intelligence is strongest when it is treated as a decision system rather than a posting system. Agnihotri et al. (2023) connect analytics with organizational learning. Ascani and Ancillai (2025) show that performance measurement remains a difficult management problem, not a simple reporting task. Tkalac Verčič et al. (2024) and Wuersch et al. (2024) show why internal digital communication matters for organizational learning and trust. Bruce et al. (2025) and Sharabati et al. (2024) show that social media and digital marketing create stronger value when connected to capability, brand image, innovation, and transformation.

Taken together, the literature rejects a shallow digital strategy. The organization does not become influential because it has more platforms, posts more often, speaks faster, or produces attractive charts. Influence grows when digital evidence is interpreted responsibly and linked to credible action. The public sees not only what the organization says, but whether it answers questions, corrects errors, behaves consistently, and respects the intelligence of its stakeholders. Digital influence is therefore earned through repeated alignment between message, conduct, evidence, and response.

Public digital conditions make this harder because attention is unstable. User identity numbers show scale, but scale alone does not produce understanding. Platform architecture rewards certain formats, speeds, and emotional patterns. Automation and hybrid accounts complicate interpretation. Stakeholders move across channels. Metrics can create comfort while hiding the wrong audience or the wrong meaning. Management must therefore place interpretation at the center of social media intelligence. The system should make leaders wiser, not merely better supplied with numbers.

5.2 The governed intelligence model

A governed intelligence model has four movements: sensing, interpreting, deciding, and learning. Sensing collects signals from social platforms, search behavior, reviews, direct messages, public comments, influencer discourse, community forums, employee voice, and stakeholder silence. Interpreting tests the signal against audience relevance, platform context, cultural meaning, sentiment reliability, historical pattern, and possible manipulation. Deciding moves the issue to a decision owner who can communicate, repair, escalate, or hold. Learning records what happened and adjusts the organization’s practice.

This model is deliberately managerial. It refuses to leave intelligence inside analytics software. Tools can gather and classify evidence, but organizations decide what the evidence means and what responsibility follows. The practical weakness in many institutions is not lack of dashboards. It is lack of decision ownership. A dashboard can report rising complaints for months while the underlying service problem continues. A governed model insists that repeated signals must cross into management review.

Governance also clarifies restraint. Not every comment deserves a public reply. Not every rumor should be amplified through correction. Not every negative sentiment score means crisis. Not every viral moment deserves imitation. The organization needs a scale of response: monitor, clarify, engage privately, respond publicly, correct formally, escalate operationally, pause content, investigate, or notify regulators. Mature social media intelligence is calm enough to choose the right level.

5.3 The limits of automation

Automation can make social media intelligence faster, but it cannot make it complete. Sentiment analysis, topic clustering, bot detection, social listening, content scheduling, predictive alerts, and generative drafting can all support communication teams. Their value depends on limits. A sentiment model may miss sarcasm or cultural language. A bot detector may misclassify hybrid behavior. A content tool may produce fluent language that lacks institutional judgment. A predictive alert may overstate risk because it sees volume but not meaning.

Ng et al. (2024) are important because cyborg accounts reveal how difficult it can be to classify digital behavior cleanly. Accounts may behave partly like bots and partly like humans. Strategic communication may involve automation supported by human intervention. This creates a warning for organizations reading social environments and for organizations producing their own content. The fact that a tool provides classification does not mean the classification is final. Human review remains essential where stakes are high.

Generative systems create a further concern. They can help draft variations, summarize comments, create first-pass categories, and support accessibility. Used carelessly, they may flatten voice, invent confidence, miss legal risk, or produce language that sounds polished without being true. In social media intelligence, AI should be placed under editorial control. The human responsibility is not optional. Stakeholders judge the organization, not the tool.

5.4 Operational implications

Operationally, social media intelligence must be connected to work routines. A weekly dashboard is not enough. The organization needs issue logs, escalation thresholds, evidence owners, response libraries, review meetings, correction protocols, and learning records. Communication teams should not be forced to carry operational failures as reputational problems. If comments reveal a recurring service fault, operations must own the repair. If questions reveal policy confusion, leadership must own clarification.

Executives have a special role because they set the appetite for truth. If senior leaders reward only positive metrics, teams will hide difficult signals or reframe them as engagement. If leaders punish bad news, intelligence weakens. A mature executive asks what the digital evidence reveals about stakeholders and operations. This does not mean reacting to every complaint. It means refusing to use communication as insulation against reality.

Communication teams also need authority. They cannot be responsible for credibility while being denied access to facts. They need timely input from legal, operations, customer service, human resources, product teams, academic units, clinical teams, or policy owners depending on sector. Without access to truth, communicators are asked to dress uncertainty as confidence. That is not strategy. It is reputational exposure.

5.5 Ethical boundaries

Ethical boundaries are part of intelligence quality. An organization that manipulates attention cannot claim mature intelligence simply because the numbers improve. Audience targeting, influencer use, paid amplification, employee advocacy, automation, and data collection all require governance. Stakeholders should not be deceived about sponsorship, identity, evidence, or institutional role. Sensitive data should not be exploited because a platform makes it visible. Publicly available information is not automatically ethically available for every organizational purpose.

In health, education, children’s services, financial services, political communication, public administration, and vulnerable communities, the ethical test becomes stricter. Complaints may contain private information. Patient or learner stories may require consent. Public anger may reflect genuine harm. Automated targeting may reinforce exclusion. A serious organization should build ethics into its social media intelligence process rather than treating ethics as a legal review at the end.

Legitimacy also requires correction. Mistakes will happen. The question is whether the organization corrects them with seriousness. A correction should be easy to find, clear about what changed, and honest enough to protect trust. Quietly deleting a misleading post may solve a platform problem while creating an integrity problem. Public credibility grows when stakeholders can see that the organization is willing to repair its own record.

Chapter 6: NYCAR Implementation Framework

6.1 Governance architecture

A workable social media intelligence system begins with governance architecture. The organization should define what it monitors, why it monitors, who owns each issue, how evidence is classified, which risks require escalation, and how decisions are recorded. Governance should be proportionate. A small professional institute does not need the same structure as a multinational corporation, but both need clarity. Ambiguity is costly when a complaint becomes visible, misinformation spreads, or a public question requires evidence.

A sound architecture should include five layers. The first is strategic purpose: what influence means for the organization. The second is evidence capture: which channels, stakeholder groups, and signal types are monitored. The third is interpretation: how signals are read, validated, and compared with context. The fourth is decision ownership: who can respond, repair, pause, escalate, or correct. The fifth is learning: how the organization reviews what happened and updates practice. Missing any layer weakens the system.

A governance charter should be short enough to use and strong enough to matter. It should define platform access, account security, approval authority, tone boundaries, disclosure rules, data handling, crisis roles, and escalation thresholds. It should also specify what the organization will not do: no fabricated testimonials, no undisclosed paid influence, no manipulative automation, no private-data exposure, no unsupported claims, and no content output that contradicts institutional evidence.

6.2 Roles, routines, and decision ownership

Roles should be named before pressure arrives. A social listening lead may gather evidence. A communication lead may interpret public meaning and propose response. An operational owner may address service failures. A legal or compliance adviser may review sensitive claims. A senior executive may approve high-risk statements. A data or technology specialist may test classification reliability. A records owner may preserve evidence. The aim is not bureaucracy. The aim is to remove confusion when timing matters.

Routine matters as much as role. A daily scan can identify urgent issues. A weekly intelligence review can examine patterns. A monthly leadership report can connect signals with organizational priorities. A quarterly audit can test data quality, response performance, audience relevance, and learning conversion. Each rhythm has a different purpose. The daily scan protects responsiveness. The weekly review supports interpretation. The monthly report guides management. The quarterly audit strengthens the system.

Decision ownership should follow the nature of the signal. A content correction belongs to communication and editorial review. A recurring complaint about delivery belongs to operations. A safety concern belongs to risk management. A learner’s confusion about academic policy belongs to academic administration. A pricing question belongs to finance and customer support. Social media intelligence fails when every issue is treated as a communication issue merely because it appeared on a platform.

6.3 Dashboard design for judgment

A good dashboard should not overwhelm leaders with numbers. It should help them make better decisions. The first page should separate four categories: visibility, relevance, credibility, and action. Visibility shows reach and engagement. Relevance shows whether the right audience was reached. Credibility shows trust indicators, sentiment reliability, correction needs, and source quality. Action shows what the organization did because of the evidence. This structure keeps the dashboard from becoming a vanity exhibit.

A useful dashboard should include qualitative notes. A sentiment score without explanation is not enough. The report should identify recurring themes, representative stakeholder questions, misinformation patterns, source credibility, platform movement, and recommended action. Screenshots may be needed for high-risk issues. Trend lines should be read beside narrative interpretation. A number tells the team that something moved; it rarely explains the movement by itself.

Color coding can help, but it should not replace judgment. A green metric may hide weak relevance. A red metric may reflect a small but legitimate stakeholder issue rather than crisis. Amber may show uncertainty requiring human review. Dashboards should therefore include a confidence rating. The team should say whether evidence confidence is high, moderate, or low, and why. That practice encourages humility and prevents false precision.

Table 4. Judgment-Centered Dashboard Fields

Dashboard field What it should show Decision value
Visibility Reach, impressions, engagement, channel movement. Shows whether the message entered public view.
Relevance Target audience fit, stakeholder segment, qualified attention. Shows whether the right people were reached.
Credibility Trust indicators, sentiment confidence, source quality, correction need. Shows whether attention is likely to support influence.
Action Escalations, operational repairs, content changes, stakeholder follow-up. Shows whether intelligence changed organizational behavior.

6.4 Escalation, crisis, and correction protocols

Escalation should be based on risk, not emotion. A complaint from one person may require urgent action if it involves safety, discrimination, legal exposure, vulnerable groups, data breach, or credible media interest. A large volume of criticism may require monitoring rather than immediate statement if the facts are uncertain and the pattern appears coordinated. The escalation protocol should define thresholds, but it should also allow professional judgment.

A crisis protocol should answer practical questions. Who confirms facts? Who approves a holding statement? Which channels are used first? Who monitors misinformation? When should content be paused? What documentation is preserved? How are employees informed before public statements create internal confusion? How are corrections handled if the first statement changes? These questions should not be improvised under public pressure.

Correction discipline is central to credibility. A correction should not bury responsibility under vague wording. It should identify the issue, provide the accurate information, explain what has been changed where necessary, and give stakeholders a reliable route for follow-up. The organization should avoid defensive language that blames misunderstanding when the original communication was unclear. A dignified correction often protects trust more effectively than a perfect-looking silence.

6.5 Content discipline and stakeholder relevance

Content discipline begins with audience relevance. The organization should know who each message is for, why the message matters, and what action or understanding should follow. A content calendar that merely fills days is not a strategy. Every post should have a reason connected to stakeholder need, institutional purpose, service improvement, evidence, or relationship building. Silence can be better than output that weakens seriousness.

Tone should fit institutional character. A professional body can be warm without becoming casual. A public agency can be accessible without sounding unserious. A start-up can be lively without overclaiming. A university can use contemporary formats without reducing knowledge to slogans. The strongest content speaks in a human voice while respecting the weight of the subject. Social media intelligence helps by revealing when tone builds trust and when it creates fatigue.

Stakeholder relevance also means accessibility. Clear language, captions, image descriptions, readable design, translated summaries where appropriate, and practical links can determine whether a message actually serves the audience. A beautiful post that excludes people is not effective communication. Digital influence should not be measured only by reaction from those already comfortable with the platform or language. Serious organizations widen understanding rather than merely reward the already engaged.

6.6 Quality assurance for social media intelligence

A serious social media intelligence system needs quality assurance because the field is exposed to error at several points. Collection error occurs when the organization monitors the wrong platform, misses a private community where real discussion is happening, or overreads a channel used by a vocal minority. Classification error occurs when sentiment tools or human reviewers misread sarcasm, cultural language, coordinated activity, or ordinary frustration. Interpretation error occurs when managers treat a visible reaction as representative of the whole stakeholder group. Action error occurs when the organization responds publicly when operational repair would have mattered more.

Quality assurance should be built into routine practice. A sample of automated classifications should be checked by human reviewers. Sensitive issues should be read by people who understand the cultural and institutional setting. The team should track false alarms, missed signals, poor escalations, and weak corrections. Each problem should become a system lesson. Quality does not mean that every judgment will be perfect. It means errors are studied instead of repeated.

Documentation is part of quality. The organization should keep records of major issues, evidence used, decisions made, messages approved, corrections issued, and lessons learned. These records protect continuity when staff change. They also support accountability. A memoryless communication system is always vulnerable to the same preventable crisis. Good documentation turns experience into institutional knowledge.

Table 5. Ninety-Day Social Media Intelligence Playbook

Period Main task Expected output
Days 1–30 Audit platforms, stakeholders, metrics, account security, and recurring questions. Baseline SMICI score and issue map.
Days 31–60 Build governance rules, escalation routes, dashboard structure, and response standards. Approved operating protocol and dashboard template.
Days 61–90 Run intelligence reviews, test classification reliability, and conduct a crisis simulation. Improvement report and next-cycle action plan.

6.7 Ninety-day implementation playbook

During the first thirty days, the organization should focus on diagnosis. The organization should audit existing platforms, audience groups, account security, approval processes, recurring stakeholder questions, current metrics, and response history. The Social Media Intelligence Conversion Index can be scored honestly at this stage. The purpose is not to produce an impressive number. It is to expose weak points before the organization expands its digital activity.

Days thirty-one to sixty should focus on design. Governance rules, escalation pathways, dashboard structure, response templates, correction standards, and decision-owner responsibilities should be written and tested. The organization should also define a small set of influence outcomes that match its mission. A school may track inquiry clarity and learner trust. A hospital may track patient guidance and complaint resolution. A B2B firm may track qualified engagement and decision-maker education.

Days sixty-one to ninety should focus on practice. The organization should run weekly intelligence reviews, test classification reliability, conduct a crisis simulation, and evaluate whether insights reach decision owners. At the end of ninety days, leadership should review the system against four questions: what signals were missed, what signals were overread, what internal decisions improved, and what should change in the next cycle. The playbook is deliberately practical. Social media intelligence grows through disciplined routine, not grand language.


Chapter 7: Recommendations, Research Contribution, and Final Position

7.1 Recommendations for executive leadership

Executive leaders should treat social media intelligence as part of governance, not as a junior publicity function. They should ask for evidence that connects digital signals to stakeholder trust, service repair, policy clarity, recruitment quality, reputation protection, or organizational learning. Reports should show what the organization learned and what changed because of that learning. A leadership team that asks only for reach and engagement will train the organization to manage appearances.

Senior leadership should also protect truth-telling. Communication teams must be able to report weak signals, emerging distrust, unanswered questions, and recurring complaints without fear that bad news will be punished. The point of intelligence is not to flatter the organization. It is to help the organization see earlier and act better. Leaders who want only positive dashboards do not have an intelligence system. They have a decoration.

Investment decisions should follow capability gaps. If the SMICI review shows weak learning conversion, buying a more expensive listening tool may not solve the problem. If audience relevance is weak, more content may not help. If credibility is fragile, influencer spending may expose rather than strengthen the institution. Executive discipline means strengthening the weakest part of the conversion chain, not funding the most visible activity.

7.2 Recommendations for communication teams

Communication teams should build their work around stakeholder meaning. Every major message should state the audience, purpose, evidence, likely questions, risk level, and follow-up route. Teams should maintain issue libraries for recurring questions and approved evidence sources for common claims. They should also keep correction templates ready, not because mistakes are expected, but because responsible correction is part of professional communication.

Digital content should be varied without becoming erratic. Explainers, evidence notes, short videos, case examples, stakeholder answers, research summaries, service updates, leadership messages, and community responses can all have a place. The mix should serve the organization’s purpose. A team should not imitate a platform trend simply because it is popular. The question should remain: does this content strengthen trust with the right audience?

Communication teams should insist on internal access. They cannot answer stakeholder questions responsibly if they are kept away from operational facts. A post about service quality requires service evidence. A public statement about education quality requires academic evidence. A response about access requires operational reality. Professional communicators should resist being used to cover gaps that the organization has not repaired.

7.3 Recommendations for analytics and technology teams

Analytics and technology teams should design measurement systems that reveal decision value rather than reporting volume alone. They should separate raw attention from relevant attention, positive sentiment from trusted influence, and comment volume from stakeholder significance. Models should include confidence levels, data limitations, and human-review notes. Precision should not be performed where the evidence is uncertain.

Automated tools should be audited. Sentiment classifications should be sampled. Topic clusters should be reviewed for cultural meaning. Bot or cyborg indicators should be treated as risk signals rather than final proof. Generative summaries should be checked against source material before being used in management reports. Technology should widen the organization’s ability to see, but human judgment should decide what the seeing means.

Data ethics should sit inside the analytics function. Teams should define retention periods, access rules, sensitive-topic handling, consent concerns, and boundaries around profiling. Public comments may be visible, but visibility does not remove responsibility. An organization that wants trust should not use social media intelligence in ways that stakeholders would consider intrusive, manipulative, or unfair.

7.4 Recommendations for public-facing institutions

Public-facing institutions should design social media intelligence around service and trust. Universities, hospitals, agencies, professional bodies, and research centers should read stakeholder questions as evidence of what the public needs to understand. Their strongest digital work may not be the most entertaining. It may be the most useful, clear, accurate, and consistent. Institutional credibility grows through repeated proof of seriousness.

These institutions should also distinguish between public explanation and public performance. A public agency does not need to sound like a consumer brand. A hospital does not need to turn safety into entertainment. A research center does not need to chase every trend. Adaptation to platform language is useful, but identity must remain intact. The public should experience the institution as reachable and credible at the same time.

Transparency should be improved where stakeholders repeatedly ask the same questions. Admission rules, prices, eligibility, deadlines, service access, complaint routes, safety instructions, research methods, and accreditation status should be easy to find and easy to understand. Social media intelligence should not merely respond to confusion after it appears. It should help the institution remove avoidable confusion before it becomes public frustration.

7.5 Research limitations and future study

This publication has limits. It develops an applied framework and model specifications rather than estimating coefficients from a private organizational dataset. The proposed weights in the Social Media Intelligence Conversion Index are starting values and should be calibrated by sector. The models cannot solve poor data quality, weak leadership discipline, or unethical communication practice. They can clarify the questions managers should ask, but they cannot guarantee wise answers.

Future research can test the framework with organizational datasets across sectors. Universities, hospitals, SMEs, B2B firms, public agencies, and media organizations could each define influence outcomes and estimate how social media intelligence capability relates to trust, inquiry quality, complaint resolution, conversion, or reputation recovery. Comparative studies could examine whether learning conversion is the missing variable between social listening and performance. Further work is also needed on multilingual sentiment reliability and ethical uses of AI-supported social media intelligence.

Another useful direction is crisis memory. Organizations often learn after a digital crisis but fail to preserve the lesson. Longitudinal studies could examine how issue logs, correction archives, and escalation protocols affect future response quality. Research could also test whether executive incentives change metric selection. If leaders reward vanity metrics, teams may optimize for visibility; if leaders reward learning, teams may design better intelligence systems.

7.6 Final position

Social media has made organizations more visible, but visibility has not made them wiser. The central managerial task is no longer to appear online. Most organizations already appear online. The harder task is to read public signals with discipline, answer stakeholders with evidence, protect institutional character, and let digital evidence improve the organization behind the message. That is the difference between publicity and intelligence.

Influence is not the loudest post, the largest audience, or the fastest reply. It is the stakeholder’s reasonable confidence that the organization knows what it is saying, can support its claims, respects the audience, and acts consistently with its public language. That confidence cannot be manufactured by metrics. It is built through repeated alignment between evidence, conduct, and communication.

The final position is clear. Social media intelligence should sit inside organizational governance as a disciplined capability. It should help leaders listen without panic, measure without vanity, respond without carelessness, and learn without defensiveness. Used well, it turns digital conversation into early warning, stakeholder education, service improvement, and strategic credibility. Used poorly, it becomes another machine for noise. The organizations that will lead in public digital environments are not those that post the most. They are those that understand what the public is telling them and have the courage to act on it.

References

Agnihotri, R., Afshar Bakeshloo, K., & Mani, S. (2023). Social media analytics for business-to-business marketing. Industrial Marketing Management, 115, 110–126. https://doi.org/10.1016/j.indmarman.2023.09.012

Ascani, I., & Ancillai, C. (2025). Social media marketing and performance measurement: Does it take two to tango? Review of Managerial Science, 20, 775–823. https://doi.org/10.1007/s11846-025-00891-0

Bruce, E., Shurong, Z., Amoah, J., Egala, S. B., Sarfo, P. A., Baidoo, B. E., Darko, D. A., Ailing, L., & Yongxing, Y. (2025). Examining the impact of social media usage on start-ups performance: Mediating role of brand image. PLOS ONE, 20(5), Article e0320133. https://doi.org/10.1371/journal.pone.0320133

DataReportal. (2026). Global social media statistics. Retrieved June 10, 2026, from https://datareportal.com/social-media-users

Dwivedi, Y. K., Ismagilova, E., Hughes, D. L., Carlson, J., Filieri, R., Jacobson, J., Jain, V., Karjaluoto, H., Kefi, H., Krishen, A. S., Kumar, V., Rahman, M. M., Raman, R., Rauschnabel, P. A., Rowley, J., Salo, J., Tran, G. A., & Wang, Y. (2021). Setting the future of digital and social media marketing research: Perspectives and research propositions. International Journal of Information Management, 59, 102168. https://doi.org/10.1016/j.ijinfomgt.2020.102168

Ng, L. H. X., Robertson, D. C., & Carley, K. M. (2024). Cyborgs for strategic communication on social media. Big Data & Society, 11(1). https://doi.org/10.1177/20539517241231275

Sharabati, A. A. A., Al-Haddad, S., Al-Khasawneh, M., & Nababteh, N. (2024). The impact of digital marketing on the performance of SMEs: An analytical study in light of modern digital transformations. Sustainability, 16(19), 8667. https://doi.org/10.3390/su16198667

Tkalac Verčič, A., Verčič, D., Čož, S., & Špoljarić, A. (2024). A systematic review of digital internal communication. Public Relations Review, 50(1), Article 102400. https://doi.org/10.1016/j.pubrev.2023.102400

Wuersch, L., Neher, A., Maley, J. F., & Peter, M. K. (2024). Using a digital internal communication strategy for digital capability development. International Journal of Strategic Communication, 18(3), 167–188. https://doi.org/10.1080/1553118X.2024.2330405

The Thinkers’ Review