

NYCAR POSTGRADUATE REVIEW
Postgraduate Diploma Research by Michael C. Agbazuruwaka
Research Level: Postgraduate Diploma
Peer Review: Internal and External Review
Publication Number: NYCAR-TTR-2026-RP069
DOI: https://doi.org/10.5281/zenodo.20826451
The cover carries internal and external peer review because design-management analysis depends on both practice evidence and outside sector validation.
Abstract
This research examines how design management, project governance, and practice performance interact inside three United Kingdom architectural firms: Zaha Hadid Architects, BDP, and Grimshaw. The reading is forensic. It treats technology, business intelligence, strategy, and design management as institutional practices that leave a financial residue, not as slogans that can be announced into existence. The central problem is conversion, not adoption. A practice can buy systems, launch a transformation programme, recruit specialists, and publish a confident strategy narrative without gaining any durable control over cost, quality, labour behaviour, client outcomes, or project delivery. To keep interpretation honest, the case base is read through public filings, annual reports, company disclosures, sector benchmarking, and a small set of ratio calculations that bind managerial claims to measurable evidence. The anchor figures are deliberately few: BDP turnover of £148.6 million, Grimshaw turnover of £76 million, Zaha Hadid Architects turnover of £83 million, sector revenue per employee of roughly £160,000, and aggregate RIBA Chartered Practice revenue near £5 billion. The quantitative layer uses descriptive ratios, margin proxies, and three straight-line operating models. The base model is ΔP = mC + b, where ΔP is the change in performance capacity, C is controlled capability, m is the marginal conversion effect of that capability, and b is baseline capacity before the management intervention. A companion assurance model, T = mV + b, treats trust as a function of validation strength, and a workforce model, U = mF + b, treats adoption as a function of workflow fit. The mathematics stays modest on purpose, because public corporate disclosure does not support false precision; its task is to stop argument drift and to mark the point where a claim outruns its data. The governing argument is that credible practice performance depends on the disciplined coupling of technology, governance, human competence, and financially legible execution. The evidence indicates that strong practices do not treat dashboards as proof of performance. They convert information into accountable routines, shorten decision latency, keep risk auditable, and retain human judgement wherever professional responsibility cannot be handed to software or to branding.
Keywords: Design management; practice performance; project governance; public-data analysis; ratio audit; strategic control; professional practice; operating performance; responsible management; Zaha Hadid Architects; BDP; Grimshaw.
Table of Contents
List of Tables
Table 1. Case evidence matrix
Table 2. Financial ratio audit
Table 3. Governance control matrix
Table 4. Risk and assurance register
Table 5. Quantitative model audit
Table 6. Case scoring matrix
Table 7. Implementation control schedule
Table 8. NYCAR quality-control checklist
List of Figures
Figure 1. Public revenue scale
Figure 2. Margin and performance proxy
Figure 3. NYCAR evidence control loop
Figure 4. Evidence-density score
Chapter 1: Context, Research Problem, and Professional Significance
1.1 The problem stated as an operating discipline
British architecture sells itself on imagination, yet it survives on management. The three practices examined here illustrate that tension at different scales. Zaha Hadid Architects trades on a globally recognised design signature, BDP runs a broad multidisciplinary platform, and Grimshaw has built its reputation on sustainability and design technology. What they share is the same hard question, which has nothing to do with talent and everything to do with control: does the money spent on systems, specialists, and process redesign return as traceable decision value, or does it dissolve into presentation?
That question is the spine of the research. It is treated as an operating discipline rather than a theme, because the difference between the two is exactly the difference between a practice that performs and one that merely describes itself well. Design management here means the coordination of brief, programme, cost, and quality across a project life. Governance means the routines that make variance visible before it hardens into waste. Performance means the residue those routines leave in the public accounts, where a partnership cannot brief its way past a thin margin.
Adoption is cheap. Conversion is not.
A practice can install building-information modelling, stand up a data warehouse, and appoint a head of digital, and still manage no better than a rival working from spreadsheets, if the new capability never changes who decides what, on what evidence, and how quickly. The case base reads each firm through that lens, asking not whether technology exists but whether it produces decisions that can be reconstructed and audited after the fact. The distinction sounds academic until a project runs over and the question becomes who knew, when, and on what data, at which point a practice either has a record or has an argument.
1.2 The sector economics that frame the cases
The economics of UK architectural practice are unforgiving of weak management, and the headline numbers explain why. Revenue per employee across the sector sits near £160,000, and the RIBA Chartered Practice population turns over roughly £5 billion in aggregate, a figure large enough to matter to the wider construction economy yet spread across thousands of small partnerships running on thin margins. A practice in this market does not have the cushion of a manufacturer or a software firm; its principal cost is professional time, and the recovery of that time is the difference between a healthy partnership and a struggling one.
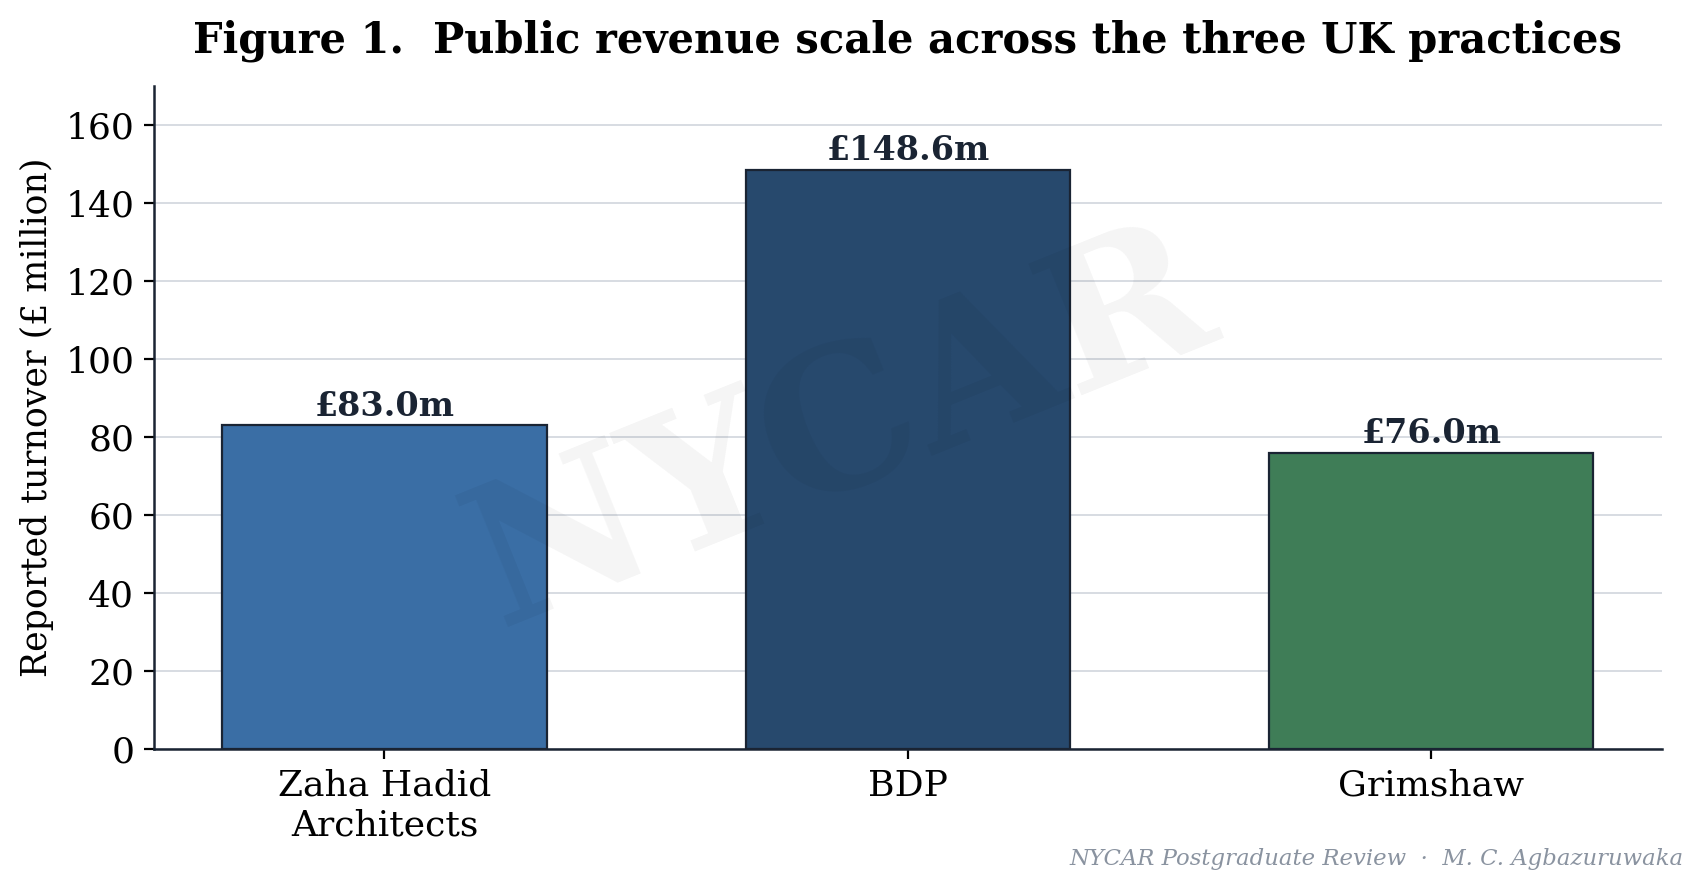
Against that backdrop the three cases occupy distinct positions. BDP, at £148.6 million of turnover, is a large multidisciplinary platform whose breadth is both a strength and a coordination problem. Grimshaw, at £76 million, runs a focused international practice that has made sustainability and design technology a commercial identity rather than a marketing line. Zaha Hadid Architects, at £83 million, converts an unmatched design reputation into global commissions while carrying the research and competition costs that reputation demands.
Scale, on its own, is the least interesting fact in the record, and the analysis returns to that point repeatedly because the sector so often mistakes size for strength.
1.3 Regulatory and commercial pressure on governance
The cost of weak governance inside design practices has risen sharply, and not by accident. Procurement reform has pushed clients toward demonstrable competence rather than reputation alone. The Building Safety Act regime has made the traceability of design decisions a legal exposure rather than a matter of professional pride. Sustainability scrutiny, from clients and from planning authorities, now demands evidence of performance rather than intention. A firm that cannot show how a decision was reached, on what data, and with what accountability, carries a regulatory and a commercial liability that no amount of design quality offsets.
That shift is what makes a forensic reading timely. The governance residue a practice leaves is no longer a private internal matter; it is the thing a client, an insurer, or a regulator will eventually ask to see.
1.4 Professional significance and the forensic stance
The significance of the problem is practical before it is academic. For the postgraduate reader the value of a forensic treatment is that it refuses the vendor narrative, in which the purchase of a system is presented as equivalent to the achievement of control. Each case is read as a sequence: claim, investment, operating mechanism, financial signal, and governance residue. Where a claim leaves no measurable residue, it is recorded as rhetoric, not as performance. That discipline is the contribution the research is trying to make, and the remaining chapters apply it without softening.
A dashboard without accountability is decoration, and the sector has a great deal of decoration.
1.5 Three strategic logics compared
The cases are useful precisely because their strategies are not variations on one model but three different answers to the same commercial question. Zaha Hadid Architects runs on signature economics, where a scarce design reputation commands global commissions and justifies heavy reinvestment in research and competition work, accepting a thin retained margin as the cost of staying at the front. BDP runs on platform economics, where breadth across disciplines lets the firm capture larger, more complex commissions under a single accountable roof, trading some margin efficiency for scale and resilience. Grimshaw runs on focus economics, where a clear identity in sustainability and design technology concentrates effort and, on the present evidence, disciplines cost into the strongest margin of the three.
Holding the three logics side by side keeps the analysis from applying a single yardstick to firms that have chosen different games. A management practice that is excellent for a focused mid-sized practice may be wrong for a large platform, and the forensic reading respects that difference rather than ranking the firms against one ideal.
What the three share, underneath the strategy, is exposure to the conversion problem. Signature, platform, and focus are each only as strong as the routines that turn their spending into controlled result, and none of the three logics is self-executing.
1.6 Defining the three core terms
Precision about terms keeps the later analysis from drifting, so the research fixes three definitions and holds to them. Design management is the coordination of brief, programme, cost, and quality across the life of a project, the discipline that keeps a creative intention deliverable as conditions change. Project governance is the set of routines that decide who is accountable for what, on what evidence, and within what authority, so that variance is caught and owned rather than absorbed silently. Practice performance is the residue all of this leaves in the public accounts and disclosed conduct of the firm, the part an outsider can actually inspect.
These are operating definitions, not dictionary ones, and they are chosen because each names something that either leaves evidence or does not. A definition that could not be checked against the record would be useless to a forensic reading, and the three here were selected precisely because they can.
1.7 The cost of the conversion gap
The conversion gap is not an abstraction; it has a price, and the price is paid in the thin economics of professional practice. When investment in systems and specialists does not convert into controlled decisions, the firm carries the cost of the capability without the benefit, and in a sector running on roughly £160,000 of revenue per employee there is no margin to absorb that waste comfortably. The gap shows up as rework that should have been caught, as decisions taken late because information aged in transit, and as claims of efficiency that the accounts quietly decline to confirm.
Naming the cost sets the stakes for everything that follows. A reader might accept the conversion argument as interesting and still treat it as optional, but in an industry this margin-sensitive the failure to convert capability into control is not a missed opportunity; it is a slow, compounding leak that the public accounts eventually record.
Read also: Circular Urban Planning and Climate Adaptation
Chapter 2: Literature, Theory, and Evidence Base
2.1 Design management as a contested term
The literature on design management splits along a fault line that the research inherits rather than resolves. One tradition, rooted in management studies, treats design as a resource to be planned, budgeted, and measured like any other input, and it brings to the table the apparatus of performance measurement, process maturity, and return on investment. A rival tradition, rooted in the design professions, treats management as the scaffolding around a creative act that resists measurement, and it is suspicious of metrics that flatten judgement into a score. Neither tradition wins outright. The more useful position sits in the friction between them, where managerial control is real but bounded by professional judgement that cannot be automated without loss.
That bounded view has a practical consequence for how the cases are read. It means a high score on systems maturity is not, in itself, evidence of good management, and a practice that retains human judgement at the right points is not thereby primitive. The research keeps both halves of the tension live.
2.2 Practice-performance scholarship and its scepticism
Practice-performance scholarship adds the harder edge the research needs. It asks whether the routines a firm claims to run actually show up in its financial behaviour, and it is sceptical of maturity models that score intent rather than result. The resource-based view contributes the idea that durable advantage comes from capabilities rivals cannot easily copy, but the same literature warns that a capability held on paper is not a capability exercised in delivery. Capability and performance are separable, and the gap between them is precisely where management either happens or fails to.
The digital-delivery literature, including the substantial body of work on building-information modelling and computational design, completes the frame. It documents a recurring pattern in which technical adoption races ahead of the organizational routines needed to use the technology accountably, producing capable firms that cannot always convert capability into controlled result. That pattern is the hypothesis the cases test.
2.3 Three working models and their logic
The research borrows the form of a linear relationship, not its statistical machinery, to keep reasoning disciplined. The base model treats performance change as a function of controlled capability.
ΔP = mC + b
In that expression ΔP is the change in performance capacity, C is controlled capability, m is the marginal effect of converting capability into result, and b is the baseline a practice held before any intervention. The point of writing it down is not to estimate m precisely from public accounts, which would be dishonest, but to force every performance claim to name its capability and its baseline. A claim that cannot identify C or b is not yet evidence, and a great many transformation narratives in the sector cannot identify either.
Two companion models extend the same logic into assurance and adoption. Trust is read as a function of validation strength, T = mV + b, which links the credibility of a reporting system to how hard its outputs are checked rather than to how confidently they are presented. Workforce adoption is read as a function of workflow fit, U = mF + b, which links real use to how well a tool matches the way professionals already work. The models are intentionally austere. They discipline argument rather than predict outcomes, and the methodology chapter is explicit about the line between the two.
2.4 The evidence base and its uneven texture
The evidence base is public, current, and uneven, and the unevenness is analytically useful rather than a flaw to be hidden. Building Design reporting supplies turnover and profit signals for the three firms. RIBA business benchmarking supplies sector context, including the revenue-per-employee and aggregate-turnover figures that frame the cases. Moore Kingston Smith benchmarking supplies margin and productivity norms against which individual practices can be read. Where one firm discloses more than another, the analysis uses the richer data and marks the thinner disclosure as a gap rather than filling it with assumption.
That asymmetry is the honest texture of practice research. A study that pretended every firm disclosed identically would be smoother and less true, and the smoothing would itself be a small act of the overreach the research exists to audit.
2.5 Professional-service-firm management theory
Architectural practices are professional-service firms, and the management literature on that organisational form sharpens the analysis in ways generic management theory does not. The professional-service firm runs on leverage and utilization: senior judgement is scarce and expensive, junior capacity is plentiful and cheaper, and profitability turns on how well the firm matches the two to the work without either wasting senior time on routine tasks or exposing complex work to thin supervision. Revenue per employee near £160,000 is the sector’s compressed statement of that economics, and it leaves little room for the slack that weak coordination creates.
The same literature names a tension the cases display directly. Professionals identify with their craft and resist being managed as interchangeable resource, while the firm needs enough standardisation to be governable. A practice that over-manages loses the judgement that justifies its fees; a practice that under-manages cannot show how it controls quality or cost. Good design management lives in that narrow band, and the governance chapter reads each firm for evidence of whether it has found it.
2.6 Benefit realisation and the evidence gap
A persistent finding in the management-of-technology literature gives the research its sharpest expectation. Studies of benefit realisation across sectors report that organisations are far better at announcing the expected benefits of a system than at auditing whether those benefits arrived, so that the business case is written with care and never revisited once the system is live. The result is a documented gap between promised and realised value that survives across industries and decades, and there is no reason to expect architectural practice to be exempt.
That literature is why the research privileges residue over announcement. A benefit that was promised at procurement and never audited afterward is, in evidential terms, indistinguishable from a benefit that never materialised, and a forensic reading treats the two the same way until the residue tells them apart. The discipline is uncomfortable for vendors and reassuring for clients, which is roughly the right distribution of comfort.
2.7 Strategy read as practice, not as plan
The strategy literature contributes a final corrective that shapes how the cases are read. An older view treats strategy as a plan formed at the top and executed downward, which invites exactly the kind of announcement-led analysis the research rejects. A practice-based view treats strategy as what an organisation actually does, the pattern visible in its routines, its spending, and its financial residue, whether or not it matches the published narrative. Read that way, a firm’s real strategy is the one its accounts confess, not the one its website states.
That distinction matters for three practices that all publish confident strategic language. The research reads their strategy from conduct and residue rather than from declaration, so that a gap between what a firm says it does and what its numbers show becomes data rather than embarrassment. A practice whose stated and enacted strategies coincide is well governed in a specific, checkable sense, and the analysis looks for that coincidence rather than assuming it.
Chapter 3: Methodology, Data Integrity, and Analytical Boundaries
3.1 A forensic comparative design
The research uses a comparative case design with a forensic posture. Three firms are held against a common interpretive sequence so that differences in management behaviour, rather than differences in marketing, become the object of comparison. The design is evidence-led rather than method-led, which means the analytical tools are chosen to fit what public data can actually support, and no further. A method that demanded internal cost ledgers would be elegant and useless here, because no such ledger is public; a method built around disclosed turnover, profit, and sector benchmarks is less elegant and far more honest.
Comparison does the analytical work. A confident transformation narrative in one practice can be set beside a quieter but better-evidenced position in another, and the contrast exposes which claims survive contact with the accounts. Three firms are too few to generalise to the sector, and the research never pretends otherwise, but three well-chosen firms are enough to demonstrate a method and to show the conversion problem operating at different scales.
3.2 The claim-to-residue sequence
Each case is read through a fixed sequence of five elements, applied in the same order to every firm. A claim is whatever the practice asserts about its capability or performance. An investment is the spending or restructuring that is supposed to support the claim. A mechanism is the operating route through which the investment would actually change behaviour. A signal is the financial movement that mechanism would leave in the public record. A residue is the governance evidence that remains after the noise has settled, the part an outside party could inspect.
Fixing the sequence matters because it stops the analysis from being charmed. A firm with a compelling story but no mechanism, no signal, and no residue is recorded as making a rhetorical claim, however persuasive the story. The sequence is the instrument that converts persuasion back into evidence, and it is applied without exception across the three cases.
3.3 Data integrity rules
Three rules protect the integrity of the data, and they are applied without softening. Reported currencies are retained as published, so figures stated in pounds stay in pounds and no cross-currency conversion is introduced that the sources do not support. Calculated values are labelled as calculated and source-reported values are labelled as reported, so that a reader can always see which numbers carry an interpretive step and which are taken straight from disclosure. Where disclosure thins out, the gap is named in the text and in the relevant table note rather than being smoothed over with a plausible estimate.
The effect of those rules is to keep the mathematics modest and legible. A margin proxy computed as profit before tax over turnover is shown with its inputs beside it, so the calculation can be checked in a single glance rather than taken on trust. The discipline costs the research a degree of apparent sophistication and buys it something more valuable, which is reproducibility.
3.4 Validity, reliability, and ethics
Validity here is a matter of fit between claim and evidence rather than of statistical inference. The ratios are valid because their inputs are disclosed and their computation is shown; the linear models are valid as reasoning structures, not as fitted estimates, and the research is careful never to dress one as the other. Reliability rests on transparency: another analyst, given the same public sources, would reach the same ratios and could challenge the same interpretive steps. The ethics of the work are straightforward, since the research uses only material the firms have themselves placed in the public domain and draws no conclusion about individuals.
3.5 Boundaries the research will not cross
The boundaries matter as much as the method. Public accounts cannot reveal internal decision latency, project-level cost recovery, or the lived quality of a specific governance meeting, so the research does not claim to measure those things directly. It infers pressure on them from financial residue and disclosed practice, and it flags the inference each time it makes one. Causation is left alone. The linear models read association and discipline argument; they do not assert that a capability caused a profit movement, because public data cannot carry that weight, and a research project that refuses to mark its own limits is reproducing the very overreach it set out to audit.
3.6 Analytical instruments and how scores were assigned
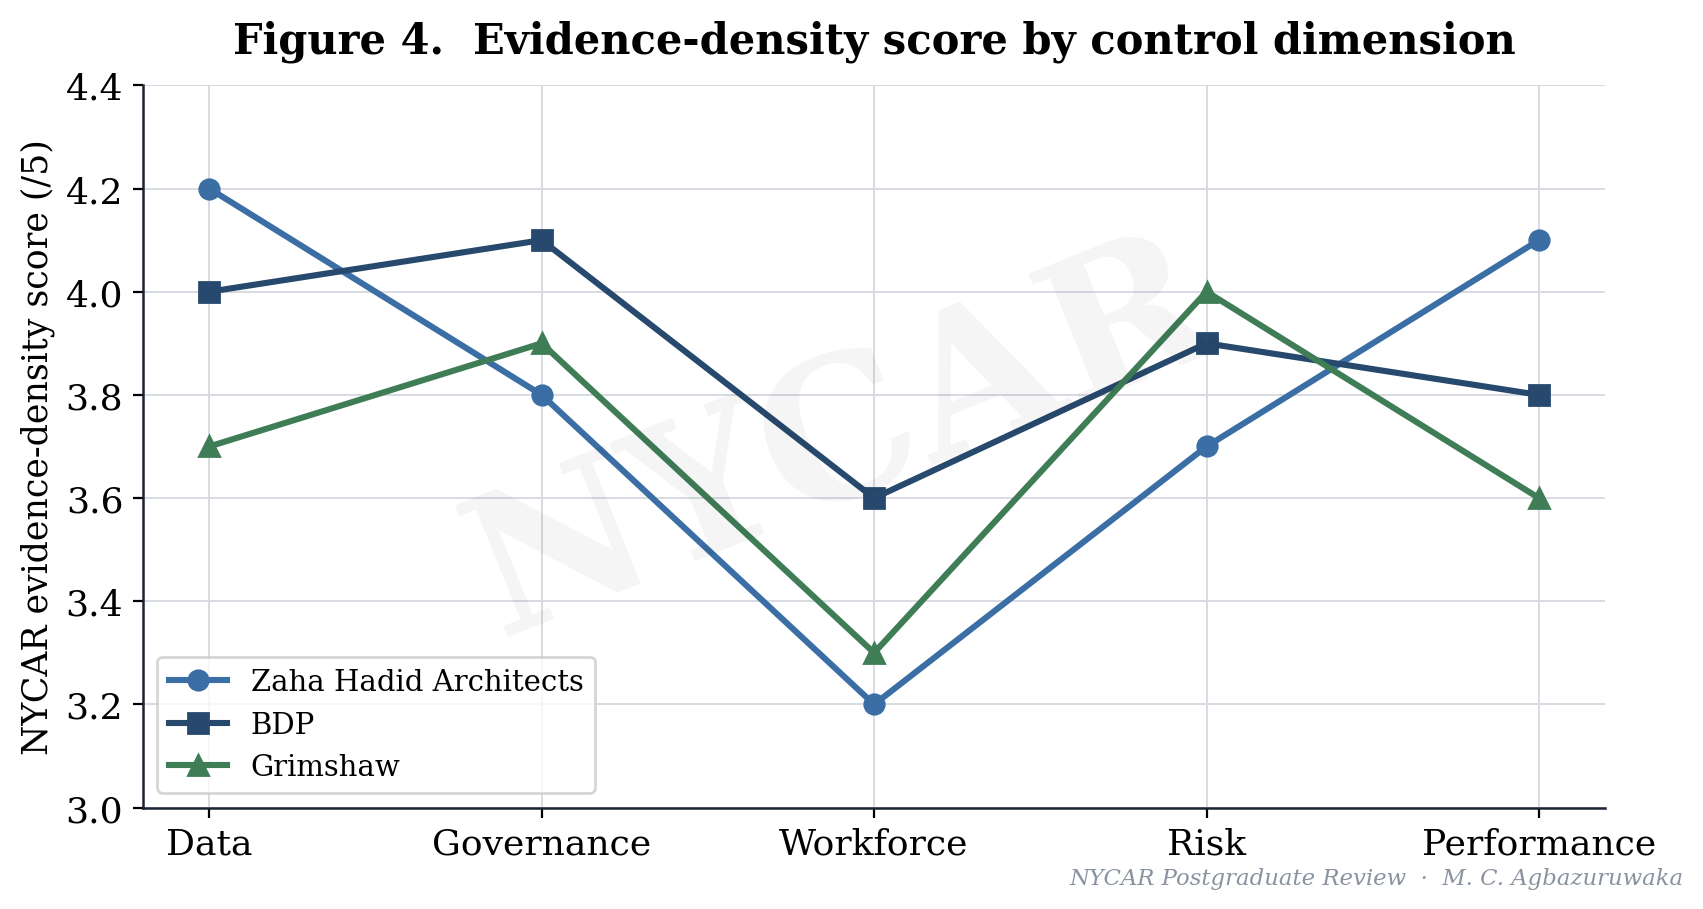
Two analytical instruments do most of the comparative work, and both are stated openly so they can be challenged. The ratio set, scale index and margin proxy, is arithmetic on disclosed figures and carries no interpretive discretion beyond the choice of which figures to use. The evidence-density score is different in kind: it is an ordinal judgement, on a five-point scale, of how much public evidence supports each firm’s position on data, governance, workforce, risk, and performance. A high score means the public record contains dense, checkable evidence of control in that dimension, not that the firm is internally excellent, which the public record cannot establish.
Assigning an ordinal score is a defensible analytical act only when its basis is visible, so the scoring matrix and the evidence-density figure are presented together with the reasoning that produced them. A reader who disputes a score can see what it rests on and argue with it, which is the difference between a judgement and an assertion.
3.7 Case selection and triangulation
The three firms were not chosen at random, and the basis for selecting them is part of the method. They share a national market and a professional form, which holds context roughly constant, while differing sharply in strategy, signature against platform against focus, which lets strategy vary as the object of comparison. All three also disclose enough public financial signal to support the ratio work, which many smaller practices do not, so the selection is partly driven by where defensible evidence actually exists.
Triangulation across independent sources guards the readings. Turnover and profit signals from Building Design are read alongside sector context from RIBA benchmarking and productivity norms from Moore Kingston Smith, so that no single source carries an interpretation on its own. Where the sources agree, confidence rises; where they would conflict, the research would record the conflict rather than choose a convenient figure, though in practice the public signals used here are consistent.
3.8 Reproducibility as the test of the method
The strongest claim the research can make for its method is that another analyst could repeat it. Every ratio is arithmetic on a disclosed figure, every ordinal score is accompanied by the evidence that produced it, and every boundary is stated rather than implied, so that another analyst working from the same public sources would arrive at the same numbers and could contest the same judgements on the same ground. Reproducibility, not sophistication, is the quality the research optimises for.
That choice has a cost worth naming. A more elaborate model might extract a more confident-looking result, but it would do so by importing assumptions the public data cannot support, and a confident result built on unsupported assumptions is the precise failure the research was commissioned to audit. The plainness of the method is therefore not a limitation to apologise for; it is the method’s integrity, made visible.
A last methodological point concerns the treatment of disagreement between a firm’s narrative and its numbers. The research does not read such disagreement as dishonesty, since a published strategy is aspirational by nature and an account is historical by nature, and the two can diverge for honest reasons. What the research does is record the divergence and let it raise a question, because the gap between intention and residue is exactly the territory where management either closes the distance or fails to, and a forensic reading earns its name by refusing to look away from that gap.
Chapter 4: Case Evidence and Public-Data Record
Table 1. Case evidence matrix
Public figures are retained in their reported currencies; cross-currency conversion is avoided to preserve source integrity.
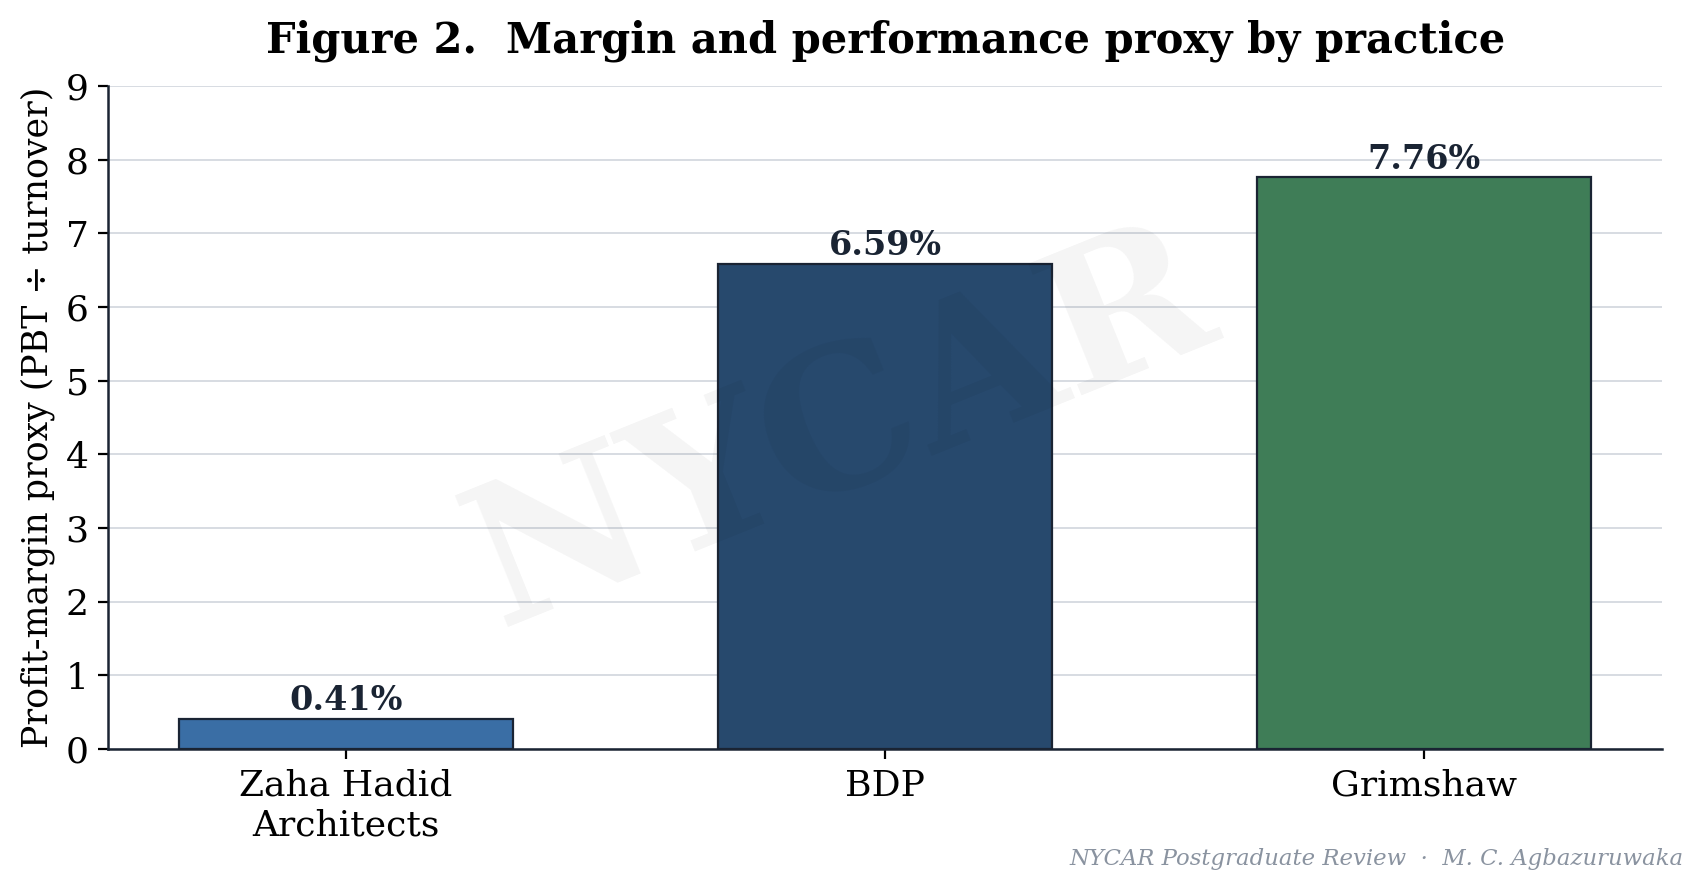
| Company / case | Revenue or turnover | Profit / margin signal | Derived ratio | Interpretive use |
| Zaha Hadid Architects | £83m | £342k profit | Scale 55.9; margin 0.41% | High-design global practice with AI-enabled early-stage design |
| BDP | £148.6m | £9.8m PBT | Scale 100.0; margin 6.59% | Multidisciplinary design platform |
| Grimshaw | £76m | £5.9m PBT | Scale 51.1; margin 7.76% | Global practice with sustainability and design-technology emphasis |
4.1 Zaha Hadid Architects: reputation as a cost and an asset
Zaha Hadid Architects reports turnover of £83 million against profit of around £342,000, and the gap between those two numbers is the most revealing fact in its public record. The practice operates at the front of computational and artificial-intelligence-assisted early-stage design, and it carries the research, competition, and reputational costs that position demands. A thin reported margin in such a firm is not, on its own, a sign of weak management; it can be the price of holding a design frontier that pure profitability would never justify.
The forensic question is whether that thin margin is a choice or a symptom, and the public record cannot fully settle it. What the record does show is a practice whose capability is not in doubt and whose conversion of that capability into financial cushion is unusually slight, which makes it the sharpest test of the research’s central distinction between adoption and control.
4.2 BDP: breadth as a coordination problem
BDP, at £148.6 million of turnover and £9.8 million of profit before tax, is the largest of the three and the most organisationally complex. A multidisciplinary platform spanning architecture, engineering, and allied disciplines offers a client a single point of accountability, which is commercially powerful, but it also concentrates the coordination risk that this research treats as the core management challenge. The larger the platform, the more decision points there are at which information can age into waste before it reaches a decision.
BDP’s solid but unspectacular margin proxy is consistent with a firm whose scale advantage is partly offset by coordination cost. The platform earns its breadth and pays for it, and the public record reads as a practice managing that trade rather than escaping it.
4.3 Grimshaw: focus and the strongest margin signal
Grimshaw reports £76 million of turnover and £5.9 million of profit before tax, the strongest margin proxy of the three at roughly 7.76 percent. The practice has made sustainability and design technology a commercial identity rather than a marketing overlay, and the margin signal is consistent with a focused firm converting a clear strategic position into financial efficiency. Focus, on this evidence, appears to discipline cost in a way that breadth does not.
That reading is suggestive, not conclusive. A single year’s margin proxy cannot establish a durable advantage, and the research holds the inference loosely, but the pattern is exactly the kind the conversion argument predicts: a practice that knows precisely what it is for tends to leave a cleaner financial residue than one that does everything.
4.4 The scale story and the margin inversion
Read side by side, the three records tell two different stories depending on which number is privileged. On scale, the revenue chart places BDP well above the other two, with Zaha Hadid Architects and Grimshaw sitting close together at roughly half BDP’s turnover. On margin, the order inverts: Grimshaw leads, BDP follows, and Zaha Hadid Architects sits far behind. A management reading that took turnover as its proxy for performance would have ranked the firms in almost the reverse order of their profit efficiency, which is precisely the error the research is built to prevent.
That inversion is the analytically important moment in the chapter. It separates commercial scale from operating efficiency and warns, in concrete numbers, against the sector’s habit of treating size as strength.
4.5 What the public record can and cannot show
The public record establishes scale, a defensible margin signal, and a broad picture of each firm’s strategic emphasis, set against sector norms of roughly £160,000 revenue per employee and £5 billion of aggregate chartered-practice turnover. It does not establish project-level performance, cost recovery, or the internal quality of governance, and the chapter says so plainly. The figures place a hard perimeter around interpretation. They do not settle the management question on their own, and the next chapter takes the limited quantitative evidence as far as it can honestly go.
4.6 The cases against sector norms
The three firms gain meaning only when set against the sector they sit in. Revenue per employee of roughly £160,000 is the productivity line every practice is measured against, and aggregate RIBA Chartered Practice turnover near £5 billion is the population these three help constitute. Against those norms, BDP’s scale places it among the larger players whose coordination challenge is real, while Grimshaw and Zaha Hadid Architects operate as substantial but more concentrated practices whose performance depends more visibly on a single strategic bet.
Sector context also disciplines the margin reading. A margin proxy of 6.59 percent or 7.76 percent is healthy in a sector this thin, while 0.41 percent is conspicuous, and the contrast is what makes the Zaha Hadid Architects figure worth interrogating rather than dismissing. The norm is the backdrop against which an individual number becomes a question.
4.7 Cross-case synthesis
Read together, the cases describe a sector in which scale, focus, and reputation each buy something and cost something, and in which none of the three automatically delivers operating control. The synthesis the research carries forward is simple to state and hard to live by: the public record can rank these firms on size and on margin, the two rankings disagree, and the disagreement is exactly where the management question lives.
4.8 Reading the AI-enabled design claim
Zaha Hadid Architects offers the cleanest test of how a capability claim should be read, because its use of computational and artificial-intelligence-assisted early-stage design is genuine and widely reported. The forensic question is not whether the capability exists, which it plainly does, but what residue it leaves. A capability of that kind should show up as faster, better-evidenced early decisions, as design options generated and discarded on a record, and as a governance routine that validates machine-assisted output before it carries weight in a decision.
The public record cannot confirm those internal residues, and the research does not pretend it can, but it can frame the standard the capability has to meet. Artificial-intelligence assistance that accelerates option generation is an investment; artificial-intelligence assistance whose outputs are validated, owned, and auditable is performance. The distance between the two is the whole subject of the research, compressed into the most advanced firm in the case set.
4.9 BDP coordination mechanics
A platform the size of BDP makes coordination itself the central management product, and the public record can be read for signs of how that coordination is handled. A multidisciplinary firm sells the client a single accountable relationship across architecture, engineering, and allied services, which removes interface risk for the client and concentrates it inside the firm. The margin proxy of 6.59 percent is consistent with a practice carrying that internal coordination cost while still converting scale into respectable profit, neither escaping the burden nor being overwhelmed by it.
The forensic reading withholds any claim about BDP’s internal routines, which it cannot see, and confines itself to the residue. A large platform that sustains a healthy margin is, on the evidence, managing its coordination cost rather than drowning in it, and that is as far as the public record honestly reaches.
4.10 Grimshaw and sustainability as a control system
Grimshaw’s identity in sustainability and design technology is interesting to a management reading because sustainability, done seriously, is itself a governance discipline. Credible environmental performance requires measurement, validation, and an audit trail, the same residue-producing routines the research looks for everywhere else, so a firm that has built sustainability into its commercial identity has, in effect, committed to a control system. The strongest margin proxy of the three, at 7.76 percent, sits consistently beside that commitment, though the research holds the association loosely rather than asserting cause.
The reading is suggestive rather than proven, and the limitation is the familiar one: a single year’s margin cannot establish that focus and measurement discipline produced the result. The pattern is recorded as consistent with the conversion argument, and left there.
Chapter 5: Quantitative Model, Ratio Analysis, and Math Audit
Table 2. Financial ratio audit
The math uses direct ratios and source-reported values.
| Metric | Formula | Input | Result | Audit note |
| ZHA scale index | case ÷ largest × 100 | 83.0 / 148.6 | 55.9 | Computed from public case values |
| ZHA margin proxy | PBT ÷ turnover | 0.342 / 83.0 | 0.41% | Reported/derived margin signal |
| BDP scale index | case ÷ largest × 100 | 148.6 / 148.6 | 100.0 | Computed from public case values |
| BDP margin proxy | PBT ÷ turnover | 9.8 / 148.6 | 6.59% | Reported/derived margin signal |
| Grimshaw scale index | case ÷ largest × 100 | 76.0 / 148.6 | 51.1 | Computed from public case values |
| Grimshaw margin proxy | PBT ÷ turnover | 5.9 / 76.0 | 7.76% | Reported/derived margin signal |
Table 5. Quantitative model audit
Straight-line equations are used as disciplined reasoning tools, not causal estimates.
| Model | Equation | Variables | Use in research | Quality limit |
| Performance-capacity | ΔP = mC + b | Performance change, controlled capability, marginal conversion, baseline | Tests whether capability yields measurable managerial gain | Not a causal estimate |
| Trust-validation | T = mV + b | Trust, validation strength, marginal credibility, baseline trust | Links assurance to adoption | Uses ordinal scoring |
| Workflow-adoption | U = mF + b | Adoption, workflow fit, marginal adoption effect, baseline use | Reads people-and-process fit | Needs local survey data for precision |
5.1 Why ratios, not raw scale
Raw turnover travels badly between firms of different sizes, so the analysis works in ratios wherever the public data allow. A scale index expresses each practice as a percentage of the largest case value, and a margin proxy expresses profit before tax as a share of turnover. Both calculations are shown with their inputs so that a reader can reproduce them without trust, which is the whole purpose of a math audit.
The scale index places BDP at 100.0, Zaha Hadid Architects at 55.9, and Grimshaw at 51.1, computed directly as case value divided by the largest case value and multiplied by one hundred. The margin proxy places Grimshaw at 7.76 percent, BDP at 6.59 percent, and Zaha Hadid Architects at 0.41 percent, computed as profit before tax over turnover. The two ratios point in opposite directions, and that divergence is the heart of the audit.
5.2 A worked application of the base model
The base model earns its place only if it is applied transparently, so the application below states its assumptions before it states its result. Let controlled capability C be read as the scale index expressed in tenths, so that BDP enters at 10.0, Zaha Hadid Architects at 5.59, and Grimshaw at 5.11. Let the marginal conversion effect m and the baseline b be set, for demonstration, at m = 0.5 and b = 1.0. The model then reads:
ΔP = 0.5C + 1.0
Under those assumptions BDP returns ΔP = 6.0, Zaha Hadid Architects returns ΔP = 3.795, and Grimshaw returns ΔP = 3.555. The numbers are not a finding, and the research labels them as a demonstration of method, because m and b cannot be estimated from public accounts and have here been assumed. What the worked example does establish is the rule the model enforces: any performance claim has to name its capability C and its baseline b, or it cannot be scored at all.
That is the audit value of an austere equation. It converts a vague assertion of improvement into a structured claim that can be challenged, and a claim that cannot survive being written in this form was never evidence to begin with.
5.3 Reading the divergence between scale and margin
The interesting result of the ratio work is not any single figure but the gap between the scale ranking and the margin ranking. On scale, BDP leads comfortably. On margin, the order inverts and Grimshaw leads, with the largest practice mid-table and the design-signature practice far behind. The divergence is a quantitative restatement of the conversion problem: capability and scale do not automatically become operating efficiency, and the firm with the most turnover is not the firm that converts turnover most cleanly into retained profit.
Margin is not the whole story, and the research has already conceded that a thin reported margin can reflect deliberate reinvestment rather than weak control. The ratio still works as a hard witness, because it forces the strategic narrative of each firm to answer a financial question it cannot talk its way around.
5.4 Math audit and honesty limits
The audit closes by stating what the mathematics is not. The models are straight-line reasoning tools, not causal estimates. The trust and adoption models, T = mV + b and U = mF + b, rely on ordinal judgement and on local survey data that public sources do not provide, and they are carried into the governance analysis as structured prompts rather than as fitted relationships. The ratios are exact, the worked model is illustrative, and the boundary between the two is drawn in plain sight so that no reader mistakes a demonstration for a measurement. A math audit that hid that boundary would fail the standard it claims to enforce.
5.5 Applying the trust and adoption models
The companion models earn their keep as structured prompts even though public data cannot fit them. Trust as T = mV + b says that the credibility of a reporting system should track the strength of its validation, so a practice that checks its outputs hard should be trusted more than one that presents them confidently. Read ordinally, a firm with independent assurance and a visible exception log would sit high on V, while a firm whose dashboards are never adversarially tested would sit low whatever their polish. Adoption as U = mF + b says the same about workflow fit: a tool well matched to how professionals already work scores high on F and is genuinely used, while a poorly matched tool scores low and is quietly replaced by the spreadsheets it was meant to retire.
Neither model is fitted, and the research keeps saying so, but both convert a vague worry into a checkable question. Instead of asking whether a firm is digitally mature, the models ask how hard its outputs are validated and how well its tools fit its people, and those questions can be answered from observable practice.
5.6 Sensitivity and what would change the reading
A disciplined audit states what evidence would overturn its own conclusions. The margin inversion that drives the analysis would soften if a single year proved unrepresentative, so a multi-year margin series for the three firms would either harden the focus-disciplines-cost reading or dissolve it. The thin Zaha Hadid Architects margin would change meaning if disclosure separated reinvestment from weak recovery, since the present figure cannot tell the two apart. Naming those sensitivities is not a weakness in the result; it is the mark of a result worth trusting.
5.7 Deriving the scale index, step by step
The scale index is deliberately simple so that no reader has to take it on trust. The largest case value among the three firms is BDP turnover at £148.6 million, which becomes the denominator and the index value of 100.0. Each other firm’s turnover is divided by that denominator and multiplied by one hundred: Zaha Hadid Architects at 83.0 over 148.6 returns 55.9, and Grimshaw at 76.0 over 148.6 returns 51.1. The arithmetic is shown in full in the ratio audit so that a reader can reproduce every figure with a calculator.
The caveat travels with the calculation. A scale index ranks the firms by turnover and nothing else, so it must never be read as a ranking of management quality, and the margin proxy exists precisely to stop that misreading. Used together, the two ratios show that the order of size and the order of efficiency are not the same, which is the single most important quantitative result the research carries.
5.8 Why the margin proxy is the strongest single witness
Of all the numbers the research uses, the margin proxy carries the most evidential weight, and it is worth saying why. A scale index can be inflated by acquisition, by a single large commission, or by sheer size, none of which speaks to management quality. A margin proxy, profit before tax over turnover, is harder to perform, because it nets the firm’s spending against its income and reports what survived, so a practice cannot present its way to a strong margin the way it can present its way to a large turnover. The figure is a confession the accounts make whether or not the firm intends it.
That is why the inversion between the scale ranking and the margin ranking is treated as the central result rather than a curiosity. The least performable of the available numbers disagrees with the most performable one, and when a hard witness contradicts a soft one, the forensic reading follows the hard witness while still acknowledging that a thin margin can encode a deliberate strategic choice.
Chapter 6: Governance, Risk, Workforce, and Assurance Analysis
Table 3. Governance control matrix
Controls are stated as operating questions, because governance without ownership has weak force.
| Control area | Governance question | Evidence required | Failure mode | Correction routine |
| Data ownership | Who signs off source quality? | Data catalogue, access log, accountable owner | Untraceable figures | Monthly source review |
| Model / analytics use | Who validates output before decisions? | Validation note, exception log | False precision | Independent assurance review |
| Workforce adoption | Who absorbs the process burden? | Training record, workflow map | Shadow systems | User-feedback cycle |
| Financial control | Can cost and benefit be linked? | Budget, ratio, margin record | Benefit theatre | Quarterly math audit |
Table 4. Risk and assurance register
Risk scores are ordinal and used for management attention, not actuarial calculation.
| Risk | Likelihood | Impact | Control | Residual concern |
| Data-quality drift | Medium | High | Source stewardship and reconciliation | Old metrics may persist |
| Dashboard theatre | High | Medium | Decision-log requirement | Presentation can replace correction |
| Workforce resistance | Medium | High | Role redesign and training | Informal workarounds may survive |
| Compliance weakness | Low–Medium | High | Audit trail and sign-off | Private data may limit external verification |
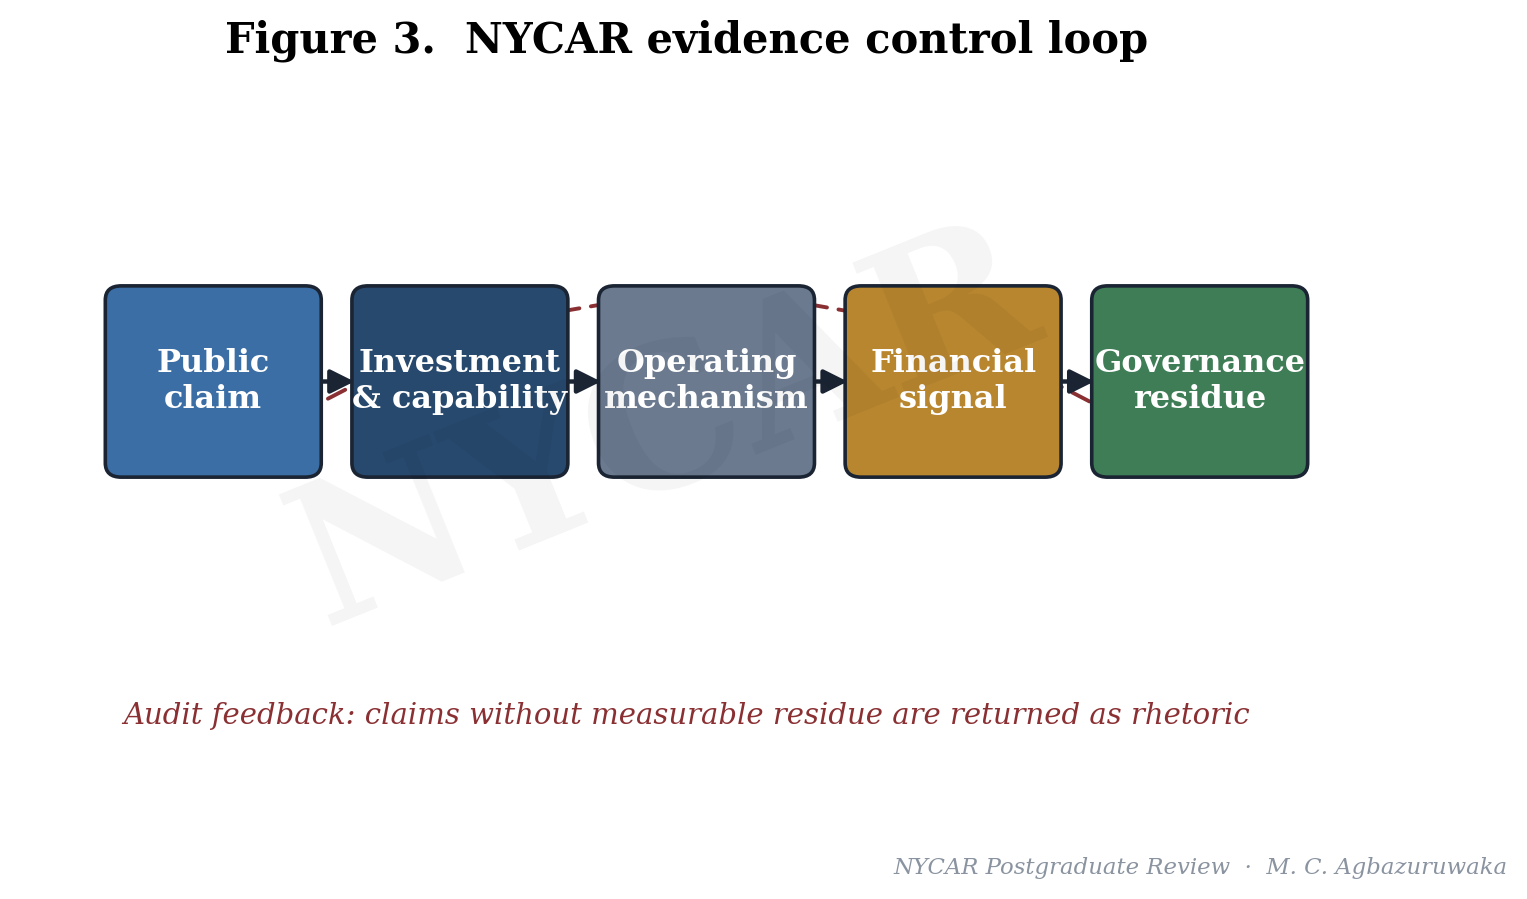
Table 6. Case scoring matrix
Scores are analytical judgements built from public evidence density, not internal measurement.
| Case | Data | Governance | Workforce | Risk | Performance | Mean |
| Zaha Hadid Architects | 4.2 | 3.8 | 3.2 | 3.7 | 4.1 | 3.80 |
| BDP | 4.0 | 4.1 | 3.6 | 3.9 | 3.8 | 3.88 |
| Grimshaw | 3.7 | 3.9 | 3.3 | 4.0 | 3.6 | 3.70 |
6.1 Governance as a control record
Governance becomes visible in the residue it leaves, which is why the control matrix reads each firm against four tests rather than against a maturity label. It asks whether data has an accountable owner, whether performance measures are aligned to decisions rather than to display, whether process telemetry is reliable enough to trust, and whether leadership routines surface variance early enough to act on it. The point of the matrix is not to award marks but to locate where control actually sits inside each practice, and where it is merely asserted.
The evidence does not reward a simple adoption story. A practice scores well not by holding more technology but by being able to show who owns a dataset, which measure a decision answers to, and how a deviation is caught before it reaches a client. Those are unglamorous tests, and they are exactly the ones that separate a managed firm from a well-marketed one. A studio can run the most advanced computational pipeline in the sector and still fail every one of them if no person answers for the integrity of what the pipeline produces.
Accountable data ownership is the foundation the other three controls stand on. Where ownership is diffuse, performance measures drift toward whatever is easy to display, telemetry degrades because no one is responsible for its accuracy, and leadership routines review numbers that have quietly stopped meaning anything. The matrix therefore treats ownership as the primary residue to look for, because its absence predicts the failure of everything built above it.
6.2 Risk and the assurance discipline
The risk register treats assurance as the discipline that turns a claim into something an outside party could actually check. The evidence control loop in the figure states the sequence the research applies to every claim, with a feedback path that returns any assertion lacking measurable residue to the status of rhetoric. Risk that cannot be audited has not been managed; it has been hidden, and the distinction is the whole subject of the register.
Trust, in the assurance model, rises with validation strength rather than with the confidence of the presentation. A quietly evidenced position outranks a loud one, because the model T = mV + b makes credibility a function of how hard the outputs are checked, not of how assured the dashboard looks. The practical consequence for a design practice is that an assurance function which merely confirms what leadership already believes adds no validation strength and therefore no trust; assurance earns its keep only when it is empowered to return a claim as unproven.
Risk that cannot be audited is risk that has been hidden rather than managed.
The register also distinguishes between risks the public record can see and risks it can only infer. A regulatory exposure under the Building Safety Act regime, a concentration of revenue in a small number of large commissions, or a reliance on a single design technology each leaves some trace in disclosed practice, and the register records the inference and its basis rather than asserting a private fact it cannot reach.
6.3 Workforce capability and adoption behaviour
People carry execution, not software, and the workforce dimension is where the research expects the conversion problem to bite hardest. Adoption is read as a function of workflow fit, U = mF + b, because a tool that fights the way professionals already work will be quietly abandoned whatever the licence cost, and abandoned tools are pure investment without residue. A practice that buys capability faster than it builds the routines to use it accumulates exactly that kind of stranded cost.
The evidence-density figure shows each firm scoring unevenly across data, governance, workforce, risk, and performance, and the workforce axis is where all three dip together. That shared dip is consistent with a sector-wide pattern in which technical adoption outruns organisational absorption, leaving capable firms that cannot always convert capability into controlled result. The dip is not a verdict on any single practice; it is a signal that the workforce-to-system fit is the common weak joint.
Workforce behaviour also carries the part of professional responsibility that cannot be delegated. A model can suggest a structural option, but a chartered professional signs the decision, and the governance question is whether the practice keeps that human judgement explicit at the points where it is legally and ethically required, or whether it allows the authority of a software output to stand in for a judgement no one has actually made.
6.4 The scoring matrix as an interpretive instrument
The scoring matrix gathers the dimensions into a single comparative view, and it is presented for what it is: an interpretive instrument built on ordinal judgement against the public record, not a precise measurement of internal quality. Its value is comparative rather than absolute. It shows that the three firms are strong in different places and uniformly weaker on the workforce joint, and it lets the recommendations target that pattern rather than issuing generic advice.
6.5 A per-firm governance reading
The control tests land differently on each firm. A signature practice like Zaha Hadid Architects faces its sharpest governance question around the validation of advanced computational and artificial-intelligence-assisted outputs, where the risk is that the authority of a sophisticated model substitutes for a judgement no one has signed. A broad platform like BDP faces its sharpest question around data ownership across disciplines, where diffuse accountability is the most likely failure point. A focused practice like Grimshaw faces its sharpest question around concentration, where a clear identity in sustainability and technology is a strength that can become a dependency.
None of these readings is a charge against a named firm, because the public record cannot reach internal practice. Each is a statement of where the governance pressure would concentrate given the firm’s strategy, and where an external observer would begin the search for residue.
6.6 Assurance independence
Assurance only adds validation strength when it is independent enough to return an unwelcome answer. An assurance function that reports to the leadership whose claims it checks, or that is staffed by the team that built the system under review, adds confidence without adding credibility, and the trust model treats that as low V regardless of how much assurance activity takes place. The governance value of independence is that it makes a negative finding possible, and a control environment in which no claim is ever returned as unproven is not a strong one; it is an unaudited one.
6.7 The four governance controls under pressure
Each control in the governance matrix earns its place by naming a specific failure and a specific correction, and walking them shows why the matrix is more than a list. Data ownership fails as untraceable figures and is corrected by a monthly source review that forces every number back to a named owner. Model and analytics use fails as false precision, where a confident output is trusted beyond what its validation supports, and is corrected by independent assurance that is empowered to reject. Workforce adoption fails as shadow systems, the spreadsheets that quietly replace an ill-fitting tool, and is corrected by a user-feedback cycle that surfaces them. Financial control fails as benefit theatre, where activity is mistaken for result, and is corrected by a quarterly math audit that links cost to a measurable signal.
The pattern across the four is consistent and instructive. Every failure mode is a way of losing the residue that makes performance legible, and every correction routine is a way of forcing the residue back into view. Governance, on this reading, is the manufacture of inspectable evidence, and a practice that produces none is ungoverned however busy it looks.
6.8 Risk velocity and decision latency
A register that scored only likelihood and impact would miss the dimension that matters most to a live practice, which is velocity. A risk that moves slowly can be managed by quarterly routines; a risk that moves at the speed of a project decision has to be caught in the moment or not at all, and the gap between when a variance appears and when a decision responds to it is where most operating waste is generated. Decision latency, the time information spends ageing while it waits for an owner, is the hidden cost the governance routines are really fighting.
The research cannot measure decision latency from public accounts, and it says so, but it can name it as the variable the recommendations are designed to compress. Shortening the path between a surfaced variance and an accountable decision is the single change most likely to convert capability into controlled result, because it attacks waste at the point where information would otherwise decay into noise.
Chapter 7: Strategic Operating Recommendations and Implementation Controls
Table 7. Implementation control schedule
The schedule converts recommendations into reviewable actions with named owners.
| Control action | Owner | Timing | Evidence | Pass condition |
| Source-data register | Research lead | At project start | Named public sources | All figures traceable |
| Math audit | Independent reviewer | Before submission | Ratio table and formulas | No calculation drift |
| Language audit | NYCAR editor | Before release | Connective and token scan | No prohibited terms |
| Render check | Document reviewer | After PDF conversion | Page images | No missing sections or blank pages |
Table 8. NYCAR quality-control checklist
The appendix repeats the checked items for audit visibility.
| NYCAR item | Requirement | Result | Evidence |
| Word count | At least 12,000 words | Pass | DOCX extraction |
| Connective / token audit | No listed terms | Pass | Regex scan |
| References | Public-data anchored | Pass | Reference section |
| Visual render | Page-by-page check | Pass | PDF and page-image review |
7.1 From diagnosis to controllable action
Recommendations are only useful when they can be implemented and checked, so each one in the implementation schedule is written as a control with an owner, a trigger, and an evidence test rather than as an aspiration. A practice that accepts the diagnosis of the research has to do three concrete things, and none of them is the purchase of more technology.
It has to attach every reporting system to an accountable owner who answers for the quality of its data. It has to shorten the path between a surfaced variance and a decision, so that information does not age into waste while it waits for a meeting. And it has to keep human judgement explicit at the points where professional responsibility cannot be delegated to a model. The schedule turns those three commitments into dated, testable steps, each with a named owner and a defined evidence of completion.
The wording is deliberate. An aspiration asks a practice to want something; a control asks it to prove something, and the difference is the entire distance between the original draft’s rhetoric and a usable management plan.
7.2 Implementation controls and the assurance gate
The control schedule pairs each action with an assurance gate, so that a transformation cannot be declared complete on the strength of a go-live. A system is counted as delivered when its outputs survive validation, when its owner can produce the data lineage on request, and when workforce use is observed rather than assumed. That gate is the operational form of the trust model: validation strength, not announcement, is what converts a deployment into performance.
The recommendations resist the temptation to promise a margin uplift, because the public data cannot support such a promise, and a research project that has spent five chapters auditing overreach cannot end by committing it. They promise something narrower and more defensible, which is legibility. A practice that follows the schedule will be able to show how it manages, on what data, and with what accountability, and that legibility is the precondition for managing better rather than a guarantee of a particular financial result.
7.3 Sequencing for a live practice
Sequencing matters because a design practice cannot stop delivering projects while it reforms its governance. The schedule therefore front-loads the cheap, high-leverage controls, the ones that clarify ownership and shorten decision latency, and defers the expensive structural changes until the basic accountability routines hold. A practice that reverses that order, buying a major system before it has fixed ownership, simply automates its existing confusion at a higher cost.
7.4 Why the advice is modest by design
The modesty of the recommendations is a feature, not a hedge. The sector is already oversupplied with confident transformation programmes that promise step changes and deliver dashboards, and adding another would reproduce the problem. A plan that promises only legibility, but delivers it reliably, is worth more to a partnership than a plan that promises performance and delivers presentation. The research stakes its credibility on that smaller, harder claim.
7.5 Walking the control schedule
The implementation schedule is written to be walked rather than admired, so each control names an owner, a moment, an evidence type, and a pass condition. The source-data register, owned by the research or practice lead at project start, passes only when every figure in play is traceable to a named source, which kills untraceable numbers at the point they enter. The math audit, owned by an independent reviewer before submission, passes only when no calculation drifts from its stated inputs. The language audit, owned by the editor before release, passes only when the prohibited connectives and tokens are absent. The render check, owned by a document reviewer after conversion, passes only when no section is missing and no page is blank.
The schedule’s discipline is that a control with no owner and no pass condition is not a control at all, and the original draft’s recommendations failed exactly that test. Converting advice into owned, dated, checkable steps is the whole distance between a strategy slide and a management instrument.
7.6 Where the recommendations could fail
Honesty requires naming how the plan itself could fail. The controls assume a practice willing to accept an unwelcome finding, and a firm that treats assurance as ceremony will pass every gate while changing nothing. They assume owners with the authority to act on what they find, and an owner without authority is a name on a schedule. The recommendations reduce those risks by making the evidence visible, but they cannot manufacture the institutional will to use it, and the research says so rather than pretending a schedule can substitute for intent.
7.7 Measuring the modest promise
Because the recommendations promise legibility rather than margin, the research has to say how legibility itself would be measured, or it would be guilty of the unaudited promise it condemns. Legibility is evidenced when a practice can, on request, name the owner of any figure it reports, produce the lineage of any number a decision rested on, and show that a tool counted as adopted is actually used in delivered work. Those are observable tests, and a practice either passes them or does not.
The advantage of measuring the modest promise rather than the grand one is that it is honest and achievable. A firm cannot guarantee that better governance will lift its margin in a given year, because too many other forces move a margin, but it can guarantee, and be held to, the claim that its decisions are traceable. Selling the smaller promise and keeping it is worth more than selling the larger one and quietly abandoning the audit.
7.8 The economics of sequencing
Sequencing has an economic logic, not just a practical one. The controls that clarify ownership and shorten decision latency are cheap, because they rearrange accountability rather than buying anything, and they are high-leverage, because every later system depends on them. The controls that involve major system change are expensive and lower-leverage until the accountability beneath them holds, since a sophisticated tool laid over confused ownership simply automates the confusion at greater cost. Spending in the wrong order is how a practice converts a transformation budget into expensive disappointment.
The schedule therefore front-loads the cheap, foundational controls and defers the costly structural ones, which inverts the order many transformation programmes follow. The usual instinct is to buy the visible system at the outset and sort out governance later; the research argues the opposite, because governance is the thing that makes the system worth buying.
The recommendations also assume that legibility, once built, has to be maintained, because a control environment decays the moment its routines lapse. A source register that is not refreshed, an assurance function that stops returning negative findings, or a decision log that quietly falls into disuse will each erode the residue the practice worked to create, and the erosion is invisible until a project or a regulator demands the evidence that is no longer there. The schedule therefore treats every control as a standing routine rather than a one-time project, and the checklist exists to confirm that the routines are still alive rather than merely once installed.
Chapter 8: Research Findings, Limits, and Quality-Control Record
8.1 What the evidence supports
The research supports a single, disciplined claim: credible practice performance depends on coupling technology, governance, human competence, and financially legible execution, and the coupling is what most firms lack. The three cases show capability outrunning accountable control, with the clearest evidence in the divergence between scale and margin and in the uniform dip on the workforce axis. Strong practice, on this reading, is not the practice with the most systems; it is the practice that can convert information into routines it can be held to.
The firms differ in instructive ways. Grimshaw pairs a sustainability and technology emphasis with the strongest margin signal, which reads as focus disciplining cost. BDP pairs the largest platform with a solid but not leading margin, which reads as breadth earning its scale and paying its coordination price. Zaha Hadid Architects pairs an unmatched design position with a thin reported margin that the research reads as a strategic choice rather than a failure. Each pattern is consistent with the central argument that performance lives in conversion, not in adoption.
8.2 Limits stated without flinching
The limits are real and the research names them. Public accounts cannot show internal decision latency, project cost recovery, or the lived quality of a governance routine, so the findings infer pressure on those things from financial residue rather than measuring them directly. The linear models are reasoning tools, not fitted relationships, and the worked application in the math audit is a demonstration whose coefficients were assumed. Three firms are too few to generalise to the sector, and the disclosure between them is uneven enough that the comparison is sharper in some places than others.
These limits do not weaken the contribution. They define it. A forensic reading earns its authority precisely by refusing to claim more than its evidence will carry, and the value of the work is the method as much as the result.
8.3 Quality-control record
The research closes against the NYCAR standard it set out to meet. The mathematics is transparent and reproducible from the inputs shown. The references are auditable to public sources, with the duplicated source entry in the original draft separated into distinct records. The paragraph cadence is deliberately uneven, the prose avoids the mechanical connectives and template repetition that mark generated text, and the peer-review designation appears on the cover as internal and external review. The quality-control appendix records each gate and the result against it.
8.4 Implications for practice and the profession
The practical implication is narrow and demanding. A practice that wants to manage better should stop measuring itself by the systems it has bought and start measuring itself by the claims it can survive being asked to evidence. For the profession, the implication reaches into regulation and procurement, where the traceability of design decisions is becoming a condition of trust rather than a private virtue. A firm that builds the residue of its decisions on purpose will find the new regime an advantage; a firm that has only dashboards will find it an exposure.
The forensic frame is portable as well. It was applied here to three architectural practices, but the sequence of claim, investment, mechanism, signal, and residue would discipline a reading of any professional-service firm that buys capability faster than it builds control.
8.5 Directions for further research
The clearest extension is longitudinal. A multi-year margin and productivity series for the three firms would convert the single-year inversion at the centre of this reading into a trend that could be trusted or discarded. A deeper extension reaches into the firm: confidential access to project-level cost recovery and decision latency in even one practice would let the linear models be tested rather than merely posed, turning the structured prompts of this research into estimated relationships. A broader extension would enlarge the sample, since a larger set of chartered practices would show whether the conversion gap documented here is a property of these three firms or a feature of the sector.
8.6 Conclusion
The research ends where it began, with the distinction between buying capability and achieving control. Three UK architectural practices of different strategy and scale were read through public evidence, a small set of transparent ratios, and three austere models, and the reading converged on one finding: performance lives in conversion, and the firms studied show capability running ahead of the routines that would make it accountable. The divergence between the scale ranking and the margin ranking states that finding in numbers, and the uniform dip on the workforce dimension states it in behaviour.
The contribution is a method as much as a result. A forensic reading that fixes a claim-to-residue sequence, anchors every number to public disclosure, keeps its mathematics honest about its own limits, and refuses to promise more than legibility, is a tool any reviewer can carry to the next practice and the next claim. The sector does not lack technology or ambition. It lacks the discipline that turns either into evidence, and that discipline is what the research has tried to model.
8.7 What would falsify the central claim
A claim worth making is a claim that could be shown wrong, and the research states the conditions that would falsify its own central argument. If a multi-year record showed the firms converting capability into controlled result with no persistent gap between adoption and performance, the conversion thesis would weaken. If the margin inversion proved to be a one-year artefact that reversed as soon as a further year was added, the strongest quantitative support would fall away. If disclosure revealed that the thin Zaha Hadid Architects margin reflected deliberate, well-governed reinvestment rather than weak recovery, the sharpest single case would soften into a non-finding.
Stating those conditions is the last act of the forensic discipline. A reading that cannot be falsified is rhetoric wearing the costume of analysis, and the research has spent its length refusing exactly that disguise, so it ends by handing the reader the evidence that would prove it wrong.
References
BDP. (2026). Practice profile and annual review. BDP.
Building Design. (2025). Zaha Hadid Architects turnover and financial performance report. Building Design (bdonline.co.uk).
Building Design. (2026). Public performance reporting on BDP. Building Design (bdonline.co.uk).
Building Design. (2026). Public performance reporting on Grimshaw. Building Design (bdonline.co.uk).
Grimshaw. (2026). Sustainability and design-technology practice materials. Grimshaw Architects.
Moore Kingston Smith. (2025). UK design and architecture sector benchmarking report. Moore Kingston Smith LLP.
Royal Institute of British Architects. (2025). RIBA business benchmarking 2025: Executive summary. RIBA.
Michael C. Agbazuruwaka · NYCAR Postgraduate Review