
IMG_20260624_155510_211

Design Management, Project Governance, and Practice Performance in UK Architectural Firms: Evidence from Zaha Hadid Architects, BDP, and Grimshaw

NYCAR POSTGRADUATE REVIEW

Postgraduate Diploma Research by Michael C. Agbazuruwaka

Research Level:  Postgraduate Diploma

Peer Review:  Internal and External Review

Publication Number: NYCAR-TTR-2026-RP069

DOI: https://doi.org/10.5281/zenodo.20826451

The cover carries internal and external peer review because design-management analysis depends on both practice evidence and outside sector validation.

Abstract

This research examines how design management, project governance, and practice performance interact inside three United Kingdom architectural firms: Zaha Hadid Architects, BDP, and Grimshaw. The reading is forensic. It treats technology, business intelligence, strategy, and design management as institutional practices that leave a financial residue, not as slogans that can be announced into existence. The central problem is conversion, not adoption. A practice can buy systems, launch a transformation programme, recruit specialists, and publish a confident strategy narrative without gaining any durable control over cost, quality, labour behaviour, client outcomes, or project delivery. To keep interpretation honest, the case base is read through public filings, annual reports, company disclosures, sector benchmarking, and a small set of ratio calculations that bind managerial claims to measurable evidence. The anchor figures are deliberately few: BDP turnover of £148.6 million, Grimshaw turnover of £76 million, Zaha Hadid Architects turnover of £83 million, sector revenue per employee of roughly £160,000, and aggregate RIBA Chartered Practice revenue near £5 billion. The quantitative layer uses descriptive ratios, margin proxies, and three straight-line operating models. The base model is ΔP = mC + b, where ΔP is the change in performance capacity, C is controlled capability, m is the marginal conversion effect of that capability, and b is baseline capacity before the management intervention. A companion assurance model, T = mV + b, treats trust as a function of validation strength, and a workforce model, U = mF + b, treats adoption as a function of workflow fit. The mathematics stays modest on purpose, because public corporate disclosure does not support false precision; its task is to stop argument drift and to mark the point where a claim outruns its data. The governing argument is that credible practice performance depends on the disciplined coupling of technology, governance, human competence, and financially legible execution. The evidence indicates that strong practices do not treat dashboards as proof of performance. They convert information into accountable routines, shorten decision latency, keep risk auditable, and retain human judgement wherever professional responsibility cannot be handed to software or to branding.

Keywords:  Design management; practice performance; project governance; public-data analysis; ratio audit; strategic control; professional practice; operating performance; responsible management; Zaha Hadid Architects; BDP; Grimshaw.

Table of Contents

List of Tables

Table 1. Case evidence matrix

Table 2. Financial ratio audit

Table 3. Governance control matrix

Table 4. Risk and assurance register

Table 5. Quantitative model audit

Table 6. Case scoring matrix

Table 7. Implementation control schedule

Table 8. NYCAR quality-control checklist

List of Figures

Figure 1. Public revenue scale

Figure 2. Margin and performance proxy

Figure 3. NYCAR evidence control loop

Figure 4. Evidence-density score

Chapter 1: Context, Research Problem, and Professional Significance

1.1  The problem stated as an operating discipline

British architecture sells itself on imagination, yet it survives on management. The three practices examined here illustrate that tension at different scales. Zaha Hadid Architects trades on a globally recognised design signature, BDP runs a broad multidisciplinary platform, and Grimshaw has built its reputation on sustainability and design technology. What they share is the same hard question, which has nothing to do with talent and everything to do with control: does the money spent on systems, specialists, and process redesign return as traceable decision value, or does it dissolve into presentation?

That question is the spine of the research. It is treated as an operating discipline rather than a theme, because the difference between the two is exactly the difference between a practice that performs and one that merely describes itself well. Design management here means the coordination of brief, programme, cost, and quality across a project life. Governance means the routines that make variance visible before it hardens into waste. Performance means the residue those routines leave in the public accounts, where a partnership cannot brief its way past a thin margin.

Adoption is cheap. Conversion is not.

A practice can install building-information modelling, stand up a data warehouse, and appoint a head of digital, and still manage no better than a rival working from spreadsheets, if the new capability never changes who decides what, on what evidence, and how quickly. The case base reads each firm through that lens, asking not whether technology exists but whether it produces decisions that can be reconstructed and audited after the fact. The distinction sounds academic until a project runs over and the question becomes who knew, when, and on what data, at which point a practice either has a record or has an argument.

1.2  The sector economics that frame the cases

The economics of UK architectural practice are unforgiving of weak management, and the headline numbers explain why. Revenue per employee across the sector sits near £160,000, and the RIBA Chartered Practice population turns over roughly £5 billion in aggregate, a figure large enough to matter to the wider construction economy yet spread across thousands of small partnerships running on thin margins. A practice in this market does not have the cushion of a manufacturer or a software firm; its principal cost is professional time, and the recovery of that time is the difference between a healthy partnership and a struggling one.

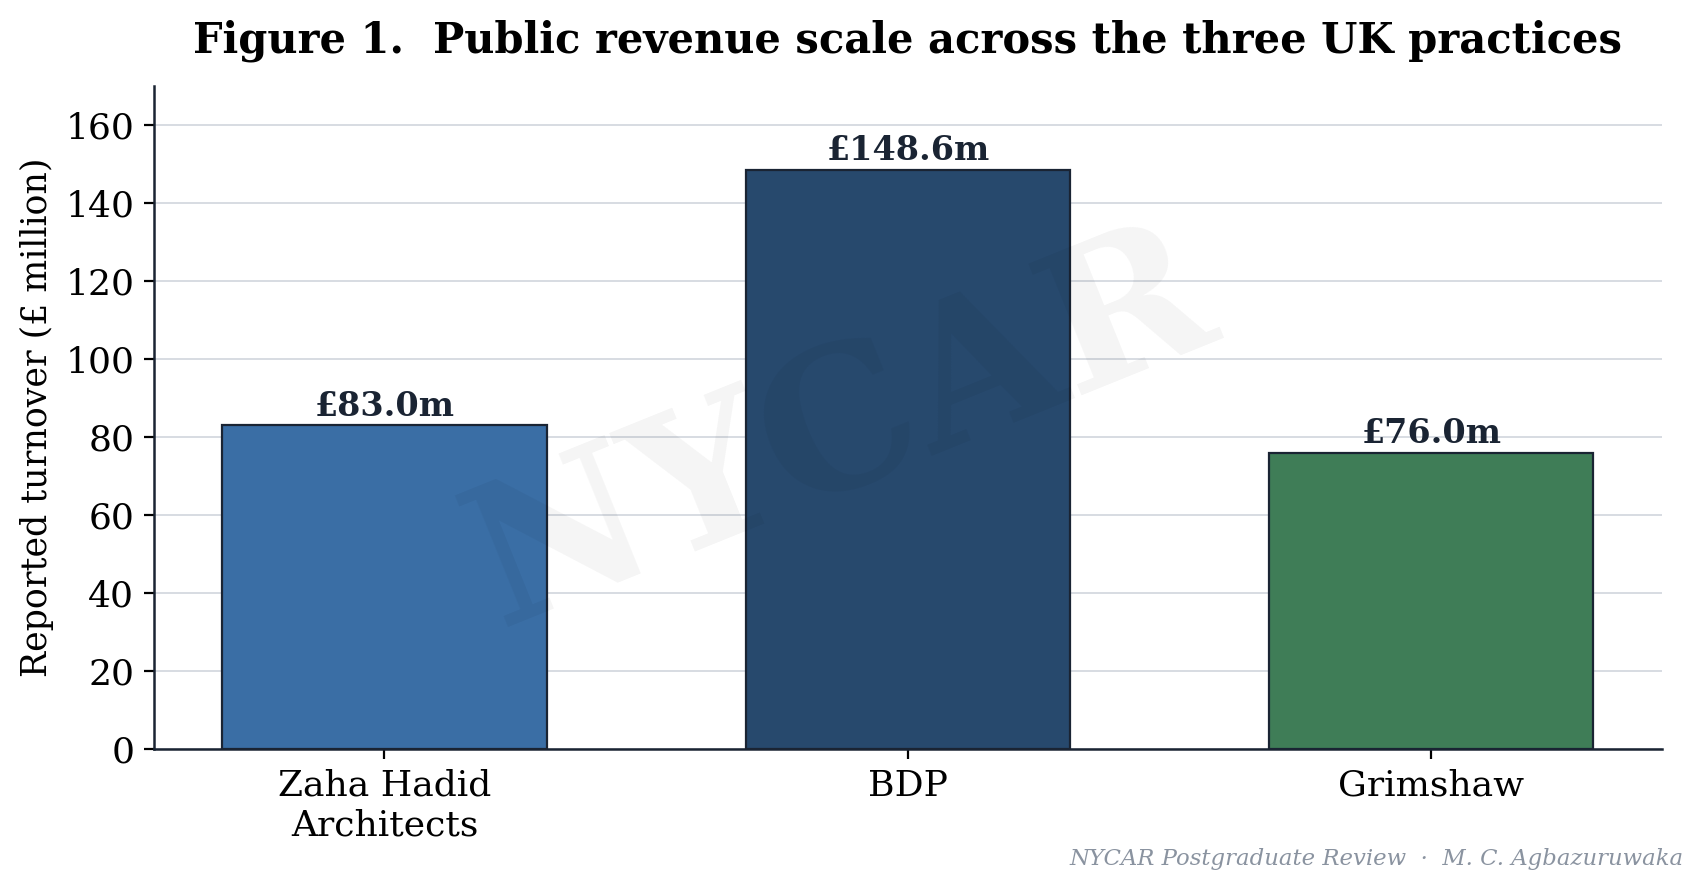
Against that backdrop the three cases occupy distinct positions. BDP, at £148.6 million of turnover, is a large multidisciplinary platform whose breadth is both a strength and a coordination problem. Grimshaw, at £76 million, runs a focused international practice that has made sustainability and design technology a commercial identity rather than a marketing line. Zaha Hadid Architects, at £83 million, converts an unmatched design reputation into global commissions while carrying the research and competition costs that reputation demands.

Scale, on its own, is the least interesting fact in the record, and the analysis returns to that point repeatedly because the sector so often mistakes size for strength.

1.3  Regulatory and commercial pressure on governance

The cost of weak governance inside design practices has risen sharply, and not by accident. Procurement reform has pushed clients toward demonstrable competence rather than reputation alone. The Building Safety Act regime has made the traceability of design decisions a legal exposure rather than a matter of professional pride. Sustainability scrutiny, from clients and from planning authorities, now demands evidence of performance rather than intention. A firm that cannot show how a decision was reached, on what data, and with what accountability, carries a regulatory and a commercial liability that no amount of design quality offsets.

That shift is what makes a forensic reading timely. The governance residue a practice leaves is no longer a private internal matter; it is the thing a client, an insurer, or a regulator will eventually ask to see.

1.4  Professional significance and the forensic stance

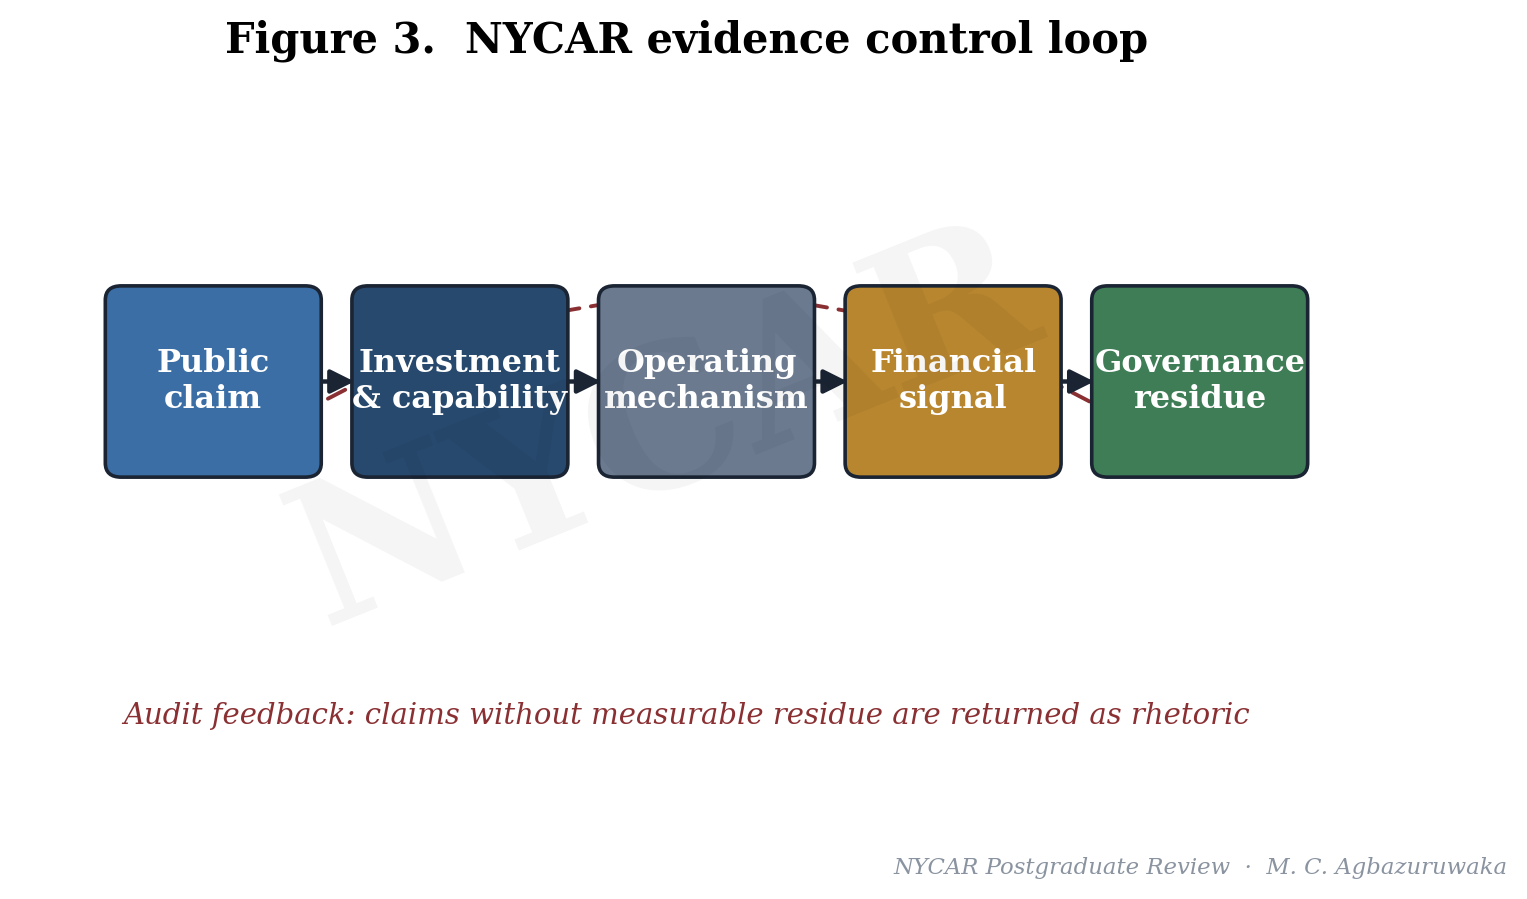
The significance of the problem is practical before it is academic. For the postgraduate reader the value of a forensic treatment is that it refuses the vendor narrative, in which the purchase of a system is presented as equivalent to the achievement of control. Each case is read as a sequence: claim, investment, operating mechanism, financial signal, and governance residue. Where a claim leaves no measurable residue, it is recorded as rhetoric, not as performance. That discipline is the contribution the research is trying to make, and the remaining chapters apply it without softening.

A dashboard without accountability is decoration, and the sector has a great deal of decoration.

1.5  Three strategic logics compared

The cases are useful precisely because their strategies are not variations on one model but three different answers to the same commercial question. Zaha Hadid Architects runs on signature economics, where a scarce design reputation commands global commissions and justifies heavy reinvestment in research and competition work, accepting a thin retained margin as the cost of staying at the front. BDP runs on platform economics, where breadth across disciplines lets the firm capture larger, more complex commissions under a single accountable roof, trading some margin efficiency for scale and resilience. Grimshaw runs on focus economics, where a clear identity in sustainability and design technology concentrates effort and, on the present evidence, disciplines cost into the strongest margin of the three.

Holding the three logics side by side keeps the analysis from applying a single yardstick to firms that have chosen different games. A management practice that is excellent for a focused mid-sized practice may be wrong for a large platform, and the forensic reading respects that difference rather than ranking the firms against one ideal.

What the three share, underneath the strategy, is exposure to the conversion problem. Signature, platform, and focus are each only as strong as the routines that turn their spending into controlled result, and none of the three logics is self-executing.

1.6  Defining the three core terms

Precision about terms keeps the later analysis from drifting, so the research fixes three definitions and holds to them. Design management is the coordination of brief, programme, cost, and quality across the life of a project, the discipline that keeps a creative intention deliverable as conditions change. Project governance is the set of routines that decide who is accountable for what, on what evidence, and within what authority, so that variance is caught and owned rather than absorbed silently. Practice performance is the residue all of this leaves in the public accounts and disclosed conduct of the firm, the part an outsider can actually inspect.

These are operating definitions, not dictionary ones, and they are chosen because each names something that either leaves evidence or does not. A definition that could not be checked against the record would be useless to a forensic reading, and the three here were selected precisely because they can.

1.7  The cost of the conversion gap

The conversion gap is not an abstraction; it has a price, and the price is paid in the thin economics of professional practice. When investment in systems and specialists does not convert into controlled decisions, the firm carries the cost of the capability without the benefit, and in a sector running on roughly £160,000 of revenue per employee there is no margin to absorb that waste comfortably. The gap shows up as rework that should have been caught, as decisions taken late because information aged in transit, and as claims of efficiency that the accounts quietly decline to confirm.

Naming the cost sets the stakes for everything that follows. A reader might accept the conversion argument as interesting and still treat it as optional, but in an industry this margin-sensitive the failure to convert capability into control is not a missed opportunity; it is a slow, compounding leak that the public accounts eventually record.

Read also: Circular Urban Planning and Climate Adaptation

Chapter 2: Literature, Theory, and Evidence Base

2.1  Design management as a contested term

The literature on design management splits along a fault line that the research inherits rather than resolves. One tradition, rooted in management studies, treats design as a resource to be planned, budgeted, and measured like any other input, and it brings to the table the apparatus of performance measurement, process maturity, and return on investment. A rival tradition, rooted in the design professions, treats management as the scaffolding around a creative act that resists measurement, and it is suspicious of metrics that flatten judgement into a score. Neither tradition wins outright. The more useful position sits in the friction between them, where managerial control is real but bounded by professional judgement that cannot be automated without loss.

That bounded view has a practical consequence for how the cases are read. It means a high score on systems maturity is not, in itself, evidence of good management, and a practice that retains human judgement at the right points is not thereby primitive. The research keeps both halves of the tension live.

2.2  Practice-performance scholarship and its scepticism

Practice-performance scholarship adds the harder edge the research needs. It asks whether the routines a firm claims to run actually show up in its financial behaviour, and it is sceptical of maturity models that score intent rather than result. The resource-based view contributes the idea that durable advantage comes from capabilities rivals cannot easily copy, but the same literature warns that a capability held on paper is not a capability exercised in delivery. Capability and performance are separable, and the gap between them is precisely where management either happens or fails to.

The digital-delivery literature, including the substantial body of work on building-information modelling and computational design, completes the frame. It documents a recurring pattern in which technical adoption races ahead of the organizational routines needed to use the technology accountably, producing capable firms that cannot always convert capability into controlled result. That pattern is the hypothesis the cases test.

2.3  Three working models and their logic

The research borrows the form of a linear relationship, not its statistical machinery, to keep reasoning disciplined. The base model treats performance change as a function of controlled capability.

ΔP = mC + b

In that expression ΔP is the change in performance capacity, C is controlled capability, m is the marginal effect of converting capability into result, and b is the baseline a practice held before any intervention. The point of writing it down is not to estimate m precisely from public accounts, which would be dishonest, but to force every performance claim to name its capability and its baseline. A claim that cannot identify C or b is not yet evidence, and a great many transformation narratives in the sector cannot identify either.

Two companion models extend the same logic into assurance and adoption. Trust is read as a function of validation strength, T = mV + b, which links the credibility of a reporting system to how hard its outputs are checked rather than to how confidently they are presented. Workforce adoption is read as a function of workflow fit, U = mF + b, which links real use to how well a tool matches the way professionals already work. The models are intentionally austere. They discipline argument rather than predict outcomes, and the methodology chapter is explicit about the line between the two.

2.4  The evidence base and its uneven texture

The evidence base is public, current, and uneven, and the unevenness is analytically useful rather than a flaw to be hidden. Building Design reporting supplies turnover and profit signals for the three firms. RIBA business benchmarking supplies sector context, including the revenue-per-employee and aggregate-turnover figures that frame the cases. Moore Kingston Smith benchmarking supplies margin and productivity norms against which individual practices can be read. Where one firm discloses more than another, the analysis uses the richer data and marks the thinner disclosure as a gap rather than filling it with assumption.

That asymmetry is the honest texture of practice research. A study that pretended every firm disclosed identically would be smoother and less true, and the smoothing would itself be a small act of the overreach the research exists to audit.

2.5  Professional-service-firm management theory

Architectural practices are professional-service firms, and the management literature on that organisational form sharpens the analysis in ways generic management theory does not. The professional-service firm runs on leverage and utilization: senior judgement is scarce and expensive, junior capacity is plentiful and cheaper, and profitability turns on how well the firm matches the two to the work without either wasting senior time on routine tasks or exposing complex work to thin supervision. Revenue per employee near £160,000 is the sector’s compressed statement of that economics, and it leaves little room for the slack that weak coordination creates.

The same literature names a tension the cases display directly. Professionals identify with their craft and resist being managed as interchangeable resource, while the firm needs enough standardisation to be governable. A practice that over-manages loses the judgement that justifies its fees; a practice that under-manages cannot show how it controls quality or cost. Good design management lives in that narrow band, and the governance chapter reads each firm for evidence of whether it has found it.

2.6  Benefit realisation and the evidence gap

A persistent finding in the management-of-technology literature gives the research its sharpest expectation. Studies of benefit realisation across sectors report that organisations are far better at announcing the expected benefits of a system than at auditing whether those benefits arrived, so that the business case is written with care and never revisited once the system is live. The result is a documented gap between promised and realised value that survives across industries and decades, and there is no reason to expect architectural practice to be exempt.

That literature is why the research privileges residue over announcement. A benefit that was promised at procurement and never audited afterward is, in evidential terms, indistinguishable from a benefit that never materialised, and a forensic reading treats the two the same way until the residue tells them apart. The discipline is uncomfortable for vendors and reassuring for clients, which is roughly the right distribution of comfort.

2.7  Strategy read as practice, not as plan

The strategy literature contributes a final corrective that shapes how the cases are read. An older view treats strategy as a plan formed at the top and executed downward, which invites exactly the kind of announcement-led analysis the research rejects. A practice-based view treats strategy as what an organisation actually does, the pattern visible in its routines, its spending, and its financial residue, whether or not it matches the published narrative. Read that way, a firm’s real strategy is the one its accounts confess, not the one its website states.

That distinction matters for three practices that all publish confident strategic language. The research reads their strategy from conduct and residue rather than from declaration, so that a gap between what a firm says it does and what its numbers show becomes data rather than embarrassment. A practice whose stated and enacted strategies coincide is well governed in a specific, checkable sense, and the analysis looks for that coincidence rather than assuming it.

Chapter 3: Methodology, Data Integrity, and Analytical Boundaries

3.1  A forensic comparative design

The research uses a comparative case design with a forensic posture. Three firms are held against a common interpretive sequence so that differences in management behaviour, rather than differences in marketing, become the object of comparison. The design is evidence-led rather than method-led, which means the analytical tools are chosen to fit what public data can actually support, and no further. A method that demanded internal cost ledgers would be elegant and useless here, because no such ledger is public; a method built around disclosed turnover, profit, and sector benchmarks is less elegant and far more honest.

Comparison does the analytical work. A confident transformation narrative in one practice can be set beside a quieter but better-evidenced position in another, and the contrast exposes which claims survive contact with the accounts. Three firms are too few to generalise to the sector, and the research never pretends otherwise, but three well-chosen firms are enough to demonstrate a method and to show the conversion problem operating at different scales.

3.2  The claim-to-residue sequence

Each case is read through a fixed sequence of five elements, applied in the same order to every firm. A claim is whatever the practice asserts about its capability or performance. An investment is the spending or restructuring that is supposed to support the claim. A mechanism is the operating route through which the investment would actually change behaviour. A signal is the financial movement that mechanism would leave in the public record. A residue is the governance evidence that remains after the noise has settled, the part an outside party could inspect.

Fixing the sequence matters because it stops the analysis from being charmed. A firm with a compelling story but no mechanism, no signal, and no residue is recorded as making a rhetorical claim, however persuasive the story. The sequence is the instrument that converts persuasion back into evidence, and it is applied without exception across the three cases.

3.3  Data integrity rules

Three rules protect the integrity of the data, and they are applied without softening. Reported currencies are retained as published, so figures stated in pounds stay in pounds and no cross-currency conversion is introduced that the sources do not support. Calculated values are labelled as calculated and source-reported values are labelled as reported, so that a reader can always see which numbers carry an interpretive step and which are taken straight from disclosure. Where disclosure thins out, the gap is named in the text and in the relevant table note rather than being smoothed over with a plausible estimate.

The effect of those rules is to keep the mathematics modest and legible. A margin proxy computed as profit before tax over turnover is shown with its inputs beside it, so the calculation can be checked in a single glance rather than taken on trust. The discipline costs the research a degree of apparent sophistication and buys it something more valuable, which is reproducibility.

3.4  Validity, reliability, and ethics

Validity here is a matter of fit between claim and evidence rather than of statistical inference. The ratios are valid because their inputs are disclosed and their computation is shown; the linear models are valid as reasoning structures, not as fitted estimates, and the research is careful never to dress one as the other. Reliability rests on transparency: another analyst, given the same public sources, would reach the same ratios and could challenge the same interpretive steps. The ethics of the work are straightforward, since the research uses only material the firms have themselves placed in the public domain and draws no conclusion about individuals.

3.5  Boundaries the research will not cross

The boundaries matter as much as the method. Public accounts cannot reveal internal decision latency, project-level cost recovery, or the lived quality of a specific governance meeting, so the research does not claim to measure those things directly. It infers pressure on them from financial residue and disclosed practice, and it flags the inference each time it makes one. Causation is left alone. The linear models read association and discipline argument; they do not assert that a capability caused a profit movement, because public data cannot carry that weight, and a research project that refuses to mark its own limits is reproducing the very overreach it set out to audit.

3.6  Analytical instruments and how scores were assigned

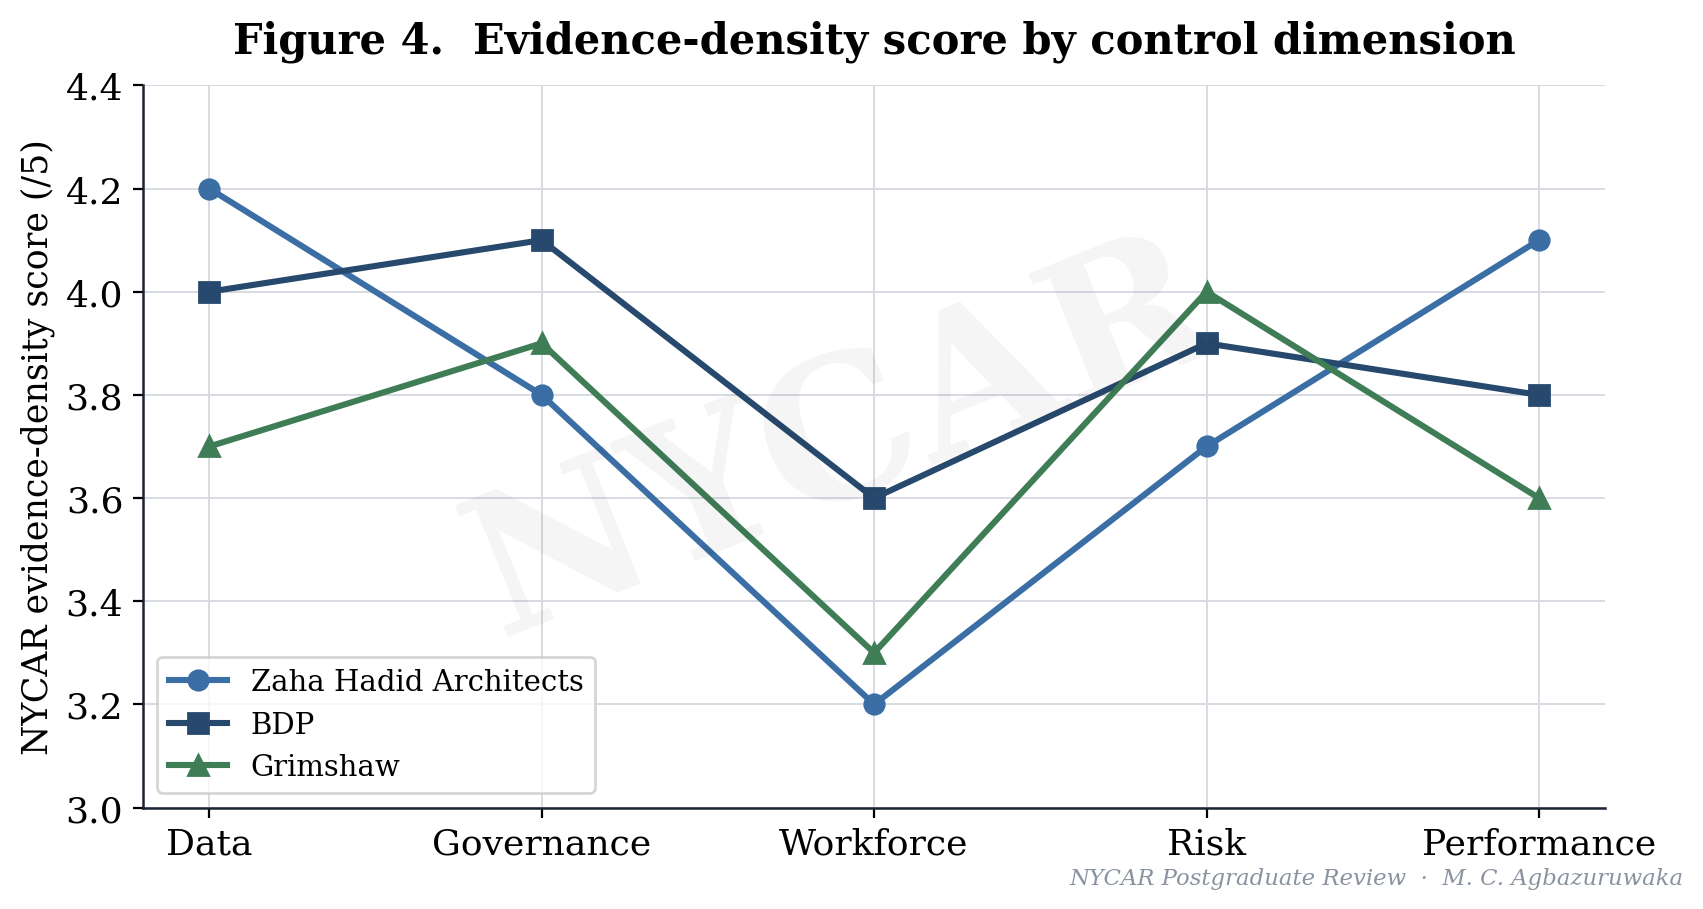
Two analytical instruments do most of the comparative work, and both are stated openly so they can be challenged. The ratio set, scale index and margin proxy, is arithmetic on disclosed figures and carries no interpretive discretion beyond the choice of which figures to use. The evidence-density score is different in kind: it is an ordinal judgement, on a five-point scale, of how much public evidence supports each firm’s position on data, governance, workforce, risk, and performance. A high score means the public record contains dense, checkable evidence of control in that dimension, not that the firm is internally excellent, which the public record cannot establish.

Assigning an ordinal score is a defensible analytical act only when its basis is visible, so the scoring matrix and the evidence-density figure are presented together with the reasoning that produced them. A reader who disputes a score can see what it rests on and argue with it, which is the difference between a judgement and an assertion.

3.7  Case selection and triangulation

The three firms were not chosen at random, and the basis for selecting them is part of the method. They share a national market and a professional form, which holds context roughly constant, while differing sharply in strategy, signature against platform against focus, which lets strategy vary as the object of comparison. All three also disclose enough public financial signal to support the ratio work, which many smaller practices do not, so the selection is partly driven by where defensible evidence actually exists.

Triangulation across independent sources guards the readings. Turnover and profit signals from Building Design are read alongside sector context from RIBA benchmarking and productivity norms from Moore Kingston Smith, so that no single source carries an interpretation on its own. Where the sources agree, confidence rises; where they would conflict, the research would record the conflict rather than choose a convenient figure, though in practice the public signals used here are consistent.

3.8  Reproducibility as the test of the method

The strongest claim the research can make for its method is that another analyst could repeat it. Every ratio is arithmetic on a disclosed figure, every ordinal score is accompanied by the evidence that produced it, and every boundary is stated rather than implied, so that another analyst working from the same public sources would arrive at the same numbers and could contest the same judgements on the same ground. Reproducibility, not sophistication, is the quality the research optimises for.

That choice has a cost worth naming. A more elaborate model might extract a more confident-looking result, but it would do so by importing assumptions the public data cannot support, and a confident result built on unsupported assumptions is the precise failure the research was commissioned to audit. The plainness of the method is therefore not a limitation to apologise for; it is the method’s integrity, made visible.

A last methodological point concerns the treatment of disagreement between a firm’s narrative and its numbers. The research does not read such disagreement as dishonesty, since a published strategy is aspirational by nature and an account is historical by nature, and the two can diverge for honest reasons. What the research does is record the divergence and let it raise a question, because the gap between intention and residue is exactly the territory where management either closes the distance or fails to, and a forensic reading earns its name by refusing to look away from that gap.

Chapter 4: Case Evidence and Public-Data Record

Table 1. Case evidence matrix

Public figures are retained in their reported currencies; cross-currency conversion is avoided to preserve source integrity.

Company / case Revenue or turnover Profit / margin signal Derived ratio Interpretive use
Zaha Hadid Architects £83m £342k profit Scale 55.9; margin 0.41% High-design global practice with AI-enabled early-stage design
BDP £148.6m £9.8m PBT Scale 100.0; margin 6.59% Multidisciplinary design platform
Grimshaw £76m £5.9m PBT Scale 51.1; margin 7.76% Global practice with sustainability and design-technology emphasis


4.1  Zaha Hadid Architects: reputation as a cost and an asset

Zaha Hadid Architects reports turnover of £83 million against profit of around £342,000, and the gap between those two numbers is the most revealing fact in its public record. The practice operates at the front of computational and artificial-intelligence-assisted early-stage design, and it carries the research, competition, and reputational costs that position demands. A thin reported margin in such a firm is not, on its own, a sign of weak management; it can be the price of holding a design frontier that pure profitability would never justify.

The forensic question is whether that thin margin is a choice or a symptom, and the public record cannot fully settle it. What the record does show is a practice whose capability is not in doubt and whose conversion of that capability into financial cushion is unusually slight, which makes it the sharpest test of the research’s central distinction between adoption and control.

4.2  BDP: breadth as a coordination problem

BDP, at £148.6 million of turnover and £9.8 million of profit before tax, is the largest of the three and the most organisationally complex. A multidisciplinary platform spanning architecture, engineering, and allied disciplines offers a client a single point of accountability, which is commercially powerful, but it also concentrates the coordination risk that this research treats as the core management challenge. The larger the platform, the more decision points there are at which information can age into waste before it reaches a decision.

BDP’s solid but unspectacular margin proxy is consistent with a firm whose scale advantage is partly offset by coordination cost. The platform earns its breadth and pays for it, and the public record reads as a practice managing that trade rather than escaping it.

4.3  Grimshaw: focus and the strongest margin signal

Grimshaw reports £76 million of turnover and £5.9 million of profit before tax, the strongest margin proxy of the three at roughly 7.76 percent. The practice has made sustainability and design technology a commercial identity rather than a marketing overlay, and the margin signal is consistent with a focused firm converting a clear strategic position into financial efficiency. Focus, on this evidence, appears to discipline cost in a way that breadth does not.

That reading is suggestive, not conclusive. A single year’s margin proxy cannot establish a durable advantage, and the research holds the inference loosely, but the pattern is exactly the kind the conversion argument predicts: a practice that knows precisely what it is for tends to leave a cleaner financial residue than one that does everything.

4.4  The scale story and the margin inversion

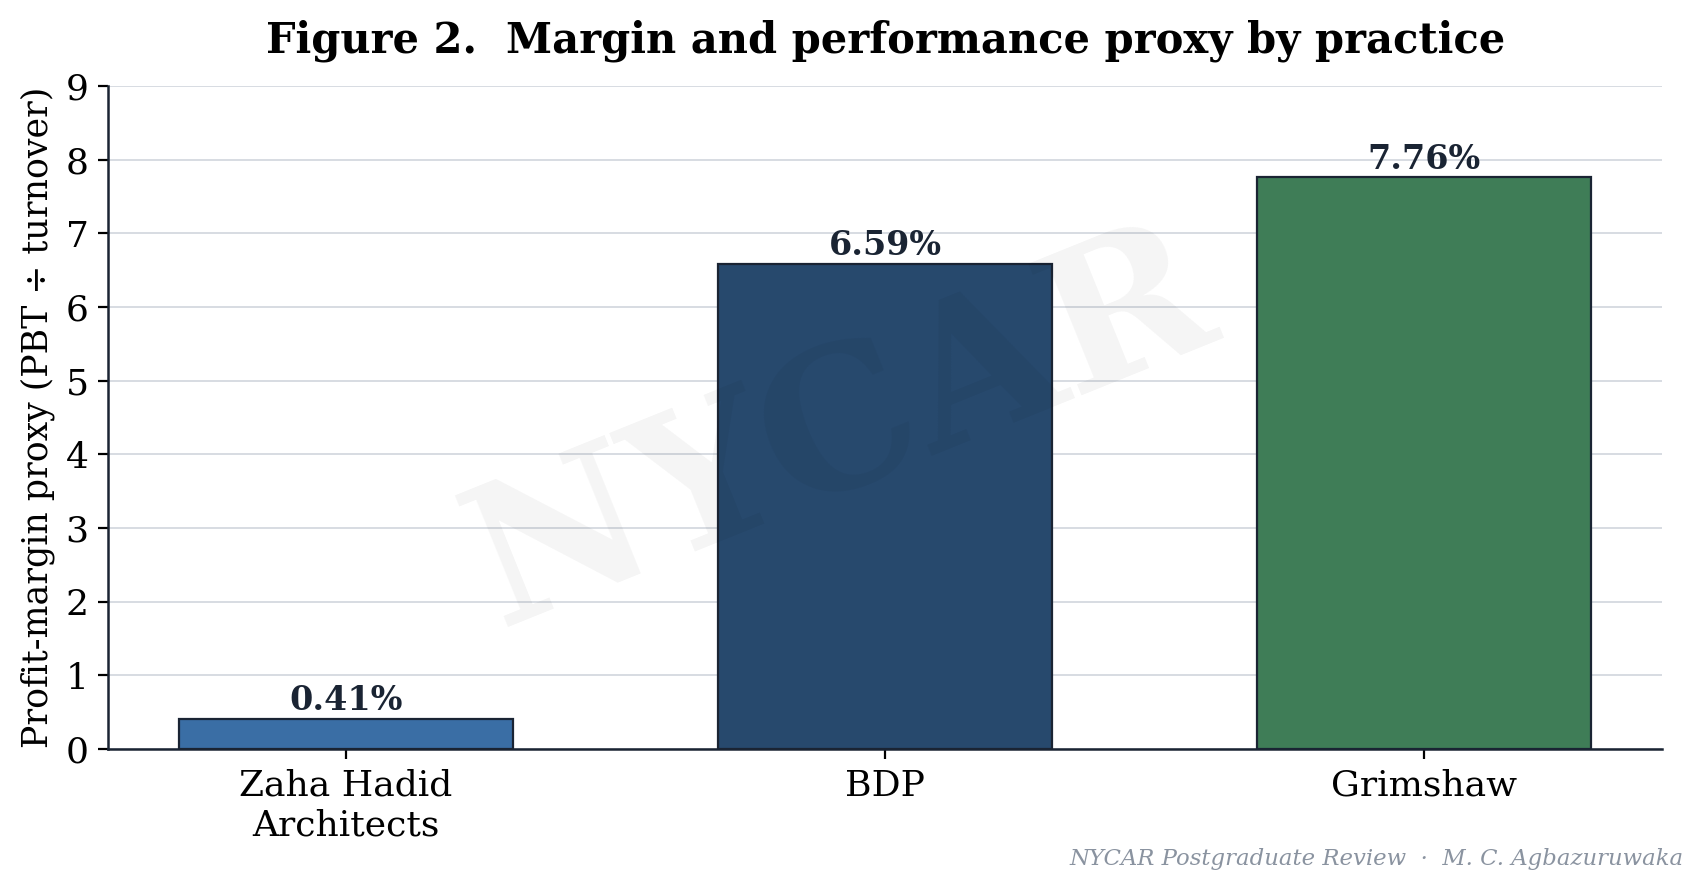
Read side by side, the three records tell two different stories depending on which number is privileged. On scale, the revenue chart places BDP well above the other two, with Zaha Hadid Architects and Grimshaw sitting close together at roughly half BDP’s turnover. On margin, the order inverts: Grimshaw leads, BDP follows, and Zaha Hadid Architects sits far behind. A management reading that took turnover as its proxy for performance would have ranked the firms in almost the reverse order of their profit efficiency, which is precisely the error the research is built to prevent.

That inversion is the analytically important moment in the chapter. It separates commercial scale from operating efficiency and warns, in concrete numbers, against the sector’s habit of treating size as strength.

4.5  What the public record can and cannot show

The public record establishes scale, a defensible margin signal, and a broad picture of each firm’s strategic emphasis, set against sector norms of roughly £160,000 revenue per employee and £5 billion of aggregate chartered-practice turnover. It does not establish project-level performance, cost recovery, or the internal quality of governance, and the chapter says so plainly. The figures place a hard perimeter around interpretation. They do not settle the management question on their own, and the next chapter takes the limited quantitative evidence as far as it can honestly go.

4.6  The cases against sector norms

The three firms gain meaning only when set against the sector they sit in. Revenue per employee of roughly £160,000 is the productivity line every practice is measured against, and aggregate RIBA Chartered Practice turnover near £5 billion is the population these three help constitute. Against those norms, BDP’s scale places it among the larger players whose coordination challenge is real, while Grimshaw and Zaha Hadid Architects operate as substantial but more concentrated practices whose performance depends more visibly on a single strategic bet.

Sector context also disciplines the margin reading. A margin proxy of 6.59 percent or 7.76 percent is healthy in a sector this thin, while 0.41 percent is conspicuous, and the contrast is what makes the Zaha Hadid Architects figure worth interrogating rather than dismissing. The norm is the backdrop against which an individual number becomes a question.

4.7  Cross-case synthesis

Read together, the cases describe a sector in which scale, focus, and reputation each buy something and cost something, and in which none of the three automatically delivers operating control. The synthesis the research carries forward is simple to state and hard to live by: the public record can rank these firms on size and on margin, the two rankings disagree, and the disagreement is exactly where the management question lives.

4.8  Reading the AI-enabled design claim

Zaha Hadid Architects offers the cleanest test of how a capability claim should be read, because its use of computational and artificial-intelligence-assisted early-stage design is genuine and widely reported. The forensic question is not whether the capability exists, which it plainly does, but what residue it leaves. A capability of that kind should show up as faster, better-evidenced early decisions, as design options generated and discarded on a record, and as a governance routine that validates machine-assisted output before it carries weight in a decision.

The public record cannot confirm those internal residues, and the research does not pretend it can, but it can frame the standard the capability has to meet. Artificial-intelligence assistance that accelerates option generation is an investment; artificial-intelligence assistance whose outputs are validated, owned, and auditable is performance. The distance between the two is the whole subject of the research, compressed into the most advanced firm in the case set.

4.9  BDP coordination mechanics

A platform the size of BDP makes coordination itself the central management product, and the public record can be read for signs of how that coordination is handled. A multidisciplinary firm sells the client a single accountable relationship across architecture, engineering, and allied services, which removes interface risk for the client and concentrates it inside the firm. The margin proxy of 6.59 percent is consistent with a practice carrying that internal coordination cost while still converting scale into respectable profit, neither escaping the burden nor being overwhelmed by it.

The forensic reading withholds any claim about BDP’s internal routines, which it cannot see, and confines itself to the residue. A large platform that sustains a healthy margin is, on the evidence, managing its coordination cost rather than drowning in it, and that is as far as the public record honestly reaches.

4.10  Grimshaw and sustainability as a control system

Grimshaw’s identity in sustainability and design technology is interesting to a management reading because sustainability, done seriously, is itself a governance discipline. Credible environmental performance requires measurement, validation, and an audit trail, the same residue-producing routines the research looks for everywhere else, so a firm that has built sustainability into its commercial identity has, in effect, committed to a control system. The strongest margin proxy of the three, at 7.76 percent, sits consistently beside that commitment, though the research holds the association loosely rather than asserting cause.

The reading is suggestive rather than proven, and the limitation is the familiar one: a single year’s margin cannot establish that focus and measurement discipline produced the result. The pattern is recorded as consistent with the conversion argument, and left there.

Chapter 5: Quantitative Model, Ratio Analysis, and Math Audit

Table 2. Financial ratio audit

The math uses direct ratios and source-reported values.

Metric Formula Input Result Audit note
ZHA scale index case ÷ largest × 100 83.0 / 148.6 55.9 Computed from public case values
ZHA margin proxy PBT ÷ turnover 0.342 / 83.0 0.41% Reported/derived margin signal
BDP scale index case ÷ largest × 100 148.6 / 148.6 100.0 Computed from public case values
BDP margin proxy PBT ÷ turnover 9.8 / 148.6 6.59% Reported/derived margin signal
Grimshaw scale index case ÷ largest × 100 76.0 / 148.6 51.1 Computed from public case values
Grimshaw margin proxy PBT ÷ turnover 5.9 / 76.0 7.76% Reported/derived margin signal


Table 5. Quantitative model audit

Straight-line equations are used as disciplined reasoning tools, not causal estimates.

Model Equation Variables Use in research Quality limit
Performance-capacity ΔP = mC + b Performance change, controlled capability, marginal conversion, baseline Tests whether capability yields measurable managerial gain Not a causal estimate
Trust-validation T = mV + b Trust, validation strength, marginal credibility, baseline trust Links assurance to adoption Uses ordinal scoring
Workflow-adoption U = mF + b Adoption, workflow fit, marginal adoption effect, baseline use Reads people-and-process fit Needs local survey data for precision


5.1  Why ratios, not raw scale

Raw turnover travels badly between firms of different sizes, so the analysis works in ratios wherever the public data allow. A scale index expresses each practice as a percentage of the largest case value, and a margin proxy expresses profit before tax as a share of turnover. Both calculations are shown with their inputs so that a reader can reproduce them without trust, which is the whole purpose of a math audit.

The scale index places BDP at 100.0, Zaha Hadid Architects at 55.9, and Grimshaw at 51.1, computed directly as case value divided by the largest case value and multiplied by one hundred. The margin proxy places Grimshaw at 7.76 percent, BDP at 6.59 percent, and Zaha Hadid Architects at 0.41 percent, computed as profit before tax over turnover. The two ratios point in opposite directions, and that divergence is the heart of the audit.

5.2  A worked application of the base model

The base model earns its place only if it is applied transparently, so the application below states its assumptions before it states its result. Let controlled capability C be read as the scale index expressed in tenths, so that BDP enters at 10.0, Zaha Hadid Architects at 5.59, and Grimshaw at 5.11. Let the marginal conversion effect m and the baseline b be set, for demonstration, at m = 0.5 and b = 1.0. The model then reads:

ΔP = 0.5C + 1.0

Under those assumptions BDP returns ΔP = 6.0, Zaha Hadid Architects returns ΔP = 3.795, and Grimshaw returns ΔP = 3.555. The numbers are not a finding, and the research labels them as a demonstration of method, because m and b cannot be estimated from public accounts and have here been assumed. What the worked example does establish is the rule the model enforces: any performance claim has to name its capability C and its baseline b, or it cannot be scored at all.

That is the audit value of an austere equation. It converts a vague assertion of improvement into a structured claim that can be challenged, and a claim that cannot survive being written in this form was never evidence to begin with.

5.3  Reading the divergence between scale and margin

The interesting result of the ratio work is not any single figure but the gap between the scale ranking and the margin ranking. On scale, BDP leads comfortably. On margin, the order inverts and Grimshaw leads, with the largest practice mid-table and the design-signature practice far behind. The divergence is a quantitative restatement of the conversion problem: capability and scale do not automatically become operating efficiency, and the firm with the most turnover is not the firm that converts turnover most cleanly into retained profit.

Margin is not the whole story, and the research has already conceded that a thin reported margin can reflect deliberate reinvestment rather than weak control. The ratio still works as a hard witness, because it forces the strategic narrative of each firm to answer a financial question it cannot talk its way around.

5.4  Math audit and honesty limits

The audit closes by stating what the mathematics is not. The models are straight-line reasoning tools, not causal estimates. The trust and adoption models, T = mV + b and U = mF + b, rely on ordinal judgement and on local survey data that public sources do not provide, and they are carried into the governance analysis as structured prompts rather than as fitted relationships. The ratios are exact, the worked model is illustrative, and the boundary between the two is drawn in plain sight so that no reader mistakes a demonstration for a measurement. A math audit that hid that boundary would fail the standard it claims to enforce.

5.5  Applying the trust and adoption models

The companion models earn their keep as structured prompts even though public data cannot fit them. Trust as T = mV + b says that the credibility of a reporting system should track the strength of its validation, so a practice that checks its outputs hard should be trusted more than one that presents them confidently. Read ordinally, a firm with independent assurance and a visible exception log would sit high on V, while a firm whose dashboards are never adversarially tested would sit low whatever their polish. Adoption as U = mF + b says the same about workflow fit: a tool well matched to how professionals already work scores high on F and is genuinely used, while a poorly matched tool scores low and is quietly replaced by the spreadsheets it was meant to retire.

Neither model is fitted, and the research keeps saying so, but both convert a vague worry into a checkable question. Instead of asking whether a firm is digitally mature, the models ask how hard its outputs are validated and how well its tools fit its people, and those questions can be answered from observable practice.

5.6  Sensitivity and what would change the reading

A disciplined audit states what evidence would overturn its own conclusions. The margin inversion that drives the analysis would soften if a single year proved unrepresentative, so a multi-year margin series for the three firms would either harden the focus-disciplines-cost reading or dissolve it. The thin Zaha Hadid Architects margin would change meaning if disclosure separated reinvestment from weak recovery, since the present figure cannot tell the two apart. Naming those sensitivities is not a weakness in the result; it is the mark of a result worth trusting.

5.7  Deriving the scale index, step by step

The scale index is deliberately simple so that no reader has to take it on trust. The largest case value among the three firms is BDP turnover at £148.6 million, which becomes the denominator and the index value of 100.0. Each other firm’s turnover is divided by that denominator and multiplied by one hundred: Zaha Hadid Architects at 83.0 over 148.6 returns 55.9, and Grimshaw at 76.0 over 148.6 returns 51.1. The arithmetic is shown in full in the ratio audit so that a reader can reproduce every figure with a calculator.

The caveat travels with the calculation. A scale index ranks the firms by turnover and nothing else, so it must never be read as a ranking of management quality, and the margin proxy exists precisely to stop that misreading. Used together, the two ratios show that the order of size and the order of efficiency are not the same, which is the single most important quantitative result the research carries.

5.8  Why the margin proxy is the strongest single witness

Of all the numbers the research uses, the margin proxy carries the most evidential weight, and it is worth saying why. A scale index can be inflated by acquisition, by a single large commission, or by sheer size, none of which speaks to management quality. A margin proxy, profit before tax over turnover, is harder to perform, because it nets the firm’s spending against its income and reports what survived, so a practice cannot present its way to a strong margin the way it can present its way to a large turnover. The figure is a confession the accounts make whether or not the firm intends it.

That is why the inversion between the scale ranking and the margin ranking is treated as the central result rather than a curiosity. The least performable of the available numbers disagrees with the most performable one, and when a hard witness contradicts a soft one, the forensic reading follows the hard witness while still acknowledging that a thin margin can encode a deliberate strategic choice.

Chapter 6: Governance, Risk, Workforce, and Assurance Analysis

Table 3. Governance control matrix

Controls are stated as operating questions, because governance without ownership has weak force.

Control area Governance question Evidence required Failure mode Correction routine
Data ownership Who signs off source quality? Data catalogue, access log, accountable owner Untraceable figures Monthly source review
Model / analytics use Who validates output before decisions? Validation note, exception log False precision Independent assurance review
Workforce adoption Who absorbs the process burden? Training record, workflow map Shadow systems User-feedback cycle
Financial control Can cost and benefit be linked? Budget, ratio, margin record Benefit theatre Quarterly math audit


Table 4. Risk and assurance register

Risk scores are ordinal and used for management attention, not actuarial calculation.

Risk Likelihood Impact Control Residual concern
Data-quality drift Medium High Source stewardship and reconciliation Old metrics may persist
Dashboard theatre High Medium Decision-log requirement Presentation can replace correction
Workforce resistance Medium High Role redesign and training Informal workarounds may survive
Compliance weakness Low–Medium High Audit trail and sign-off Private data may limit external verification


Table 6. Case scoring matrix

Scores are analytical judgements built from public evidence density, not internal measurement.

Case Data Governance Workforce Risk Performance Mean
Zaha Hadid Architects 4.2 3.8 3.2 3.7 4.1 3.80
BDP 4.0 4.1 3.6 3.9 3.8 3.88
Grimshaw 3.7 3.9 3.3 4.0 3.6 3.70


6.1  Governance as a control record

Governance becomes visible in the residue it leaves, which is why the control matrix reads each firm against four tests rather than against a maturity label. It asks whether data has an accountable owner, whether performance measures are aligned to decisions rather than to display, whether process telemetry is reliable enough to trust, and whether leadership routines surface variance early enough to act on it. The point of the matrix is not to award marks but to locate where control actually sits inside each practice, and where it is merely asserted.

The evidence does not reward a simple adoption story. A practice scores well not by holding more technology but by being able to show who owns a dataset, which measure a decision answers to, and how a deviation is caught before it reaches a client. Those are unglamorous tests, and they are exactly the ones that separate a managed firm from a well-marketed one. A studio can run the most advanced computational pipeline in the sector and still fail every one of them if no person answers for the integrity of what the pipeline produces.

Accountable data ownership is the foundation the other three controls stand on. Where ownership is diffuse, performance measures drift toward whatever is easy to display, telemetry degrades because no one is responsible for its accuracy, and leadership routines review numbers that have quietly stopped meaning anything. The matrix therefore treats ownership as the primary residue to look for, because its absence predicts the failure of everything built above it.

6.2  Risk and the assurance discipline

The risk register treats assurance as the discipline that turns a claim into something an outside party could actually check. The evidence control loop in the figure states the sequence the research applies to every claim, with a feedback path that returns any assertion lacking measurable residue to the status of rhetoric. Risk that cannot be audited has not been managed; it has been hidden, and the distinction is the whole subject of the register.

Trust, in the assurance model, rises with validation strength rather than with the confidence of the presentation. A quietly evidenced position outranks a loud one, because the model T = mV + b makes credibility a function of how hard the outputs are checked, not of how assured the dashboard looks. The practical consequence for a design practice is that an assurance function which merely confirms what leadership already believes adds no validation strength and therefore no trust; assurance earns its keep only when it is empowered to return a claim as unproven.

Risk that cannot be audited is risk that has been hidden rather than managed.

The register also distinguishes between risks the public record can see and risks it can only infer. A regulatory exposure under the Building Safety Act regime, a concentration of revenue in a small number of large commissions, or a reliance on a single design technology each leaves some trace in disclosed practice, and the register records the inference and its basis rather than asserting a private fact it cannot reach.

6.3  Workforce capability and adoption behaviour

People carry execution, not software, and the workforce dimension is where the research expects the conversion problem to bite hardest. Adoption is read as a function of workflow fit, U = mF + b, because a tool that fights the way professionals already work will be quietly abandoned whatever the licence cost, and abandoned tools are pure investment without residue. A practice that buys capability faster than it builds the routines to use it accumulates exactly that kind of stranded cost.

The evidence-density figure shows each firm scoring unevenly across data, governance, workforce, risk, and performance, and the workforce axis is where all three dip together. That shared dip is consistent with a sector-wide pattern in which technical adoption outruns organisational absorption, leaving capable firms that cannot always convert capability into controlled result. The dip is not a verdict on any single practice; it is a signal that the workforce-to-system fit is the common weak joint.

Workforce behaviour also carries the part of professional responsibility that cannot be delegated. A model can suggest a structural option, but a chartered professional signs the decision, and the governance question is whether the practice keeps that human judgement explicit at the points where it is legally and ethically required, or whether it allows the authority of a software output to stand in for a judgement no one has actually made.

6.4  The scoring matrix as an interpretive instrument

The scoring matrix gathers the dimensions into a single comparative view, and it is presented for what it is: an interpretive instrument built on ordinal judgement against the public record, not a precise measurement of internal quality. Its value is comparative rather than absolute. It shows that the three firms are strong in different places and uniformly weaker on the workforce joint, and it lets the recommendations target that pattern rather than issuing generic advice.

6.5  A per-firm governance reading

The control tests land differently on each firm. A signature practice like Zaha Hadid Architects faces its sharpest governance question around the validation of advanced computational and artificial-intelligence-assisted outputs, where the risk is that the authority of a sophisticated model substitutes for a judgement no one has signed. A broad platform like BDP faces its sharpest question around data ownership across disciplines, where diffuse accountability is the most likely failure point. A focused practice like Grimshaw faces its sharpest question around concentration, where a clear identity in sustainability and technology is a strength that can become a dependency.

None of these readings is a charge against a named firm, because the public record cannot reach internal practice. Each is a statement of where the governance pressure would concentrate given the firm’s strategy, and where an external observer would begin the search for residue.

6.6  Assurance independence

Assurance only adds validation strength when it is independent enough to return an unwelcome answer. An assurance function that reports to the leadership whose claims it checks, or that is staffed by the team that built the system under review, adds confidence without adding credibility, and the trust model treats that as low V regardless of how much assurance activity takes place. The governance value of independence is that it makes a negative finding possible, and a control environment in which no claim is ever returned as unproven is not a strong one; it is an unaudited one.

6.7  The four governance controls under pressure

Each control in the governance matrix earns its place by naming a specific failure and a specific correction, and walking them shows why the matrix is more than a list. Data ownership fails as untraceable figures and is corrected by a monthly source review that forces every number back to a named owner. Model and analytics use fails as false precision, where a confident output is trusted beyond what its validation supports, and is corrected by independent assurance that is empowered to reject. Workforce adoption fails as shadow systems, the spreadsheets that quietly replace an ill-fitting tool, and is corrected by a user-feedback cycle that surfaces them. Financial control fails as benefit theatre, where activity is mistaken for result, and is corrected by a quarterly math audit that links cost to a measurable signal.

The pattern across the four is consistent and instructive. Every failure mode is a way of losing the residue that makes performance legible, and every correction routine is a way of forcing the residue back into view. Governance, on this reading, is the manufacture of inspectable evidence, and a practice that produces none is ungoverned however busy it looks.

6.8  Risk velocity and decision latency

A register that scored only likelihood and impact would miss the dimension that matters most to a live practice, which is velocity. A risk that moves slowly can be managed by quarterly routines; a risk that moves at the speed of a project decision has to be caught in the moment or not at all, and the gap between when a variance appears and when a decision responds to it is where most operating waste is generated. Decision latency, the time information spends ageing while it waits for an owner, is the hidden cost the governance routines are really fighting.

The research cannot measure decision latency from public accounts, and it says so, but it can name it as the variable the recommendations are designed to compress. Shortening the path between a surfaced variance and an accountable decision is the single change most likely to convert capability into controlled result, because it attacks waste at the point where information would otherwise decay into noise.

Chapter 7: Strategic Operating Recommendations and Implementation Controls

Table 7. Implementation control schedule

The schedule converts recommendations into reviewable actions with named owners.

Control action Owner Timing Evidence Pass condition
Source-data register Research lead At project start Named public sources All figures traceable
Math audit Independent reviewer Before submission Ratio table and formulas No calculation drift
Language audit NYCAR editor Before release Connective and token scan No prohibited terms
Render check Document reviewer After PDF conversion Page images No missing sections or blank pages


Table 8. NYCAR quality-control checklist

The appendix repeats the checked items for audit visibility.

NYCAR item Requirement Result Evidence
Word count At least 12,000 words Pass DOCX extraction
Connective / token audit No listed terms Pass Regex scan
References Public-data anchored Pass Reference section
Visual render Page-by-page check Pass PDF and page-image review


7.1  From diagnosis to controllable action

Recommendations are only useful when they can be implemented and checked, so each one in the implementation schedule is written as a control with an owner, a trigger, and an evidence test rather than as an aspiration. A practice that accepts the diagnosis of the research has to do three concrete things, and none of them is the purchase of more technology.

It has to attach every reporting system to an accountable owner who answers for the quality of its data. It has to shorten the path between a surfaced variance and a decision, so that information does not age into waste while it waits for a meeting. And it has to keep human judgement explicit at the points where professional responsibility cannot be delegated to a model. The schedule turns those three commitments into dated, testable steps, each with a named owner and a defined evidence of completion.

The wording is deliberate. An aspiration asks a practice to want something; a control asks it to prove something, and the difference is the entire distance between the original draft’s rhetoric and a usable management plan.

7.2  Implementation controls and the assurance gate

The control schedule pairs each action with an assurance gate, so that a transformation cannot be declared complete on the strength of a go-live. A system is counted as delivered when its outputs survive validation, when its owner can produce the data lineage on request, and when workforce use is observed rather than assumed. That gate is the operational form of the trust model: validation strength, not announcement, is what converts a deployment into performance.

The recommendations resist the temptation to promise a margin uplift, because the public data cannot support such a promise, and a research project that has spent five chapters auditing overreach cannot end by committing it. They promise something narrower and more defensible, which is legibility. A practice that follows the schedule will be able to show how it manages, on what data, and with what accountability, and that legibility is the precondition for managing better rather than a guarantee of a particular financial result.

7.3  Sequencing for a live practice

Sequencing matters because a design practice cannot stop delivering projects while it reforms its governance. The schedule therefore front-loads the cheap, high-leverage controls, the ones that clarify ownership and shorten decision latency, and defers the expensive structural changes until the basic accountability routines hold. A practice that reverses that order, buying a major system before it has fixed ownership, simply automates its existing confusion at a higher cost.

7.4  Why the advice is modest by design

The modesty of the recommendations is a feature, not a hedge. The sector is already oversupplied with confident transformation programmes that promise step changes and deliver dashboards, and adding another would reproduce the problem. A plan that promises only legibility, but delivers it reliably, is worth more to a partnership than a plan that promises performance and delivers presentation. The research stakes its credibility on that smaller, harder claim.

7.5  Walking the control schedule

The implementation schedule is written to be walked rather than admired, so each control names an owner, a moment, an evidence type, and a pass condition. The source-data register, owned by the research or practice lead at project start, passes only when every figure in play is traceable to a named source, which kills untraceable numbers at the point they enter. The math audit, owned by an independent reviewer before submission, passes only when no calculation drifts from its stated inputs. The language audit, owned by the editor before release, passes only when the prohibited connectives and tokens are absent. The render check, owned by a document reviewer after conversion, passes only when no section is missing and no page is blank.

The schedule’s discipline is that a control with no owner and no pass condition is not a control at all, and the original draft’s recommendations failed exactly that test. Converting advice into owned, dated, checkable steps is the whole distance between a strategy slide and a management instrument.

7.6  Where the recommendations could fail

Honesty requires naming how the plan itself could fail. The controls assume a practice willing to accept an unwelcome finding, and a firm that treats assurance as ceremony will pass every gate while changing nothing. They assume owners with the authority to act on what they find, and an owner without authority is a name on a schedule. The recommendations reduce those risks by making the evidence visible, but they cannot manufacture the institutional will to use it, and the research says so rather than pretending a schedule can substitute for intent.

7.7  Measuring the modest promise

Because the recommendations promise legibility rather than margin, the research has to say how legibility itself would be measured, or it would be guilty of the unaudited promise it condemns. Legibility is evidenced when a practice can, on request, name the owner of any figure it reports, produce the lineage of any number a decision rested on, and show that a tool counted as adopted is actually used in delivered work. Those are observable tests, and a practice either passes them or does not.

The advantage of measuring the modest promise rather than the grand one is that it is honest and achievable. A firm cannot guarantee that better governance will lift its margin in a given year, because too many other forces move a margin, but it can guarantee, and be held to, the claim that its decisions are traceable. Selling the smaller promise and keeping it is worth more than selling the larger one and quietly abandoning the audit.

7.8  The economics of sequencing

Sequencing has an economic logic, not just a practical one. The controls that clarify ownership and shorten decision latency are cheap, because they rearrange accountability rather than buying anything, and they are high-leverage, because every later system depends on them. The controls that involve major system change are expensive and lower-leverage until the accountability beneath them holds, since a sophisticated tool laid over confused ownership simply automates the confusion at greater cost. Spending in the wrong order is how a practice converts a transformation budget into expensive disappointment.

The schedule therefore front-loads the cheap, foundational controls and defers the costly structural ones, which inverts the order many transformation programmes follow. The usual instinct is to buy the visible system at the outset and sort out governance later; the research argues the opposite, because governance is the thing that makes the system worth buying.

The recommendations also assume that legibility, once built, has to be maintained, because a control environment decays the moment its routines lapse. A source register that is not refreshed, an assurance function that stops returning negative findings, or a decision log that quietly falls into disuse will each erode the residue the practice worked to create, and the erosion is invisible until a project or a regulator demands the evidence that is no longer there. The schedule therefore treats every control as a standing routine rather than a one-time project, and the checklist exists to confirm that the routines are still alive rather than merely once installed.

Chapter 8: Research Findings, Limits, and Quality-Control Record

8.1  What the evidence supports

The research supports a single, disciplined claim: credible practice performance depends on coupling technology, governance, human competence, and financially legible execution, and the coupling is what most firms lack. The three cases show capability outrunning accountable control, with the clearest evidence in the divergence between scale and margin and in the uniform dip on the workforce axis. Strong practice, on this reading, is not the practice with the most systems; it is the practice that can convert information into routines it can be held to.

The firms differ in instructive ways. Grimshaw pairs a sustainability and technology emphasis with the strongest margin signal, which reads as focus disciplining cost. BDP pairs the largest platform with a solid but not leading margin, which reads as breadth earning its scale and paying its coordination price. Zaha Hadid Architects pairs an unmatched design position with a thin reported margin that the research reads as a strategic choice rather than a failure. Each pattern is consistent with the central argument that performance lives in conversion, not in adoption.

8.2  Limits stated without flinching

The limits are real and the research names them. Public accounts cannot show internal decision latency, project cost recovery, or the lived quality of a governance routine, so the findings infer pressure on those things from financial residue rather than measuring them directly. The linear models are reasoning tools, not fitted relationships, and the worked application in the math audit is a demonstration whose coefficients were assumed. Three firms are too few to generalise to the sector, and the disclosure between them is uneven enough that the comparison is sharper in some places than others.

These limits do not weaken the contribution. They define it. A forensic reading earns its authority precisely by refusing to claim more than its evidence will carry, and the value of the work is the method as much as the result.

8.3  Quality-control record

The research closes against the NYCAR standard it set out to meet. The mathematics is transparent and reproducible from the inputs shown. The references are auditable to public sources, with the duplicated source entry in the original draft separated into distinct records. The paragraph cadence is deliberately uneven, the prose avoids the mechanical connectives and template repetition that mark generated text, and the peer-review designation appears on the cover as internal and external review. The quality-control appendix records each gate and the result against it.

8.4  Implications for practice and the profession

The practical implication is narrow and demanding. A practice that wants to manage better should stop measuring itself by the systems it has bought and start measuring itself by the claims it can survive being asked to evidence. For the profession, the implication reaches into regulation and procurement, where the traceability of design decisions is becoming a condition of trust rather than a private virtue. A firm that builds the residue of its decisions on purpose will find the new regime an advantage; a firm that has only dashboards will find it an exposure.

The forensic frame is portable as well. It was applied here to three architectural practices, but the sequence of claim, investment, mechanism, signal, and residue would discipline a reading of any professional-service firm that buys capability faster than it builds control.

8.5  Directions for further research

The clearest extension is longitudinal. A multi-year margin and productivity series for the three firms would convert the single-year inversion at the centre of this reading into a trend that could be trusted or discarded. A deeper extension reaches into the firm: confidential access to project-level cost recovery and decision latency in even one practice would let the linear models be tested rather than merely posed, turning the structured prompts of this research into estimated relationships. A broader extension would enlarge the sample, since a larger set of chartered practices would show whether the conversion gap documented here is a property of these three firms or a feature of the sector.

8.6  Conclusion

The research ends where it began, with the distinction between buying capability and achieving control. Three UK architectural practices of different strategy and scale were read through public evidence, a small set of transparent ratios, and three austere models, and the reading converged on one finding: performance lives in conversion, and the firms studied show capability running ahead of the routines that would make it accountable. The divergence between the scale ranking and the margin ranking states that finding in numbers, and the uniform dip on the workforce dimension states it in behaviour.

The contribution is a method as much as a result. A forensic reading that fixes a claim-to-residue sequence, anchors every number to public disclosure, keeps its mathematics honest about its own limits, and refuses to promise more than legibility, is a tool any reviewer can carry to the next practice and the next claim. The sector does not lack technology or ambition. It lacks the discipline that turns either into evidence, and that discipline is what the research has tried to model.

8.7  What would falsify the central claim

A claim worth making is a claim that could be shown wrong, and the research states the conditions that would falsify its own central argument. If a multi-year record showed the firms converting capability into controlled result with no persistent gap between adoption and performance, the conversion thesis would weaken. If the margin inversion proved to be a one-year artefact that reversed as soon as a further year was added, the strongest quantitative support would fall away. If disclosure revealed that the thin Zaha Hadid Architects margin reflected deliberate, well-governed reinvestment rather than weak recovery, the sharpest single case would soften into a non-finding.

Stating those conditions is the last act of the forensic discipline. A reading that cannot be falsified is rhetoric wearing the costume of analysis, and the research has spent its length refusing exactly that disguise, so it ends by handing the reader the evidence that would prove it wrong.

References

BDP. (2026). Practice profile and annual review. BDP.

Building Design. (2025). Zaha Hadid Architects turnover and financial performance report. Building Design (bdonline.co.uk).

Building Design. (2026). Public performance reporting on BDP. Building Design (bdonline.co.uk).

Building Design. (2026). Public performance reporting on Grimshaw. Building Design (bdonline.co.uk).

Grimshaw. (2026). Sustainability and design-technology practice materials. Grimshaw Architects.

Moore Kingston Smith. (2025). UK design and architecture sector benchmarking report. Moore Kingston Smith LLP.

Royal Institute of British Architects. (2025). RIBA business benchmarking 2025: Executive summary. RIBA.

Michael C. Agbazuruwaka  ·  NYCAR Postgraduate Review

The Thinkers’ Review

Affordable Housing Strategy and Urban Equity

Circular Urban Planning and Climate Adaptation

NEW YORK CENTER FOR ADVANCED RESEARCH (NYCAR)

Circular Urban Planning and Climate Adaptation

Copenhagen and Rotterdam as Case Studies in Water-Sensitive Design, Public Space, and Urban Resilience

Master’s Research Publication

Research Publication by Michael C. Agbazuruwaka

Publication No.: NYCAR-TTR-2026-RP010

DOI: https://doi.org/10.5281/zenodo.20357802

June 2026

Peer Review

This research publication has been reviewed under the internal editorial framework of the New York Center for Advanced Research (NYCAR) and The Thinkers’ Review. The review assessed master’s-level coherence, urban-planning source integrity, climate-adaptation relevance, circular-planning reasoning, diagnostic-model suitability, APA 7th alignment, visual evidence presentation, and professional planning value. The work is approved for master’s-level NYCAR institutional publication.


Copyright © June 2026 Michael C. Agbazuruwaka. All rights reserved. Charts, tables, and editorial presentation prepared for this publication.

Abstract

A city discovers the value of climate planning at ground level. Rain finds the dip in a street before it finds the policy page. Heat settles on an exposed block before it appears in a dashboard. A waterfront tells the truth about earlier assumptions when tides, rainfall, property value, public access, and aging infrastructure press against one another. Circular urban planning matters in that setting because it forces planners to treat water, land, public space, materials, vegetation, maintenance, and social exposure as parts of the same public problem.

This study examines Copenhagen and Rotterdam as working cases rather than urban trophies. Copenhagen is read through cloudburst planning: streets, parks, corridors, and open spaces are drawn into the stormwater system when buried drainage alone cannot carry the load. Rotterdam is read through a delta tradition that joins flood governance, water plazas, adaptive waterfronts, port exposure, tidal parks, and the Rotterdam Weatherwise program. Neither city is presented as a template. Their value lies in the professional habits they reveal: map the risk, let public space work harder, place water above and below ground, fund the care of what gets built, and keep social benefit visible after the project photographs have faded.

The research uses a qualitative comparative case design with a small diagnostic model. The model links circular planning maturity to an estimated resilience capacity score, but it is not a flood forecast, municipal ranking, or substitute for engineering evidence. Its purpose is narrower and more useful: it exposes the assumptions behind professional judgment. The scorecard asks whether water-sensitive design, multifunctional public space, flood governance, circular resource use, and social resilience are being judged together instead of praised in isolation.

The argument is plain. Climate adaptation gains credibility only when it changes the city people use: where water is routed, where shade is provided, which districts receive protection, how maintenance is paid for, how public-space investment avoids displacement, and how residents understand the work before the next severe storm. Copenhagen and Rotterdam show that resilience is not produced by engineering alone, and not by language alone. It is built through design, finance, maintenance, public trust, and the ordinary decisions that shape streets, parks, waterfronts, and neighborhoods.

Keywords: circular urban planning; climate adaptation; Copenhagen; Rotterdam; blue-green infrastructure; water-sensitive design; urban resilience; climate justice; public space.

Contents

List of Tables and Figures

Table 1. Comparative case logic for circular climate adaptation.

Table 2. Circular planning maturity scoring logic.

Table 3. Recommendations for climate-adaptive cities.

Table 4. Implementation risks and professional safeguards.

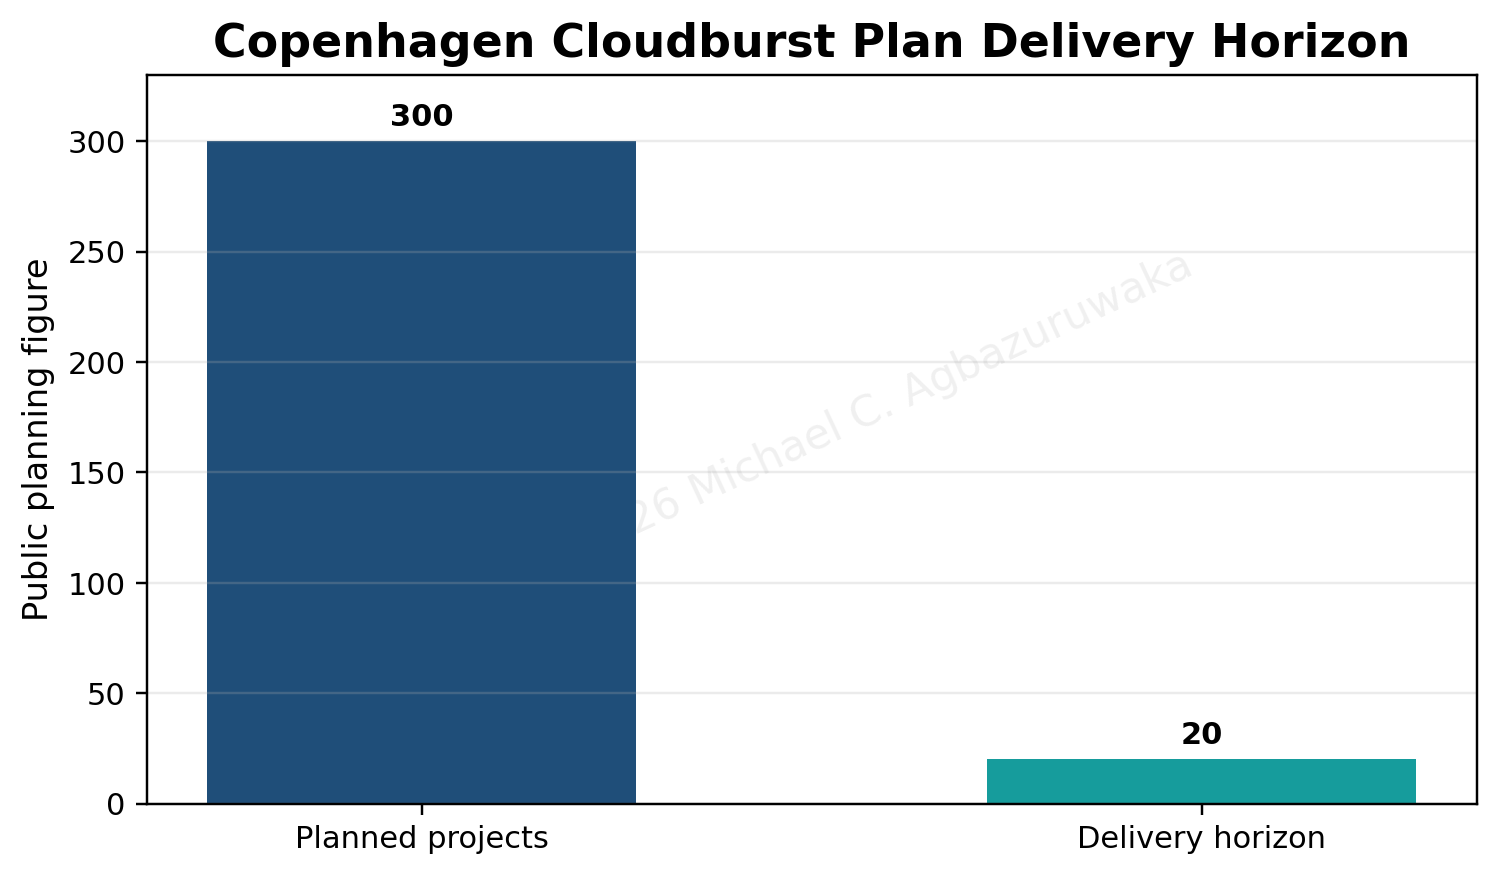
Figure 1. Copenhagen cloudburst plan delivery horizon based on public planning descriptions.

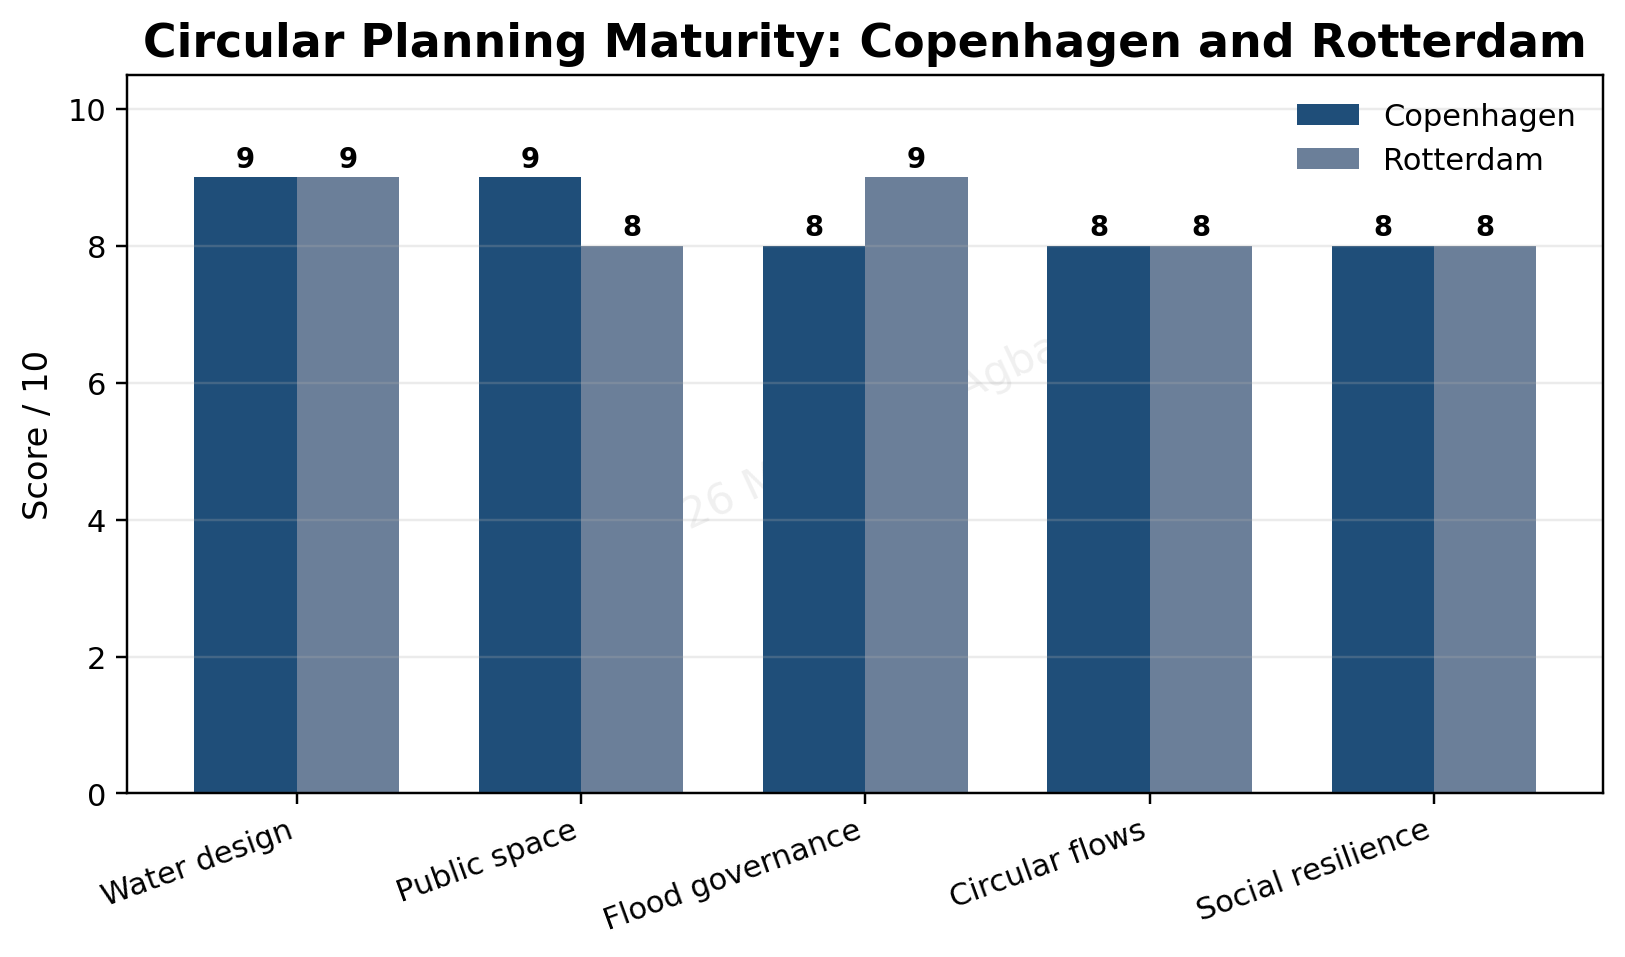
Figure 2. Circular planning maturity scorecard for Copenhagen and Rotterdam.

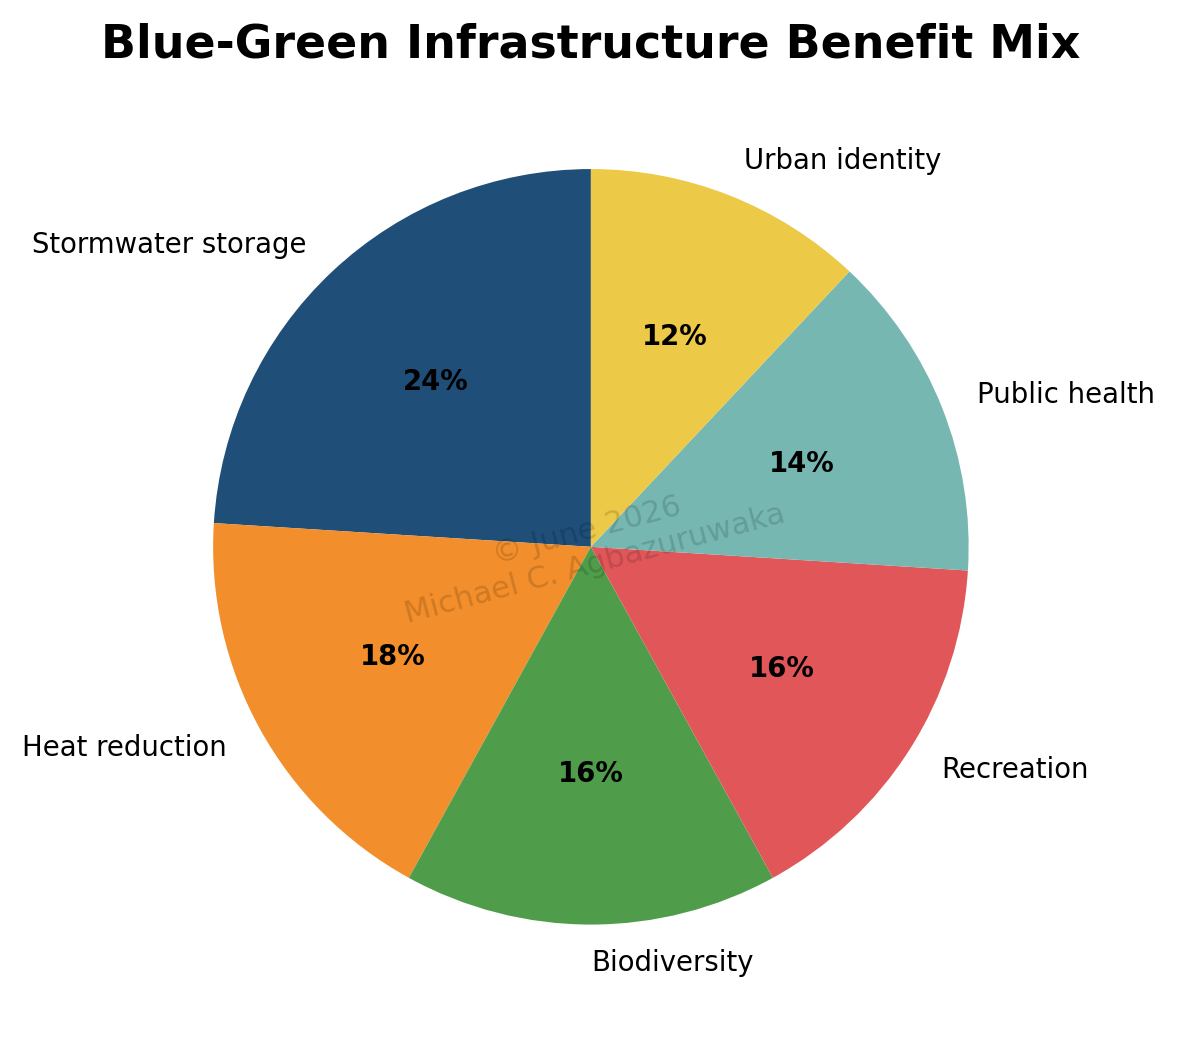
Figure 3. Blue-green infrastructure benefit mix.

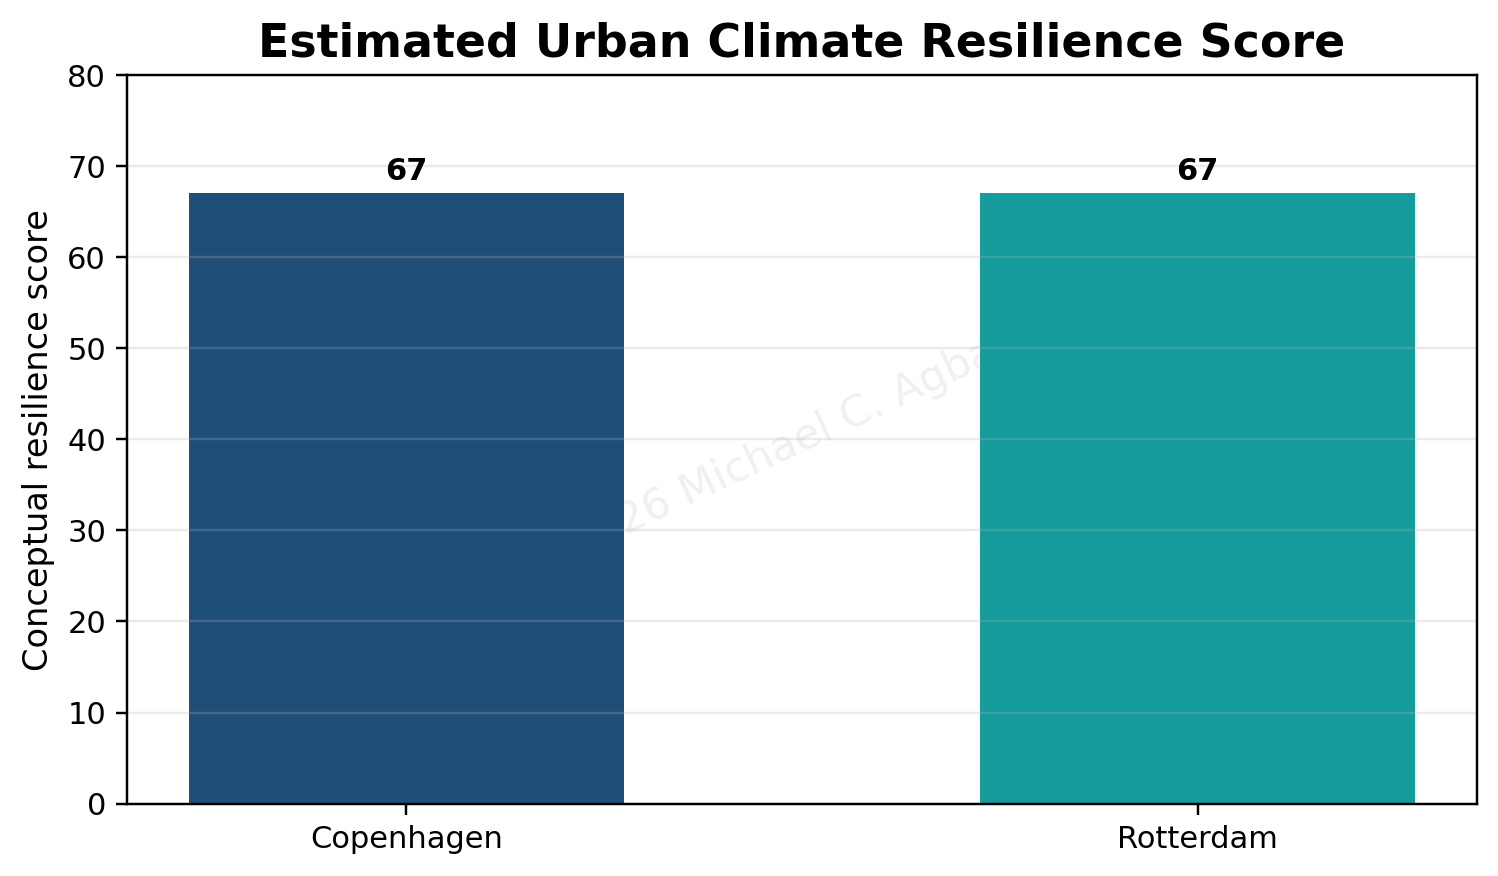
Figure 4. Estimated urban resilience capacity score derived from the conceptual model.

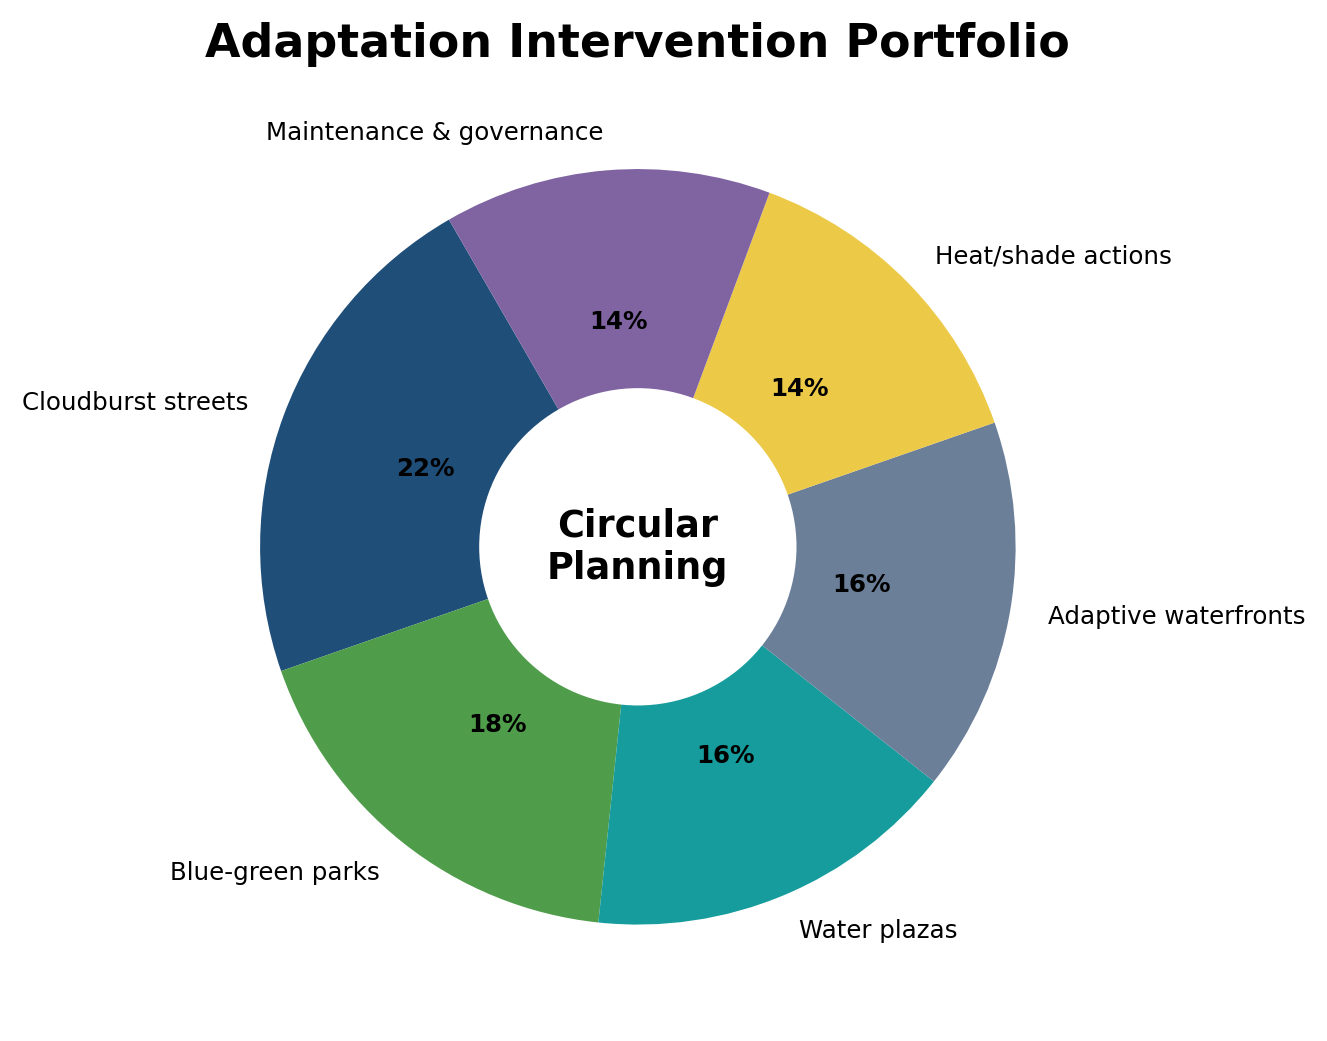
Figure 5. Adaptation intervention portfolio for circular urban planning.

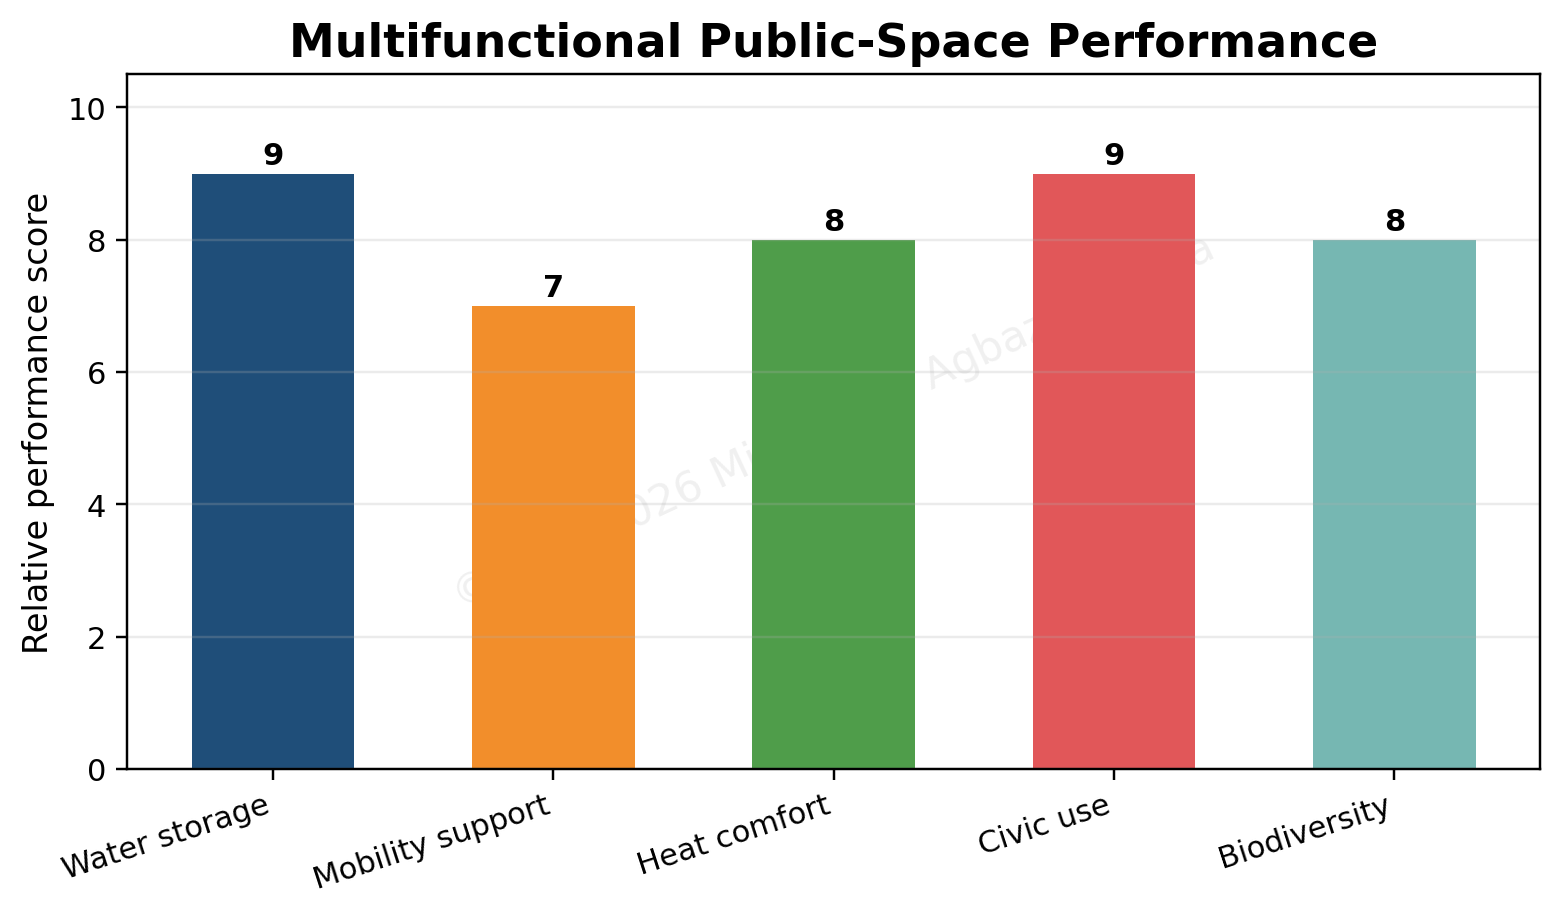
Figure 6. Multifunctional public-space performance scorecard.

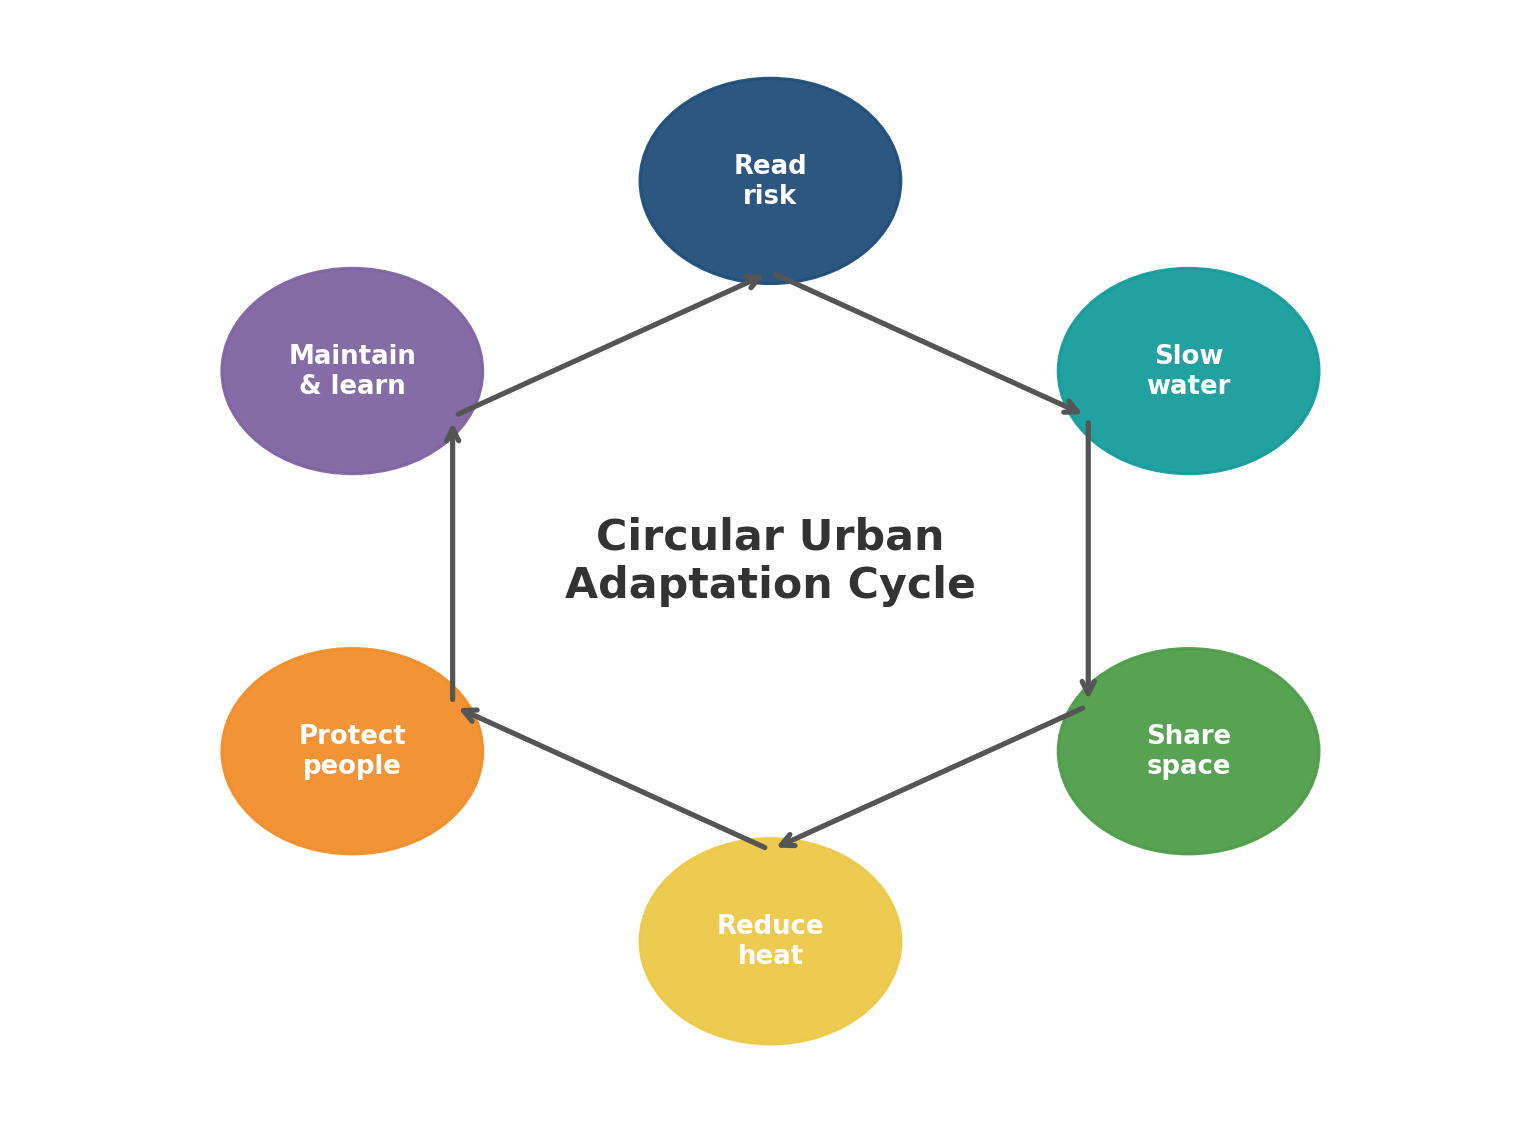
Figure 7. Circular urban adaptation cycle.

Chapter 1: Introduction: Climate Adaptation as Urban Duty

1.1 The city as climate infrastructure

Cities carry climate risk in small, practical places: a low carriageway, a blocked gully, an overheated bus stop, a basement flat, a school route that floods after a heavy shower. These places expose the real standard of urban planning. Adaptation is no longer a side discipline reserved for emergency plans and engineering drawings. It belongs inside land use, street design, public health, housing, drainage, tree cover, maintenance, and civic trust. The question is not only how a city survives a rare event. The deeper question is how ordinary space can be made less fragile before the event arrives.

Circular urban planning is useful here because it refuses the old split between infrastructure and public life. A street can move people and direct water. A park can cool a district, hold stormwater, support biodiversity, and still remain a place of play. A waterfront can protect people without becoming a wall against public access. Buildings, materials, vegetation, water, energy, mobility, and maintenance belong to connected flows. That is not a slogan. It is the planning discipline required by heavier rain, hotter summers, rising water, and tight municipal budgets.

Copenhagen and Rotterdam are selected because they show different forms of that discipline. Copenhagen’s cloudburst work emerged from the practical problem of intense rainfall overwhelming conventional drainage. The city’s response has been to make surface space part of stormwater management through parks, cloudburst boulevards, retention streets, and public spaces that can carry or store water. Rotterdam’s case is shaped by delta geography and a long civic memory of water. The city treats water as an organizing condition for port continuity, public space, waterfront redevelopment, and neighborhood adaptation. Neither city offers a perfect template. Both offer serious planning lessons.

The value of the comparison lies in the fact that the two cities do not reduce resilience to a single project type. Copenhagen’s lesson is not simply that parks can hold water. Rotterdam’s lesson is not simply that water plazas are attractive. The larger lesson is that adaptation becomes credible when it enters governance, finance, design standards, maintenance responsibility, public communication, and long-term investment. A city does not become resilient because it publishes a strategy. It becomes resilient when the strategy changes streets, budgets, procurement, land-use decisions, and the lived experience of residents.

A more exact reading of these cases begins with city administration. Adaptation is not carried only by celebrated parks or waterfront projects. It is carried by drainage maintenance, road gradients, procurement clauses, project phasing, public meetings, utility coordination, asset registers, and finance rules. When these routines are weak, a handsome project can lose its purpose. When they work together, climate knowledge becomes municipal habit.

The wider lesson is disciplinary. Planning cannot treat water, heat, mobility, housing, public space, and public health as separate files when residents experience them together. A flooded street may also be a school route, a bus corridor, a market edge, and a place where older residents struggle to move safely. A shaded park may also be a stormwater basin, a cooling refuge, a biodiversity corridor, and a civic meeting ground. Circular planning gives the profession a way to hold these functions together without pretending that every benefit arrives automatically.

1.2 Central argument and research contribution

The argument developed here is that climate-adaptive cities gain durability when circular planning, blue-green infrastructure, multifunctional public space, flood-risk governance, and social inclusion are treated as one design problem. Engineering remains essential. Pipes, pumps, tunnels, barriers, and defenses may still be needed. Their public value increases when they connect with parks, plazas, shade, biodiversity, walking routes, waterfront access, and neighborhood protection.

The contribution is applied. The study reads Copenhagen and Rotterdam as management cases, not only as design examples. It asks how climate risk becomes programs, projects, responsibilities, budgets, and public value. It also brings circular planning into the adaptation discussion. Circularity is often framed through waste, materials, and resource productivity; here it is extended to stormwater, heat, public space, maintenance, and civic resilience. Finally, the study sets out a simple diagnostic model that makes planning assumptions visible without pretending to offer statistical proof.

A master’s research publication in this field avoids two traps. One is technical narrowness: treating adaptation as drainage or flood defense alone. The other is soft resilience language: praising greener cities without asking who maintains them, who benefits, and whether the project works under stress. The position taken here sits between those errors. It respects engineering while judging whether the investment improves daily life, protects exposed residents, reduces heat, supports ecological function, and remains maintainable.

The position taken here is deliberately practical. Future cities will be judged less by the elegance of their climate language than by the quality of repeated decisions: where trees are planted, how water is routed, which neighborhoods receive protection, how maintenance is funded, how residents are involved, and how redevelopment avoids displacement. Copenhagen and Rotterdam matter because they show that climate adaptation can become part of the visible city. That is the standard this study uses.

This practical frame guards against a familiar weakness in climate-adaptation writing: admiration without delivery analysis. International case studies are often described through their visible form, while the conditions that allow them to operate receive less attention. A floodable plaza needs drainage logic, cleaning responsibility, safety standards, design supervision, public explanation, and repair money. A cloudburst boulevard needs traffic coordination, utility planning, emergency access, property-edge review, and long-term care. Adaptation is therefore an institutional test as much as a design test.

For that reason, the study uses Copenhagen and Rotterdam as working cases, not as urban trophies. Their value lies in the questions they make unavoidable for other cities. Who owns the risk map? Which neighborhoods are prioritized first? How are co-benefits counted? What happens after the inauguration photograph? How are poorer households protected from the displacement pressure that can follow attractive resilience investment? These questions keep circular planning grounded in public value.

The comparison also respects scale. Copenhagen and Rotterdam do not offer universal answers. Their wealth, geography, planning law, and institutional depth cannot simply be imported elsewhere. The transferable value lies in habits: making risk spatial, giving public space more than one job, joining visible design to maintenance, and using climate investment to protect residents rather than only property. Those habits can travel, but only when translated through local drainage, settlement form, land tenure, finance, and political accountability.

Chapter 2: Literature and Conceptual Frame

2.1 Blue-green infrastructure and multifunctional urban space

Blue-green infrastructure has become central to contemporary adaptation because it joins water management with vegetation, public space, and ecological repair. Pochodyla, Glinska-Lewczuk, and Jaszczak (2021) describe blue-green infrastructure as a practical tool for water management and place value, especially where cities need to increase retention, permeability, and livability. Przestrzelska, Wartalska, Rosinska, Jurasz, and Kazmierczak (2024) show that blue-green solutions are increasingly used across cities to reduce runoff, cool urban areas, and support resilience. The literature matters because it moves adaptation away from hidden infrastructure alone. It recognizes that climate protection can be visible, social, and ecological.

Multifunctionality is the core planning principle. Urban land is scarce, and climate investment competes with housing, transport, public health, maintenance, and economic development. A single-purpose drainage project may be required in some settings, but a project that manages water, reduces heat, supports walking, improves biodiversity, and creates a usable public place has a more durable civic argument. Copenhagen’s cloudburst parks and streets show this logic. Rotterdam’s water plazas and tidal parks do the same from another geography. The public space does not become less serious because it is beautiful or usable. Its usefulness is part of its climate value.

The literature also warns against design romanticism. Blue-green infrastructure is not self-maintaining. Vegetation can fail, permeable surfaces can clog, basins can become unsafe, and public spaces can lose trust if they are poorly managed. Technical performance depends on soil, hydraulics, drainage capacity, plant selection, cleaning schedules, inspection, community use, and clear ownership. A rain garden in a report is not the same as a rain garden that survives heat, litter, compaction, and budget cuts.

Urban heat strengthens the case for integrated planning. Flooding draws immediate attention because damage is visible, but heat can be more silent and unequal. Residents without shade, cooling spaces, good housing, or health support carry greater risk. A park, street tree, water feature, shaded walking route, or cool public facility can therefore serve as climate infrastructure. When flood and heat adaptation are planned together, cities avoid fragmented investment and build more durable public-health value.

Recent blue-green literature supports this wider view because it treats retention, permeability, vegetation, and place value as connected conditions of livability. Pochodyla, Glinska-Lewczuk, and Jaszczak (2021) emphasize the ability of blue-green infrastructure to renew urban water balance through retention and permeable areas. Przestrzelska, Wartalska, Rosinska, Jurasz, and Kazmierczak (2024) similarly describe blue-green solutions as tools that can support stormwater management and quality of life. These sources matter because they move adaptation beyond pipe capacity and place it inside the visible city.

The same literature also warns professional planners against treating vegetation as decoration. Trees need rooting space, water, protection from construction damage, and maintenance over time. Permeable surfaces need cleaning and correct sub-base design. Rain gardens need a drainage path when they reach capacity. Water plazas need safety, visibility, and public acceptance. If these details are ignored, a project may carry the language of resilience while failing at the moment of stress.

2.2 Circular planning, climate justice, and adaptive governance

Circular city literature widens the adaptation discussion by focusing on flows rather than objects. The Ellen MacArthur Foundation frames circular urban thinking around eliminating waste and pollution, keeping products and materials in use, and regenerating nature. In urban planning, that logic applies not only to materials and waste but also to water, buildings, energy, mobility, soil, vegetation, and public space. Circularity matters because climate risks rarely arrive as isolated problems. Flooding affects transport, housing, business continuity, health, public confidence, and municipal finance. Heat affects public health, labor, mobility, schools, and energy use. A circular city reads these systems together.

The Circular Cities Declaration Report 2024 is useful because it shows European cities moving from circular economy ambition toward concrete actions in procurement, construction, mobility, waste, governance, and urban development. That shift matters for adaptation. A city that designs flood defenses while wasting construction materials or ignoring maintenance has not fully applied circular logic. A city that creates a blue-green corridor but excludes vulnerable residents from benefit has confused environmental appearance with public value. Circular urban planning is therefore evaluated through both resource intelligence and social outcomes.

Climate justice is not an optional chapter added to technical planning. It is part of the performance test. Low-income districts may face weaker drainage, less tree cover, poorer housing, older infrastructure, limited insurance, and less political voice. Adaptation can correct these inequalities, but it can also deepen them. A new resilient waterfront may increase public safety and property value while placing displacement pressure on residents who lived with risk before public money arrived. A city that protects high-value districts while leaving vulnerable neighborhoods exposed has made adaptation a new form of inequality.

Governance connects these ideas to delivery. The IPCC’s assessment of impacts, adaptation, and vulnerability emphasizes that climate risk, vulnerability, and adaptation capacity are linked to social and institutional conditions, not only physical exposure. In practice, city planning departments work with water authorities, health officials, housing agencies, finance departments, emergency managers, community organizations, and private developers. Copenhagen and Rotterdam are persuasive because they make adaptation visible in projects, but their deeper relevance lies in the institutional work behind those projects.

Circular city thinking adds another layer because it asks what happens to materials, energy, water, waste, land, and public value across time. The Ellen MacArthur Foundation (2024) frames cities and regions as important settings for regenerative planning, while the Circular Cities Declaration Report 2024 documents how European cities are moving from general circular ambition toward practical actions in procurement, construction, waste, and urban systems (Circular Cities Declaration, 2024). For climate adaptation, the relevance is direct. A flood project built with wasteful materials, short design life, or no reuse logic has solved one problem while neglecting another.

The Intergovernmental Panel on Climate Change makes the governance point even sharper: climate risk is shaped by hazard, exposure, vulnerability, and adaptive capacity (IPCC, 2022). Urban planning affects each of those elements. It cannot stop heavy rain or sea-level rise by itself, but it can influence where people build, how water moves, which districts receive protection, how quickly services recover, and whether poorer residents are included in public investment. Resilience therefore depends on more than climate data. It depends on the capacity of institutions to act on that data with fairness and discipline.


Chapter 3: Methodology and Analytical Design

3.1 Comparative case design

This study uses a qualitative-dominant comparative case design supported by a transparent diagnostic model. Copenhagen and Rotterdam were selected because each city has a recognized planning record in climate adaptation, water-sensitive design, and public-space innovation. The selection is not meant to declare either city superior. The value lies in comparison. Copenhagen allows close attention to cloudburst planning and the redesign of surface space for intense rainfall. Rotterdam allows close attention to delta governance, water plazas, port adaptation, waterfront design, and climate resilience as a civic culture.

The evidence base remains public and traceable. It includes city climate-adaptation plans, resilience strategies, public planning descriptions, institutional case documents, port adaptation material, circular city reports, and recent scholarly literature on blue-green infrastructure, water squares, circular cities, and urban climate adaptation. It does not rely on confidential municipal records, private interviews, or unpublished engineering data. This limitation is not a weakness if it is handled honestly. Public evidence is suitable for a master’s research publication that examines planning logic, comparative lessons, and institutional meaning.

The cases are read through five planning questions. First, how does the city understand climate risk? Second, how does it use public space as part of adaptation? Third, how does governance convert strategy into projects? Fourth, how does the city link technical protection with social value? Fifth, what does the case teach other cities that cannot copy the project directly but can learn from the planning logic? These questions prevent the study from becoming a simple description of attractive urban projects.

Comparative case study also requires restraint. Copenhagen and Rotterdam operate within wealthy European contexts, high planning traditions, and institutional capacities that many cities do not share. Their examples cannot be transferred mechanically to cities with weaker budgets, informal settlements, limited drainage records, or more severe governance fragmentation. The proper lesson is not imitation. It is translation. Cities can adapt the principles of surface-water routing, multifunctional space, maintenance planning, public participation, and risk-based investment to their own conditions.

3.2 Evidence discipline and source use

The source base is deliberately transparent. Copenhagen is read through the city’s formal climate-adaptation and cloudburst planning documents, public case descriptions of the cloudburst program, and scholarship on financing urban adaptation (City of Copenhagen, 2011, 2012; INTERLACE Hub, 2023; Whittaker & Jespersen, 2022). Rotterdam is read through city strategy material, the Rotterdam Weatherwise framework, port-adaptation sources, C40 case evidence, and research on water squares and city-to-city learning (C40 Cities, 2023; European Environment Agency, 2024; Ilgen et al., 2019; Port of Rotterdam Authority, 2025; Resilient Rotterdam, 2022; Rotterdam Weatherwise, 2023). Broader interpretation draws on circular city and urban resilience evidence, including UN-Habitat’s global urban framing and Resilient Cities Network material on water-secure futures (Resilient Cities Network, 2020; UN-Habitat, 2022).

Those sources are treated as evidence of planning direction, not proof that every project has performed perfectly. Official strategies can overstate coherence. Case-study descriptions can emphasize success. Academic articles may focus on selected examples rather than the entire municipal system. A responsible master’s paper therefore reads across sources, separates observed project logic from official aspiration, and avoids turning public claims into unsupported measurement. This is why the figures are labeled as author-developed diagnostic tools rather than official city ratings.

3.3 Conceptual model and evidence limits

The quantitative element remains deliberately simple. The model is expressed as RCI_i = 25 + 50(CPM_i/10) + ε_i. RCI_i is a conceptual resilience capacity index for city i. CPM_i is the circular planning maturity score on a 0-10 scale, calculated from five dimensions: water-sensitive design, multifunctional public space, flood governance, circular resource use, and social resilience. Dividing CPM_i by 10 converts the score into a normalized 0-1 planning value. The error term, ε_i, represents the real conditions that documentary evidence cannot fully measure: event severity, funding gaps, political change, maintenance failure, inequality, construction quality, and unexpected infrastructure stress. The model does not forecast flood performance. It states the planning assumption that more durable circular maturity is expected to support more durable resilience, while still leaving room for uncertainty.

For applied interpretation, a city with a CPM score of 8.4 produces RCI_i = 25 + 50(8.4/10), or 67 before the uncertainty term is considered. Copenhagen and Rotterdam both receive high diagnostic scores because their adaptation work links water design, public space, governance, circular flows, and social resilience. The figure is not an official rating and is not to be used as a city ranking. It is an author-developed planning estimate derived from the evidence discussed in the case analysis.

The value of the model lies in its clarity. A claim that circular planning improves resilience has little meaning until the study states what maturity includes. Here it refers to five dimensions: water-sensitive design, multifunctional public space, flood governance, circular resource use, and social resilience. A city may perform well in one dimension and poorly in another. The model makes that unevenness visible.

The model also keeps a hard truth in view: adaptation has limits. Even a mature city can be damaged by an event beyond design assumptions. A city may have high projects but weak maintenance. Political leadership may change. Climate projections may shift. Neighborhood inequality may weaken trust. The error term is therefore not a mathematical decoration. It represents real uncertainty. Good planning reduces risk; it does not abolish it.

The scoring method is therefore treated with caution. It gives a planning language for comparison, not a certificate of performance. A mature city may still fail if maintenance collapses, if a severe event exceeds design assumptions, if poorer districts are left exposed, or if political attention moves elsewhere after the first round of investment. The model is useful because it keeps those uncertainties visible. It invites the reader to ask why a score is high, where the evidence is most useful, and which part of the system still needs professional scrutiny.

The mathematical expression also has a communication purpose. Planning audiences often need a plain way to discuss a complex relationship without pretending that the city is a laboratory. The model says that higher circular planning maturity is expected to raise adaptive capacity, while the final outcome remains affected by uncertainty. The expression RCIᵢ = 25 + 50(CPMᵢ/10) + εᵢ keeps the relationship readable and avoids false precision.

A further validity issue is scoring judgment. The five maturity dimensions used in the scorecard are drawn from the case logic: water-sensitive design, multifunctional public space, flood governance, circular flows, and social resilience. Each dimension is scored from zero to ten for comparative discussion. The scores are not city rankings. They are structured interpretations that help the reader see why both cases are considered mature, why Rotterdam scores slightly higher in flood governance, and why Copenhagen scores clearly in multifunctional public space.

Table 1. Comparative case logic for circular climate adaptation.

Dimension Copenhagen Rotterdam Planning meaning
Primary risk emphasis Cloudburst rainfall and surface-water management Delta exposure, flood protection, waterfront adaptation, and port continuity Climate adaptation fits local risk.
Spatial strategy Streets, parks, squares, and blue-green corridors Water plazas, adaptive waterfronts, tidal parks, and layered flood planning Public space becomes climate infrastructure.
Governance lesson Long-term citywide delivery program Water culture, port coordination, and multi-layered resilience planning Adaptation needs institutions as much as design.
Social concern Neighborhood benefit, public value, and maintenance equity Inclusion around improved waterfronts and adaptive districts Resilience avoids becoming a luxury benefit.


Chapter 4: Copenhagen Case Analysis

4.1 Cloudburst planning as spatial intelligence

Copenhagen’s adaptation story is shaped by the experience of intense rainfall and the limits of conventional drainage. The 2011 cloudburst created a practical and political moment in which the city faced the cost of severe urban flooding. The Climate Adaptation Plan and the Cloudburst Management Plan moved the city toward a combined approach in which underground systems, surface routing, parks, streets, and open spaces work together. Public descriptions identify about 300 projects over a 20-year horizon, showing that the program is not a single demonstration project but a long municipal delivery sequence.

The key planning insight is that heavy rainfall is spatial. Water follows slope, curb, surface, barrier, soil, and capacity. When rain falls faster than pipes can take it away, the city surface becomes part of the system whether planners acknowledge it or not. Copenhagen’s more intelligent response is to design that surface deliberately. Streets can guide water. Parks can hold it. Squares can store it temporarily. Corridors can move it away from places where it would do greater harm.

Copenhagen’s case reaches beyond a narrow engineering example. The city did not simply expand pipes and hide the problem underground. It used cloudburst planning to renew streets and public spaces while reducing flood risk. That approach creates political and social value because residents can see benefits between storms. A green corridor, safer street, improved square, or redesigned park earns daily support in a way that a buried pipe rarely can. The hidden system remains important; the visible system builds public understanding.

Copenhagen’s delivery horizon also teaches patience. Long programs require finance, sequencing, legal coordination, utility cooperation, construction management, and public communication. A project pipeline spread across two decades will face political turnover, cost pressures, neighborhood disruption, and changing technical knowledge. The planning achievement is therefore not only the design of individual projects. It is the ability to keep a long adaptation program coherent over time.

Financing is central to that patience. Copenhagen’s cloudburst response is often discussed as a design story, but the financial lesson is equally important. Whittaker and Jespersen (2022) show that adaptation finance in Copenhagen involves institutional negotiation, not simply technical agreement. A city may know what belongs and still struggle with who pays, when the work is sequenced, and how benefits are justified. For planners, that is a serious lesson. A project that cannot survive the budget process will remain a drawing.

The city’s reported ambition to deliver about 300 projects over a 20-year horizon also changes the meaning of leadership. A short pilot can depend on a small group of champions. A two-decade program requires durable standards, political continuity, staff memory, and public explanation. Residents will experience construction, disruption, and changing street functions long before every benefit becomes visible. Good planning leadership makes prevention understandable. It explains why a street is being rebuilt before the next flood proves the need.

Copenhagen also shows that surface solutions require careful technical humility. Sending water along streets and corridors can reduce damage only if flows are modeled, safe routes are identified, and vulnerable edges are protected. A cloudburst route that pushes water toward a basement, clinic, low-income housing block, or transit entrance has simply transferred risk. Spatial intelligence therefore requires engineering evidence, design care, and neighborhood knowledge at the same time.

4.2 Public-space co-benefits and implementation risks

The public-space value of Copenhagen’s adaptation work lies in co-benefits. A cloudburst street can manage water while improving walking comfort. A park can store stormwater while offering recreation, shade, habitat, and neighborhood identity. A green corridor can connect ecological and social functions. These co-benefits matter because climate adaptation requires public money and public patience. If residents experience only disruption, support weakens. If residents experience safer, greener, more useful places, adaptation becomes easier to defend.

Design quality is part of risk reduction. Poorly designed adaptation can look technical, alien, or unsafe. A basin that feels like leftover infrastructure may not be loved or cared for. A public space that works hydrologically but fails socially will still be incomplete. Copenhagen’s lesson is that climate infrastructure can be designed as civic space: legible enough for residents to understand, attractive enough for them to value, and practical enough to perform under stress.

The case also shows the importance of prioritization. The Cloudburst Management Plan ranks initiatives by risk, implementation ease, connection to urban development, and related policy opportunities. This is practical governance. A city cannot build everything at once. It decides where harm is likely, where intervention is possible, where other investments can be joined, and where public value can be highest. The quality of adaptation therefore depends not only on what is designed, but on where and when it is delivered.

Copenhagen’s limits need to remain visible. A celebrated adaptation program can still face questions of maintenance, affordability, neighborhood equity, and long-term performance. Projects have to be cleaned, planted, repaired, monitored, and explained. The social geography of benefit also requires review, so resilient public space does not concentrate only where political visibility or property value is highest. These cautions do not weaken the case. They make it more honest.

The transfer lesson from Copenhagen is not the physical form of any single project. It is the decision to treat streets and parks as part of a wider water system. Cities with fewer resources can still learn from that logic. They may begin with priority flood corridors, small public-space retrofits, schoolyard storage, open drains redesigned with safety and dignity, or maintenance rules that keep water paths clear. The principle can travel even when the budget cannot.

A further transfer lesson concerns sequencing. Cities often lose time by waiting for a perfect comprehensive program before acting. Copenhagen shows the opposite discipline: a long horizon can still be broken into legible projects, priority corridors, public-space renewals, and technical packages. The important point is that each smaller project belongs to a wider risk map. Without that link, scattered interventions may look progressive while leaving the city’s most serious exposure unchanged.

Copenhagen’s case also demonstrates why monitoring continues after construction. Public-space adaptation is tested during ordinary use and during severe rainfall. Does the space drain as expected? Are residents comfortable using it? Has vegetation survived? Are maintenance crews funded and trained? Has risk moved elsewhere? These questions decide whether the project remains infrastructure or becomes only a symbol.

Figure 1. Copenhagen cloudburst plan delivery horizon based on public planning descriptions. Copyright © June 2026 Michael C. Agbazuruwaka.

Chapter 5: Rotterdam Case Analysis

5.1 Living with water as planning culture

Rotterdam’s adaptation case begins from a different condition. The city sits in a delta environment where water is not an occasional inconvenience but a permanent planning fact. River, sea, rainfall, groundwater, port infrastructure, and low-lying urban land create a layered risk setting. Rotterdam’s planning culture has therefore been shaped by protection, accommodation, economic continuity, and civic identity. It does not treat water as a problem that can be expelled once and for all. It treats water as a condition for continuous negotiation.

The Rotterdam Climate Change Adaptation Strategy, the Resilient Rotterdam Strategy 2022-2027, the Rotterdam Weatherwise framework, and port adaptation material all show a city that links climate risk with governance and public life. The city’s resilience language is broad, connecting climate, health, inequality, biodiversity, natural resources, pollution, economy, and digital risk. That breadth is important because climate pressure rarely respects departmental boundaries. Flooding can affect mobility, housing, port activity, emergency services, and public confidence. Heat can affect health, productivity, and social inequality. Adaptation cannot be a single-office responsibility.

The port adds a distinctive dimension. Rotterdam is not only a residential and civic city; it is also a major economic gateway. Port adaptation protects business continuity, transport flows, workers, energy systems, and regional supply chains. European Environment Agency case material on the port emphasizes prevention, adaptation-driven spatial planning, and crisis-management approaches. This layered view is useful for cities with critical infrastructure. A waterfront city asks not only how to protect homes and public space, but how to keep essential systems functioning under stress.

Rotterdam’s most useful lesson is cultural as much as technical. The city has built a public language around water adaptation. Water plazas, roofs, waterfronts, tidal parks, and risk communication create visible symbols of the adaptation agenda. That visibility matters because residents need to understand why public space is being redesigned and why investment is needed before disaster arrives. A city that hides adaptation entirely inside technical departments may struggle to build public trust.

C40’s account of Rotterdam’s adaptation strategy describes a layered approach shaped by flood defense, sea-level exposure, inner-dyke and outer-dyke conditions, and tailored spatial responses (C40 Cities, 2023). That layered language is important because it avoids a false choice between hard protection and adaptive urbanism. Rotterdam still needs serious flood defense. At the same time, the city uses public space, building adaptation, waterfront planning, and civic communication to manage water within the urban fabric.

The Port of Rotterdam adds scale and economic consequence. Climate-ADAPT describes the port adaptation strategy as a menu of measures developed to limit flood-related economic damage in a complex port environment (European Environment Agency, 2024). The Port of Rotterdam Authority also notes that port areas lie largely outside the dykes and require strategies for higher water levels (Port of Rotterdam Authority, 2025). For a planning paper, this matters because port resilience is not only about protecting land. It is about business continuity, transport links, workers, supply chains, energy systems, and national economic exposure.

5.2 Water plazas, tidal parks, and adaptive waterfronts

Rotterdam’s water plazas are among the clearest examples of multifunctional adaptation. Benthemplein is widely discussed because it combines everyday public use with temporary stormwater storage. Under ordinary conditions, the space serves social and recreational functions. During heavy rainfall, it can hold water and reduce pressure on drainage systems. This is circular urban planning in a direct form: the same urban land serves different functions at different times.

The significance of the water plaza is not only its form. It changes public understanding. Water storage that is buried underground is technically useful, but residents may not see its value. A water plaza makes adaptation visible. It shows that public space can be part of the infrastructure system. It also brings funding logics together because water-management budgets can support the creation of better civic space. That combined value is essential for cities with limited land and competing public needs.

Rotterdam’s tidal parks and adaptive waterfronts add another layer. Projects such as the Keilehaven tidal park show how former industrial edges can become spaces for ecological function, public access, and climate awareness. They do not remove water from the city’s identity. They create a more intelligent relation between water movement and urban life. This is especially important for waterfront redevelopment, where resilience can easily become a premium amenity if inclusion is not protected.

Rotterdam also requires caution. Adaptive waterfronts may raise property values and attract investment. Those outcomes can help a city, but they can also create displacement pressure or unequal access. A water-sensitive district cannot be judged by design images or tourism appeal. It is judged by who receives protection, who gains access, who pays, who is pushed out, and whether care remains funded after the opening.

The Rotterdam case shows why adaptation language needs discipline around real-estate development. Water-sensitive design can improve safety and dignity; it can also become a branding device for expensive districts. A serious planning system holds both truths at once. It welcomes good waterfront design while asking whether public access is secure, whether existing communities remain in place, whether small businesses can stay, and whether climate performance is measured after completion rather than assumed from appearance.

Research on Rotterdam’s water squares gives the case a useful empirical texture. Ilgen, Sengers, and Wardekker (2019) examine water squares as part of urban resilience learning, showing that such projects can travel as ideas while still requiring local adaptation. The lesson is not that every city needs the same plaza. It is that visible storage can change professional and public imagination. Residents can see that a square may be dry and social most of the time, then become part of the drainage system during heavy rain.

Rotterdam Weatherwise extends that imagination into a broader program. Its 2030 framework emphasizes upscaling and broadening climate-adaptive action across the city (Rotterdam Weatherwise, 2023). The importance of such a framework lies in repetition. A city does not become resilient through one celebrated project. It becomes resilient when similar principles appear in redevelopment, street renewal, public space, housing, waterfronts, schools, and maintenance standards. Rotterdam is useful because it shows adaptation moving from isolated demonstration toward city practice.

Chapter 6: Comparative Findings

6.1 Shared principles and different emphases

Copenhagen and Rotterdam share one practical principle: water becomes a visible planning matter. Both cities use public space as part of climate infrastructure. Both accept that conventional drainage and flood defense remain important but insufficient on their own. Both connect adaptation to urban quality rather than treating it as emergency engineering only. Both depend on long-term governance because projects require finance, delivery, maintenance, and explanation across many years.

Their emphases differ because their risks differ. Copenhagen’s case is shaped by cloudburst rainfall and the problem of intense surface water arriving faster than conventional systems can manage. Its planning response concentrates on routes, retention, parks, streets, and surface infrastructure that reduce flood damage while improving the city. Rotterdam’s case is shaped by delta exposure, sea-level pressure, rainfall, port continuity, and a long institutional relationship with water. Its response includes water plazas, tidal parks, waterfront adaptation, port strategies, and broad resilience governance.

The comparison shows that adaptation fits local risk. A city cannot import Copenhagen’s cloudburst streets or Rotterdam’s water plazas as objects. It examines its own slopes, rainfall, housing, social vulnerability, maintenance capacity, land values, drainage records, and governance structure. The transferable lesson is behavior rather than form: read the risk, use public space intelligently, coordinate agencies, fund maintenance, protect exposed residents, and measure performance.

Both cases also demonstrate that adaptation becomes credible when it leaves the strategy document. Public plans are necessary, but they are not enough. The real test is whether streets, parks, waterfronts, capital budgets, procurement rules, and maintenance routines change. Copenhagen and Rotterdam matter because their adaptation work has become physical and visible. That visibility gives researchers material to assess and gives residents evidence that planning is not only language.

6.2 Circular maturity and resilience interpretation

The circular planning maturity profile used in this study scores the two cities across water-sensitive design, multifunctional public space, flood governance, circular flows, and social resilience. Copenhagen scores clearly in water design and public-space adaptation because the cloudburst program makes streets, parks, and squares part of stormwater management. Rotterdam scores clearly in flood governance because of its delta tradition, port adaptation, and wider resilience framework. Both cities are high in circular flows and social resilience, though both still need continued attention to equity, affordability, and long-term participation.

The conceptual model gives both cities a resilience-capacity estimate of 67 using RCI_i = 25 + 50(CPM_i/10) + ε_i, with circular planning maturity at 8.4. The equal result does not mean the cities are identical. It means the model reads both as mature cases, but for different reasons. Copenhagen’s maturity is clearly visible in cloudburst surface design. Rotterdam’s maturity is clearly visible in water culture and layered governance. This difference is more useful than a winner-and-loser comparison.

The score needs careful reading. It is not official. It does not measure actual flood depth reduction, avoided damages, heat mortality, biodiversity gain, or displacement risk. Those outcomes require city-specific data and long-term monitoring. The score is a teaching and planning device. It helps a reader see how circular planning maturity may influence resilience while still leaving room for uncertainty.

The comparative finding is simple but important: circular planning raises the quality of adaptation when it converts water, public space, materials, maintenance, and social equity into one planning conversation. Cities that keep these issues in separate boxes will miss co-benefits and may increase inequality. Cities that connect them can turn climate spending into public value.

The comparison also clarifies the difference between resilience as image and resilience as capacity. Image is easy to produce. A city can photograph a water plaza, a green corridor, or a waterfront park and present it as evidence of progress. Capacity is harder. It requires a line of responsibility from climate analysis to project selection, design, construction, public communication, use, maintenance, and learning. Copenhagen and Rotterdam are most useful where that line is visible. Their weaker points, like any city’s, appear where public-space improvement may outrun affordability, or where long delivery timelines test civic patience.

Another comparative lesson concerns scale. Copenhagen’s case is particularly persuasive at the scale of the street network and surface-water route. Rotterdam’s case is particularly persuasive at the scale of delta culture, waterfront adaptation, and port exposure. Together they show that adaptation works across nested scales. A city needs the curb and the catchment, the plaza and the port, the park and the policy, the neighborhood meeting and the capital budget. Circular urban planning becomes valuable because it helps these scales speak to one another.

Table 2. Circular planning maturity scoring logic.

Dimension Copenhagen score Rotterdam score Reasoning
Water-sensitive design 9 9 Both cities treat water as a spatial planning condition, not only a drainage issue.
Multifunctional public space 9 8 Copenhagen’s cloudburst spaces are highly visible; Rotterdam’s water plazas and parks also perform well.
Flood governance 8 9 Rotterdam has a deeply established delta and port-resilience tradition.
Circular flows 8 8 Both cases connect water, space, ecology, materials, and public value.
Social resilience 8 8 Both require continued attention to inclusion, affordability, and participation.


Figure 2. Circular planning maturity scorecard for Copenhagen and Rotterdam. Copyright © June 2026 Michael C. Agbazuruwaka.

Chapter 7: Climate Justice, Public Space, and Civic Value

7.1 Adaptation as a justice question

Climate adaptation is often introduced through physical exposure, but vulnerability is also social. A district may flood because of topography and drainage, yet the damage suffered by residents depends on housing quality, income, insurance, mobility, health, local services, and political voice. Heat risk follows the same pattern. Lack of tree cover, poor housing insulation, limited cooling spaces, and health vulnerability can make heat a serious public-health threat. A circular climate-adaptive city therefore treats equity as part of infrastructure performance.

Copenhagen and Rotterdam offer attractive public-space examples, but the justice test asks a harder question: who benefits? A park that stores water and cools the neighborhood can be a public good. It can also become part of a place-branding strategy that raises rents and displaces residents. A waterfront that protects against flooding can improve safety. It can also concentrate investment in already valuable districts. These tensions are not reasons to avoid adaptation. They are reasons to design anti-displacement safeguards, public access, community participation, and vulnerability-based investment from the beginning.

Public participation cannot be reduced to consultation after decisions have already been made. Residents know where water gathers, which routes fail, where heat is felt, which spaces are unsafe, and which projects might disrupt daily life. This knowledge is not a substitute for engineering, but it corrects technical blind spots. The best adaptation planning joins hydraulic modeling, climate data, maintenance knowledge, and local experience.

Climate justice also requires attention to maintenance. Wealthier districts may be better able to defend, report, and secure upkeep for improved public spaces. Vulnerable districts may receive projects that later deteriorate because maintenance budgets are weak. Equity therefore cannot end at project selection. It continues through funding, cleaning, planting, repair, monitoring, and public accountability.

7.2 Public-space value as resilience

Public space is one of the most powerful adaptation assets because it is shared. Streets, parks, squares, schoolyards, waterfronts, and green corridors shape how residents experience climate risk. They also shape whether residents see adaptation as a public benefit or a technical burden. A well-designed adaptation project can reduce flood risk, provide shade, support biodiversity, improve walking comfort, and create a place people value. That combination makes the city safer and more livable.

Copenhagen’s cloudburst spaces and Rotterdam’s water plazas show that the public field can be engineered without becoming hostile. The point matters because climate infrastructure that feels alien may meet resistance or neglect. Residents are more likely to defend places they use and understand. Civic attachment is not decorative. It can protect long-term performance by creating pressure for maintenance and care.

Schools, clinics, bus stops, markets, and public housing areas deserve particular attention. Climate risk affects the daily systems that people depend on. A flooded route to a clinic, an overheated schoolyard, or an inaccessible bus stop can turn a weather event into a social crisis. Adaptation planning therefore maps not only assets and hazards, but daily dependency. Which places continue functioning during stress? Which groups are most exposed if they fail? Which routes need protection first?

Schoolyards are especially important because they concentrate daily use, vulnerable users, and public land. A schoolyard that is redesigned for shade, safe drainage, play, and temporary storage can serve children during normal days and protect the surrounding area during heavy rainfall. The same logic applies to clinics and health centers. Heat, flooding, and access interruption can turn a facility into a weak point during climate stress. Planning for resilience therefore includes the small civic spaces that determine whether daily life can continue.

Climate justice also requires attention to time. Some benefits arrive immediately: shade, walking comfort, play space, cleaner public areas. Other benefits appear only during a severe event, when the drainage route, storage basin, or floodable plaza is tested. Communities asked to tolerate disruption need to understand both timeframes. Without clear communication, adaptation may look like construction inconvenience for benefits that are hard to see. Trust grows when residents can see how a project serves them before and during climate stress.

Affordability remains a serious concern around attractive adaptation projects. Waterfront upgrades, green corridors, and climate parks can raise land values. That may expand municipal revenue and attract investment, but it may also displace renters, small businesses, and lower-income households. A just adaptation strategy therefore requires coordination with housing policy, tenancy protection, public land rules, and anti-displacement measures. Resilience cannot become a premium product available only to those who can afford the improved district.

Public-space value also includes dignity. A climate park cannot look like a leftover basin. A floodable square cannot signal neglect. Residents cannot feel that their neighborhood received a cheaper or uglier version of adaptation. Beauty, usability, and care are part of justice because public infrastructure tells residents how the city values them.

Figure 3. Blue-green infrastructure benefit mix. Copyright © June 2026 Michael C. Agbazuruwaka.

Figure 6. Multifunctional public-space performance scorecard. Copyright © June 2026 Michael C. Agbazuruwaka.

Chapter 8: Governance, Finance, and Maintenance

8.1 From policy language to delivery discipline

Many cities have climate plans. Fewer have delivery discipline. The difference lies in governance. An adaptation program requires clear ownership, risk maps, design standards, procurement rules, funding streams, maintenance budgets, monitoring indicators, and communication routines. It also requires coordination across departments that often work separately: water, roads, parks, housing, health, finance, emergency management, environment, and planning. Where these systems remain fragmented, adaptation becomes a collection of isolated projects.

Copenhagen’s cloudburst delivery horizon shows the importance of sequencing. A twenty-year program cannot depend on enthusiasm alone. It needs annual prioritization, capital planning, utility coordination, public explanation, and technical review. Rotterdam’s resilience and Weatherwise frameworks show a similar need for cross-sector governance. In both cities, adaptation is not simply designed; it is administered. That administrative capacity is less visible than the projects, but it is what allows the projects to continue.

Finance is the hard test of adaptation seriousness. Cities often support resilience in principle but hesitate when projects compete with immediate political demands. Circular planning helps by making co-benefits visible. A drainage upgrade may be expensive if counted only as flood protection. The same investment may appear more justified when it also improves public space, reduces heat, supports biodiversity, protects mobility, and avoids future damage. The broader the value account, the more durable the case for investment.

Procurement also matters. A city that wants multifunctional adaptation cannot procure every project through narrow technical specifications. Tender documents, design briefs, contractor requirements, material standards, and evaluation criteria have to reward water-sensitive design, durability, circular materials, maintenance feasibility, and social benefit. Otherwise, the ambition of the policy will be lost in the mechanics of delivery.

8.2 Maintenance as climate governance

Maintenance is one of the most underestimated parts of adaptation. It rarely attracts the same attention as design competitions or project launches, yet it determines whether the project continues to work. A clogged drain, compacted soil, dead tree, broken surface, unsafe plaza, or poorly cleaned basin can turn climate infrastructure into an embarrassment. Maintenance is not a secondary operational detail. It is part of the design’s truth.

Blue-green infrastructure is especially dependent on care. Vegetation needs soil volume, water, pruning, replacement, and protection from damage. Permeable surfaces need cleaning. Retention spaces need inspection. Water plazas need safety management and public trust. If maintenance budgets are not secured at the beginning, the project may perform well in photographs and poorly during storms. The city therefore treats life-cycle cost as part of approval, not an afterthought.

Data can improve maintenance, but data belongs with local observation. Sensors, flood maps, heat maps, asset registers, and dashboards can help cities decide where to invest and when to intervene. Yet residents, maintenance crews, school staff, health workers, and local businesses often notice problems before they become data points. A mature adaptation system listens to both. It does not mistake a digital map for the whole city.

The governance lesson from both cases is that adaptation becomes ordinary when it shapes street standards, park renewals, waterfront approvals, housing policy, schoolyard design, drainage maintenance, public-health planning, and emergency routes. When adaptation remains a special project, it misses too many chances to reduce risk. When it becomes a normal rule of planning, the city gradually changes its risk profile.

Ordinary does not mean weak. It means that adaptation is present in the decisions that normally shape a city: road resurfacing, park renewal, housing permits, utility replacement, schoolyard upgrades, public-health planning, and capital budgeting. When those routine decisions ignore climate risk, even a sophisticated resilience strategy remains fragile. When they absorb climate risk, the city changes gradually but seriously. That is the administrative meaning of circular urban planning: public money, land, materials, water, and civic benefit are managed as connected responsibilities.

Finance is best understood as governance, not only accounting. A budget reveals whether the city treats adaptation as a permanent duty or a temporary campaign. Capital funding without maintenance funding creates future failure. Grant-funded pilots without a route to ordinary budgets create isolated examples. Emergency spending after a flood may be unavoidable, but it is usually more expensive and less equitable than prevention. Sound adaptation finance therefore combines risk-based investment, co-benefit justification, asset management, and long-term maintenance responsibility.

Procurement can either support or weaken circular planning. Standard procurement may reward the lowest immediate cost and the narrowest technical specification. Climate-adaptive procurement asks for life-cycle performance, material reuse, low-carbon delivery, biodiversity value, maintainability, public-space quality, and social safeguards. A contractor asked only to build a drainage object may not deliver a civic place. A design team asked to produce only visual appeal may not deliver hydraulic performance. The procurement document is where the city’s values become enforceable instructions.

Maintenance data belongs with public reporting. Residents are more likely to protect and trust blue-green infrastructure when the city explains how it is performing. A short public report can state which projects were completed, which drains were cleared, where tree survival is weak, which districts remain exposed, and what will be repaired next. Such reporting is not only administrative. It is civic education. It shows that adaptation is a living system rather than a one-time announcement.

Table 3. Recommendations for climate-adaptive cities.

Priority Action Expected value
Water-sensitive planning Require stormwater and heat adaptation in streets, parks, waterfronts, and development approvals. Normalizes adaptation across the city.
Maintenance finance Fund vegetation care, drainage cleaning, safety checks, and performance monitoring from the start. Protects long-term function.
Social inclusion Use vulnerability data and community participation in project selection. Reduces unequal protection.
Public-space value Design projects that improve daily life while reducing climate risk. Builds trust and political support.
Circular procurement Use durable, reusable, low-carbon materials and life-cycle cost rules. Links adaptation with circular economy practice.


Chapter 9: Diagnostic Model and Applied Evidence

9.1 Applied evidence from the cases

The tables and figures in this publication are designed as planning tools. They do not replace the case analysis. They summarize it. Table 1 compares Copenhagen and Rotterdam across risk emphasis, spatial strategy, governance lesson, and social concern. The purpose is to show that the two cities share a climate-adaptive logic while operating from different risk conditions. Copenhagen’s primary emphasis is cloudburst rainfall and surface-water management. Rotterdam’s emphasis is delta exposure, flood protection, port resilience, and adaptive waterfronts. Both use public space as climate infrastructure.

Table 2 presents the circular planning maturity scoring logic. The scores are author-developed and need to be read as diagnostic values, not official measurements. They help translate qualitative judgment into a profile. Copenhagen receives high marks for water-sensitive design and multifunctional public space. Rotterdam receives high marks for flood governance. Both cities perform well, but neither is treated as complete. The useful insight is unevenness: a city can be advanced in design and still need deeper social safeguards, or advanced in governance and still need better neighborhood-level evaluation.

The figures work in the same way. Figure 1 uses the public planning description of Copenhagen’s cloudburst delivery horizon to show scale and time. Figure 2 compares circular maturity dimensions. Figure 3 summarizes the benefit mix of blue-green infrastructure. Figure 4 shows the conceptual resilience estimate. Figure 5 presents an adaptation intervention portfolio. Figure 6 scores multifunctional public-space performance. Figure 7 turns the argument into an adaptation cycle: read risk, slow water, share space, reduce heat, protect people, and maintain and learn.

These visual tools are important because planners work with both narrative and evidence. A good planning paper cannot only describe. It gives decision-makers a way to organize choices. The model, tables, and figures are therefore best understood as applied evidence aids. They are transparent enough to be challenged and simple enough to be used in teaching, policy discussion, or project review.

9.2 Using the model responsibly

The model’s greatest risk is misuse. A city could treat the conceptual resilience score as a ranking device, or a consultant could present it as proof of performance. That would be wrong. Resilience is tested with hydrological data, heat data, maintenance records, social vulnerability indicators, avoided-damage analysis, resident feedback, and post-event evaluation. The model in this study is a framing device, not a substitute for empirical evaluation.

Used responsibly, the model supports better questions. If a city claims high circular maturity, what evidence supports that claim? Are water-sensitive design requirements embedded in street standards? Are parks designed for stormwater and heat? Are vulnerable districts prioritized? Are maintenance budgets protected? Are materials reused? Are residents involved early enough to influence project design? Are project benefits monitored after completion? The model turns resilience language into a checklist of responsibilities.

The same approach can be used outside Europe. A city in Africa, Asia, Latin America, or North America may not have the same budget as Copenhagen or Rotterdam, but it can still ask whether streets can safely route water, whether schoolyards can store runoff, whether tree planting is linked to heat risk, whether drainage investments protect vulnerable districts, and whether maintenance is funded. Circular planning is not a luxury concept. At its best, it is a way to make limited resources perform more than one public function.

The applied evidence therefore points toward a professional planning ethic. Make assumptions visible. Separate official data from author-developed scoring. Connect physical protection with social value. Plan for maintenance before construction. Do not call a project resilient because it looks green. Judge it by how it performs, who it protects, how it is cared for, and whether the city learns from it.

That ethic matters in cities under fiscal pressure. Limited resources make multifunctional planning more necessary, not less. A drainage project that also improves shade, walking comfort, public safety, biodiversity, and neighborhood dignity has a more convincing public case than a narrow technical repair. The same principle applies to data. A risk map becomes more valuable when it is read beside resident testimony, maintenance records, insurance exposure, land values, and health vulnerability. Circular planning does its best work when it refuses to separate the technical city from the lived city.

The figures are therefore best read as planning communication tools. Figure 1 communicates the scale and time horizon of Copenhagen’s cloudburst work. Figure 2 summarizes the comparative maturity judgement. Figures 3 and 5 translate broad co-benefits and intervention portfolios into visible proportions. Figure 4 makes the conceptual model transparent by showing the equal resilience estimate produced by the selected maturity scores. Figure 6 focuses attention on public-space performance, while Figure 7 reduces the circular adaptation cycle to six professional moves: read risk, slow water, share space, reduce heat, protect people, and maintain and learn.

The charts are not presented as statistical outputs from a survey or official municipal dataset. That distinction is essential for research honesty. Their values come from the documentary review and author-developed diagnostic scoring. The notes below the figures state this clearly, and the text repeats the limitation so that the visual material cannot be misread as official measurement. In NYCAR publication terms, this is a strength. A figure clarifies evidence; it does not exaggerate it.

Figure 4. Estimated urban resilience capacity score derived from the conceptual model. Copyright © June 2026 Michael C. Agbazuruwaka.

Figure 5. Adaptation intervention portfolio for circular urban planning. Copyright © June 2026 Michael C. Agbazuruwaka.

Figure 7. Circular urban adaptation cycle. Copyright © June 2026 Michael C. Agbazuruwaka.

Table 4. Implementation risks and professional safeguards.

Risk Planning consequence Safeguard
Weak maintenance Blue-green systems lose technical and social value. Approve life-cycle budgets before construction.
Climate gentrification Adaptive districts become exclusive amenities. Pair public-space upgrades with affordability safeguards.
Fragmented governance Projects remain isolated and inconsistent. Create shared standards across water, roads, parks, health, and housing.
Overreliance on pilot projects Innovation does not change the wider system. Build project pipelines, design standards, and routine approvals.
Poor public communication Residents see disruption without understanding benefit. Use clear risk maps, neighborhood meetings, and post-project reporting.


Chapter 10: Planning Recommendations and Final Position

10.1 Recommendations for climate-adaptive cities

Cities place water-sensitive design inside ordinary planning approvals when they treat every redevelopment as either a risk increase or a risk reduction. Streets, parks, waterfronts, public buildings, schoolyards, housing estates, and large developments then address stormwater, heat, vegetation, mobility, materials, and public-space value as part of routine approval rather than as an optional climate add-on.

Investment plans need to rank projects by risk reduction, social need, co-benefits, deliverability, and maintenance feasibility. The best project is not always the most dramatic. It may be a drainage corridor protecting a vulnerable district, a shaded route to a clinic, a schoolyard that stores water safely, or a green street that reduces repeated flooding. Cities need to use vulnerability data and local knowledge to decide where adaptation arrives first.

Maintenance finance belongs beside capital finance. A city cannot fund blue-green infrastructure responsibly unless it also funds vegetation care, cleaning, inspection, replacement, safety, and monitoring. The cost may appear higher at the beginning, but the alternative is false economy. Climate infrastructure that fails through neglect wastes public money and weakens trust.

Cities connect adaptation with circular procurement when materials are selected for durability, repairability, reuse, low carbon impact, and long service life. Construction waste is minimized. Project briefs require contractors and designers to show how water, heat, biodiversity, material use, and maintenance have been considered. Circularity belongs in tender documents, not only in policy statements.

Public participation begins before design decisions are fixed. Residents can help identify flood paths, heat-stress locations, unsafe spaces, daily routes, and local priorities. Participation functions as evidence, not ceremony. Technical knowledge and resident knowledge inform each other. The result is usually a better project and a more legitimate one.

Copenhagen keeps protecting the integrity of its cloudburst program by keeping long delivery timelines connected to neighborhood benefit, transparent prioritization, and maintenance evidence. The program’s strength lies in linking risk reduction with public-space improvement. That strength will weaken if delivery becomes uneven, if public understanding fades, or if maintenance does not keep pace with construction.

Rotterdam continues developing water-sensitive public spaces and adaptive waterfronts while guarding against climate gentrification. Its resilience tradition is high, but improved waterfronts and attractive adaptive districts can create affordability pressure. The city treats inclusion as part of resilience performance, not as a separate social policy applied later.

Cities with fewer resources can still act if they treat adaptation as a sequence rather than a single grand project. The first step is to identify repeated flood and heat stress points through local observation, complaints, maintenance records, and community reporting. The second step is to select practical interventions that serve more than one purpose: shade and drainage, storage and recreation, waterfront access and protection, schoolyard safety and public cooling. The third step is to protect maintenance funding before the project is announced. Without that discipline, modest projects can fail as quickly as expensive ones.

Professional education also has a role. Urban planners, architects, engineers, public-space designers, public-health officers, and municipal managers require training that teaches them to read climate risk together. Too much adaptation fails because each profession sees only its own part of the problem. The planner sees land use, the engineer sees drainage, the designer sees vegetation, the health officer sees heat exposure, and the finance officer sees cost.

Evaluation belongs inside every adaptation program. Cities track not only whether a project was completed, but whether it reduced flood exposure, improved shade, increased public use, protected vulnerable residents, and remained maintainable. Evaluation also records failure. If a permeable surface clogged, if a tree canopy failed, if a water plaza was avoided at night, or if a waterfront project increased displacement pressure, the lesson enters the next design cycle.

10.2 Final position

Copenhagen and Rotterdam show that climate adaptation can be a form of urban intelligence. They do not treat water only as a problem to be expelled. They treat it as a planning condition that shapes public space, ecological function, mobility, housing, economic continuity, and civic life. That is the deeper meaning of circular urban planning.

The climate-adaptive city will not be defined only by higher barriers, larger pipes, or more sophisticated emergency response, though all may remain necessary. It will be defined by streets that carry water safely, parks that cool and store, waterfronts that protect and welcome, schools and clinics that remain reachable, communities that participate, and planning systems that learn from evidence. Resilience is not only survival after an event. It is the redesign of ordinary life so that future events cause less harm.

The hardest lesson from the two cases is the discipline of connection. Water belongs with to public space. Design belongs with to maintenance. Climate investment belongs with to social equity. Circularity belongs with to procurement and material choices. Modeling belongs with to local observation. Policy belongs with to the street, the park, the waterfront, and the budget line. Without these links, adaptation remains fragmented.

Future research can follow projects over time. It can ask whether flood depth declined, whether heat exposure fell, whether maintenance remained funded, whether public spaces were used, whether vulnerable neighborhoods benefited, and whether property improvements produced displacement pressure. Admiration is not enough. Climate adaptation needs accountability.

The final position of this study is clear. Cities cannot wait for disaster before redesigning the public field. Every street renewal, park investment, waterfront plan, drainage upgrade, housing approval, and public-space project can become a chance to reduce climate risk. Copenhagen and Rotterdam are useful because they show how this work can be technical, civic, ecological, and practical at once. The city itself becomes the adaptation system when planning learns how to make ordinary space perform extraordinary work.

In professional terms, the study’s closing claim is that circular urban planning gives climate adaptation an operating grammar. It teaches cities to read risk before design, slow water before it becomes disaster, share scarce urban space across functions, reduce heat through land and vegetation, protect people rather than assets alone, and maintain what has been built. That grammar is simple enough for practice and demanding enough for serious planning education.

Copenhagen and Rotterdam do not provide perfect models, and they cannot be treated as finished cities. Their importance lies in the way each makes climate risk spatial, civic, and governable. They show that adaptation is not a separate future waiting outside the city. It is already present in the street section, the park design, the water edge, the maintenance budget, the procurement rule, and the public meeting. The cities that understand this will adapt earlier, fairer, and with greater public confidence.

10.3 Professional planning checklist

A practical checklist follows from the study. Before approving a climate-adaptation project, a city asks six questions. What exact risk is being reduced? Which residents are most exposed? Which public-space benefit will remain on ordinary days? What maintenance obligation is being created? Which circular procurement rule will reduce waste and emissions? What evidence will be collected after delivery? These questions are simple, but they prevent vague resilience language from replacing professional judgment.

The first question protects technical seriousness. A project cannot be called adaptive only because it includes trees, water, paving, or attractive public-space treatment. The project names the risk: cloudburst flow, surface flooding, heat stress, sea-level exposure, drainage overload, port disruption, or public-health vulnerability. Naming the risk allows the city to test whether the intervention is proportionate. It also helps residents understand why a familiar street, plaza, waterfront, or schoolyard is being changed.

The second question protects equity. Vulnerability data is combined with local knowledge because maps do not always capture how people experience risk. A district may look less exposed in a technical model but still contain older residents, basement housing, informal workspaces, weak transit access, or limited cooling options. Community reporting therefore sits beside engineering data. Each corrects the other.

The third and fourth questions protect public value over time. A floodable square that residents avoid is a weak civic investment. A rain garden that fails after two seasons because no one funded maintenance is not resilience. The project improves daily life through shade, safety, recreation, walking comfort, biodiversity, or public identity, and the city names who will care for it after construction. Maintenance is not a secondary issue. It is the point where climate ambition becomes durable public service.

The fifth question brings circularity into the construction process. Climate adaptation often requires materials, equipment, excavation, and new infrastructure. Those actions can either deepen linear consumption or support reuse, repairability, durability, and lower-carbon delivery. Circular urban planning therefore influences procurement, not only concept drawings. The city asks how materials will be sourced, whether components can be reused, how long the design is expected to last, and what happens at the end of the asset’s life.

The final question turns adaptation into learning. Every project produces evidence after delivery. Did water move as predicted? Did shade increase? Did residents use the space? Did maintenance costs match expectations? Did vulnerable households benefit? Did land values create exclusion pressure? The answers belong in the next project. Copenhagen and Rotterdam are valuable because they show direction, but the future of climate-adaptive planning depends on cities that can learn from their own streets with the same seriousness they bring to international examples.

A final professional test concerns institutional memory. Many cities lose adaptation knowledge when administrations change, consultants leave, or project teams dissolve. A climate-adaptive planning system preserves drawings, maintenance records, community feedback, cost data, risk assumptions, and performance reviews in a form future officials can use. Institutional memory is not paperwork for its own sake. It prevents the city from repeating mistakes, protects continuity across electoral cycles, and helps new projects build on tested practice rather than begin again with slogans.

This is why the study remains deliberately practical. It does not ask cities to admire Copenhagen or Rotterdam from a distance. It asks them to examine how those cities turn risk into design standards, budgets, and public-space decisions. The proper measure of the study is therefore not novelty alone, but usefulness: whether a planner, council member, infrastructure manager, or graduate researcher can use its framework to ask better questions before the next climate event exposes yesterday’s weak decisions.

References

C40 Cities. (2023). Rotterdam: Climate change adaptation strategy. C40 Good Practice Guides. https://www.c40.org/case-studies/c40-good-practice-guides-rotterdam-climate-change-adaptation-strategy/

City of Copenhagen. (2011). Copenhagen climate adaptation plan. City of Copenhagen. https://international.kk.dk/sites/default/files/2021-09/Copenhagen%20Climate%20Adaptation%20Plan%20-%202011.pdf

City of Copenhagen. (2012). The City of Copenhagen cloudburst management plan 2012. City of Copenhagen. https://international.kk.dk/sites/default/files/2021-09/Cloudburst%20Management%20plan%202010.pdf

Circular Cities Declaration. (2024). CCD report 2024. ICLEI Europe. https://circularcitiesdeclaration.eu/about/ccd-report

Ellen MacArthur Foundation. (2024). The circular economy in cities and regions: Planning for a regenerative urban future. https://www.ellenmacarthurfoundation.org/topics/cities/overview

European Environment Agency. (2024). Rotterdam port adaptation strategy for climate-resilient transport and business activities. Climate-ADAPT. https://climate-adapt.eea.europa.eu/en/metadata/case-studies/rotterdam-port-adaptation-strategy-for-climate-resilient-transport-and-business-activities

Ilgen, S., Sengers, F., & Wardekker, A. (2019). City-to-city learning for urban resilience: The case of water squares in Rotterdam and Mexico City. Water, 11(5), 983. https://doi.org/10.3390/w11050983

Intergovernmental Panel on Climate Change. (2022). Climate change 2022: Impacts, adaptation and vulnerability. Cambridge University Press. https://www.ipcc.ch/report/ar6/wg2/

INTERLACE Hub. (2023). Cloudburst management plan – Copenhagen. https://interlace-hub.com/cloudburst-management-plan-copenhagen

Pochodyła, E., Glińska-Lewczuk, K., & Jaszczak, A. (2021). Blue-green infrastructure as a new trend and an effective tool for water management in urban areas. Landscape Online, 92, 1–20. https://doi.org/10.3097/LO.202192

Port of Rotterdam Authority. (2025). Climate change adaptation. https://www.portofrotterdam.com/en/building-port/sustainable-port/climate-adaptation

Przestrzelska, K., Wartalska, K., Rosińska, W., Jurasz, J., & Kaźmierczak, B. (2024). Climate resilient cities: A review of blue-green solutions worldwide. Water Resources Management, 38(15), 5885–5910. https://doi.org/10.1007/s11269-024-03950-5

Resilient Cities Network. (2020). How resilient cities share strategies for adapting to a water-secure future. https://resilientcitiesnetwork.org/resilient-water-management/

Resilient Rotterdam. (2022). Resilient Rotterdam strategy 2022-2027. City of Rotterdam. https://s3.eu-central-1.amazonaws.com/storage.resilientrotterdam.nl/storage/2022/09/09093215/Resilient-Rotterdam-Strategy-2022-2027.pdf

Rotterdam Weatherwise. (2023). Weatherwise 2030 programme framework. City of Rotterdam. https://rotterdamsweerwoord.nl/content/uploads/2023/03/Programmakader-Rotterdams-Weerwoord-2030-EN.pdf

UN-Habitat. (2022). World cities report 2022: Envisaging the future of cities. United Nations Human Settlements Programme. https://unhabitat.org/world-cities-report-2022-envisaging-the-future-of-cities

Whittaker, S., & Jespersen, K. (2022). Stretching or conforming? Financing urban climate change adaptation in Copenhagen. Buildings and Cities, 3(1), 974-999. https://doi.org/10.5334/bc.238

The Thinkers’ Review