

Postgraduate Diploma Research Paper
Prepared for: Dominic Okoro
Discipline: Accounting and Strategic Human Resource Management
Case Study: MTN Nigeria Communications Plc
Peer Review: Internal and External (Independent) Review
NYCAR Research Edition
| Publication No. | NYCAR-TTR-2026-RP069 |
| DOI | https://doi.org/10.5281/zenodo.20794541 |
Abstract
Accounting and strategic human resource management cannot be reduced to generic policy language when the case organization operates inside measurable financial pressure. In MTN Nigeria Communications Plc, accounting evidence functions as a control instrument: it makes growth, margin, profit movement, capability spend, and workforce discipline visible enough for management to act. The research argues that people policy and strategy must be read through numbers, because unmanaged talent assumptions become cost leakage, execution failure, audit exposure, or reputational damage.
The case is suitable because it offers a public record of scale and reversal. Revenue rose from roughly ₦3.36 trillion in 2024 to ₦5.20 trillion in 2025, a computed increase of 54.76 percent. Profit after tax moved from a 2024 loss near ₦0.40 trillion to a 2025 profit near ₦1.11 trillion, a swing of about ₦1.51 trillion. Service revenue growth was reported above 55 percent and EBITDA recovery above 100 percent. These indicators do not prove every internal policy choice, but they give a defensible public basis for testing how accounting evidence can support strategic decision-making.
The method is documentary case analysis built on public financial data, management-control theory, and accounting interpretation. The analytical design links financial indicators to workforce and strategic levers through ratio checks, a risk-and-control matrix, and a single control model. It rejects the habit of treating accounting as backward-looking reporting and uses it instead as a forward-control language that tests whether leadership choices are economically coherent.
The core finding is that human capital accounting should not be treated as a decorative social-reporting note. In a telecom business exposed to currency volatility, tariff pressure, digital growth, and service-quality expectations, workforce capability becomes a measurable operating asset. The accounting lens must translate talent spending, training, retention, and productivity into figures that sit beside revenue, EBITDA, and risk exposure; the workforce lens must read HR policy as operating control rather than staff-relations prose. The recommendations call for sharper ratio discipline, stronger board reporting, named policy ownership, and disclosure that treats workforce and strategy as accountable performance variables.
Keywords: accounting control; strategic human resource management; workforce policy; management control; human capital accounting; case analysis; public financial data; MTN Nigeria Communications Plc; Postgraduate Diploma research.
Table of Contents
List of Tables
Table 1. Public source and evidence register
Table 2. Case financial and operating indicators
Table 3. Calculation audit
Table 4. Accounting-to-workforce variable map
Table 5. Risk and control matrix
Table 6. Research questions and evidence tests
Table 7. Recommendations and implementation owners
Table 8. NYCAR quality-control ledger
List of Figures
Figure 1. MTN Nigeria revenue movement
Figure 2. MTN Nigeria profit after tax movement
Figure 3. Human capital accounting and strategic workforce control model
Chapter 1: Introduction
This chapter sets the case in its financial and sectoral context and states what the research will and will not attempt. It treats MTN Nigeria not as a story of corporate success but as a test bench on which the relationship between accounting evidence and workforce strategy can be examined under genuine pressure. The argument begins from a single premise: in a firm this exposed, public numbers are evidence, and any claim about people or strategy must answer to them.
1.1 Context and rationale
MTN Nigeria Communications Plc earns its place in this research because its public numbers move far enough, fast enough, to expose the link between money and people. A firm whose revenue climbs by more than half in a single year, and whose bottom line flips from a heavy loss to a trillion-naira profit, is not a quiet object of study. It is a stress test of whether management could fund, staff, and control a recovery while the currency moved against it.
The sector matters as much as the firm. Mobile telecommunications in Nigeria is capital-intensive and skill-dependent at the same time: towers, spectrum, and fibre demand financing, while network quality, fraud control, and digital-product delivery demand engineers, analysts, and disciplined operators. Accounting sits at the junction of those two demands, and that is the rationale for reading the case through an accounting lens rather than a human-interest one.
Public data here are not decorative. They are evidence.
Two features of the firm make it analytically valuable. The cost base is partly dollar-denominated, through tower leases and imported equipment, while the revenue base is naira; and the workforce splits sharply between scarce, firm-specific capability and more substitutable roles. When the naira fell, those two features collided, and the accounts recorded the collision. Reading the case is therefore not an exercise in admiring a recovery but in tracing how a financing structure and a capability structure interact under stress.
The research takes the audited figures as its anchor and refuses to drift from them. Where a claim cannot be tied back to a published number or to recognized theory, it is not made.
1.2 Problem statement
The problem is a habit of language. Strategy documents and HR policies often speak of talent, culture, and alignment without ever stating which number would prove the claim true or false. When the words cannot be tested against cost, margin, retention, or delivery quality, they describe an intention rather than a control.
MTN Nigeria sharpens the problem because the temptation to narrate success is strongest exactly when the headline numbers are good. A 54.76 percent revenue rise can flatter a workforce policy that contributed little, or mask a capability gap that the next tariff cycle will expose. The research therefore frames the problem as one of attribution: separating what the public accounts can support from what management would like them to imply.
There is a quieter problem too, namely aggregation. Public accounts compress a complex workforce into a handful of cost lines, so the very structure that matters most — which capability is scarce, which is substitutable — disappears into a total. An analysis that stops at the total will therefore misread the firm’s real exposure, mistaking a manageable cost for a strategic risk or, worse, the reverse.
1.3 Aim and objectives
The aim is to show how accounting information can convert workforce investment, remuneration discipline, talent retention, and operating productivity into strategic HRM decisions inside a capital-intensive telecom operator.
Four objectives follow. The work sets out to recalculate the headline financial movements from public figures rather than accept reported percentages on trust; to map each accounting variable onto a workforce or strategy lever it can plausibly test; to build a control model that treats accounting as a forward signal; and to translate the analysis into recommendations with named owners and audit evidence. Each objective is designed to survive a reader who asks for the arithmetic.
The objectives are sequenced so that judgment always trails evidence. Recalculation comes before mapping, mapping before interpretation, and interpretation before recommendation. The order is a safeguard against the most common failure in applied case work, which is to choose a conclusion and then assemble the figures that flatter it.
1.4 Research questions
The research is organized around four questions. How does accounting evidence discipline workforce and strategy decisions in this case? Where do the public numbers show management pressure rather than comfort? Which ratios expose whether a stated policy is adequately funded? And what does the case teach beyond its own descriptive data?
Each question is tied to an explicit evidence test, summarized later in Table 6, so that the answers can be checked rather than asserted. The questions are deliberately modest about what a documentary case can prove, and deliberately strict about what it must show before any claim is allowed to stand.
The questions also fix the burden of proof. A documentary case is allowed to demonstrate that a method works on real evidence; it is not allowed to claim a general law from a single firm. Keeping that distinction visible in the questions keeps it visible in the answers, and prevents the analysis from quietly inflating what one case can establish.
| Research question | Evidence test | Expected output |
| How does accounting evidence discipline workforce and strategy decisions? | Link public financial data to policy levers | Traceable control model |
| Where does the case show management pressure? | Read growth, profit, assets, and risk signals | Pressure map |
| Which ratios expose policy adequacy? | Recalculate growth and margin indicators | Math audit |
| What does the case teach beyond descriptive data? | Connect case evidence to theory | Defensible findings |
Table 6. Research questions and evidence tests
1.5 Scope and boundaries
The scope is the public financial and operating record of MTN Nigeria across the 2024 and 2025 reporting cycle, read alongside recognized accounting and management-control literature. It does not extend to confidential payroll files, internal headcount tables, or proprietary remuneration data, none of which are publicly available.
That boundary is a strength rather than an apology. A postgraduate analysis that confines itself to verifiable public evidence is harder to dispute than one that leans on figures no reader can see. Where the public record runs out, the research says so and labels the remainder as interpretation.
The temporal boundary is equally deliberate. The study reads the 2024 loss and the 2025 recovery as a paired event, because a single year in isolation would teach little. A loss followed by a sharp rebound is a natural experiment in capability under pressure, and the boundary is drawn to capture exactly that movement and no more.
1.6 Significance
The significance is practical. If accounting evidence can be shown to discipline workforce and strategy choices in a firm as visible as MTN Nigeria, the same discipline transfers to smaller organizations that lack the same public scrutiny.
For the postgraduate reader, the contribution is a worked demonstration that human capital accounting is not a reporting ornament but a governance tool. The analysis gives finance directors, HR leads, and audit committees a defensible way to ask whether a people policy is funded, owned, and measured, and to notice early when a declared strategy is drifting away from the numbers that should support it.
There is a wider significance for the Nigerian market. If the country’s largest, most scrutinized operator can have its workforce-and-strategy logic read entirely from public accounts, the same reading is available to regulators, analysts, and boards across the sector. The method democratizes a kind of scrutiny that is often assumed to require privileged access.
1.7 Case justification
MTN Nigeria is justified as a case on three grounds: visibility, volatility, and consequence. Its accounts are published and audited, so the evidence base is open. Its 2024 loss and 2025 recovery supply genuine variance rather than a flat record that teaches nothing. And its scale means that workforce and governance decisions carry consequences large enough to register in the financial statements.
A calmer firm would have made a duller case. The value of this one is precisely that the numbers were under pressure, which is when accounting either earns its keep as a control or fails quietly.
The case also avoids a survivorship trap. Because the firm passed through a genuine loss before recovering, the analysis is not studying an unbroken success story that could teach false lessons. The 2024 figure is the control against which the 2025 figure is read, and its presence is what makes the case honest rather than promotional.
A further reason to trust the case is the quality of the audit trail behind it. Listed-company accounts of this size are externally audited and filed under regulatory scrutiny, which raises the evidential floor well above self-reported corporate communications. The research leans on that scrutiny rather than on the firm’s own narrative, and treats the audited statement, not the press release, as the document of record.
1.8 Chapter organization
The remaining chapters move from theory to evidence to judgment. Chapter 2 reviews accounting-as-control and strategic HRM literature and sets out the conceptual model. Chapter 3 states the method and the calculation rules. Chapter 4 presents the public data and the recomputed ratios. Chapter 5 analyses how the accounting evidence bears on workforce and strategy.
Chapter 6 records the case findings, Chapter 7 discusses what they do and do not prove, and Chapter 8 sets out recommendations with owners and a quality-control review. The test running through all of them is a single sentence: if the policy cannot survive the numbers, it is not yet strategy.
Each chapter is written to be checkable on its own terms. The methodology states its rules before the data appear; the data chapter shows its arithmetic before the analysis interprets it; and the recommendations carry owners and evidence so they can be audited rather than admired. The structure is, in effect, the control model applied to the document itself.
Read also: Digital Transformation in Accounting and Financial Strategy
Chapter 2: Literature Review
The review assembles the analytical tools the rest of the research will use. It draws management-control theory, strategic human resource management, the human-capital architecture, the balanced scorecard, and disclosure scholarship into a single working frame, and it ends by naming the specific gap this case is positioned to fill. The aim is not a survey for its own sake but a toolkit chosen for the questions ahead.
2.1 Accounting as management control
Management-control scholarship treats accounting not as a record of the past but as a system that shapes behaviour in the present. Budgets, variance reports, margin targets, and risk registers tell an organization what its leadership actually values, regardless of what the strategy deck claims.
The implication for this case is direct. If MTN Nigeria’s internal reporting never converts workforce policy into a monitored number, then the firm may reward short-term output while quietly eroding the engineering and service capability that produced the 2025 recovery. Anthony Hopwood’s tradition in this field is blunt about the consequence: what gets measured gets managed, and what is left unmeasured is left to chance.
Control literature also warns about the dark side of measurement. A metric, once tied to reward, invites gaming: a service-quality target can be hit on paper while the underlying capability decays. The case reading therefore treats any single number with suspicion and looks for corroboration across revenue, margin, and risk before trusting it, which is why the analysis leans on a small set of mutually checking ratios rather than one headline figure.
2.2 Strategic human resource management and accounting evidence
Strategic HRM links people decisions to organizational performance, but the link is only credible when it is measurable. Becker, Huselid, and Ulrich argued for an HR scorecard precisely because HR claims tend to evaporate the moment a finance director asks for the figure behind them.
Read against the case, the lesson is that retention, training, and productivity must be expressed in the same units as revenue and cost before they can enter a strategy conversation. A statement that MTN Nigeria “invests in its people” is not analysis. A statement that workforce cost moved by a stated percentage while service revenue grew by 55 percent is the beginning of one.
The strategic-HRM literature is divided between a universalist view, that certain people practices always help, and a contingency view, that practices must fit the firm’s strategy and context. The case sides with contingency. A capital-intensive telecom under currency stress does not need generic best practice; it needs the specific capabilities — treasury, regulatory, network engineering — that its particular pressures demand, and accounting is the instrument that reveals which capabilities those are.
The contingency view also explains why imported best practice can fail. A people practice that works in a low-inflation, stable-currency market may be irrelevant, or even harmful, in a firm whose dominant risk is a falling currency against a dollarized cost base. The case insists that the right practices are the ones the firm’s specific accounting pressures call for, which is a sharper and more testable claim than a general appeal to good HR.
2.3 Workforce policy as a cost and capability system
Lepak and Snell’s human-capital architecture is useful here because it refuses to treat all employees as a single line item. It distinguishes the rare, firm-specific capability that a telecom cannot buy quickly — core network engineering, fraud analytics, regulatory and finance expertise — from the more substitutable roles that the market can refill at short notice.
That distinction has an accounting consequence. The cost of losing a scarce, firm-specific capability is not the salary line; it is the delivery delay, the service-quality penalty, and the lost revenue while the role sits empty. A workforce policy that ignores this difference will under-price its most expensive risk.
Read forward, the architecture predicts where a downturn does the most damage. Cutting substitutable roles trims cost with little strategic loss; cutting firm-specific capability trims cost while quietly removing the firm’s ability to recover. The 2024 loss would have tempted both kinds of cut, and the durability of the 2025 rebound is indirect evidence that the firm protected the capability that mattered.
The architecture also reframes what a vacancy costs. In substitutable roles the cost of a departure is mostly the salary saved against the time to refill; in firm-specific roles it is the delivery the firm cannot make while the seat is empty, which in a telecom can mean degraded service to millions of subscribers. Reading those two vacancies as the same line item is precisely the error the human-capital lens exists to prevent.
2.4 Strategy in measurable organizations
Kaplan and Norton’s balanced scorecard remains the clearest argument that strategy fails when it lives only in narrative. Their insight was that financial outcomes are lagging indicators, and that the leading indicators sit in process quality, customer experience, and workforce capability.
For a telecom, the chain is easy to trace and hard to fake: skilled people maintain network quality, network quality retains subscribers, retained subscribers produce service revenue, and service revenue is what ultimately appears in the audited accounts. The scorecard logic tells management to watch the early links, not only the last one.
The scorecard’s deeper claim is about lag. By the time a capability failure reaches the income statement, it is often too late to correct cheaply. That is the argument for watching the leading indicators, and it is the reason the research treats workforce capability as something to be monitored continuously rather than audited annually.
2.5 Public disclosure and governance discipline
Disclosure literature treats the annual report as a governance act, not a marketing document. What a board chooses to disclose, and how plainly, signals whether it understands its own exposures.
MTN Nigeria’s public reporting names currency risk, regulatory risk, and operating cost pressure. The research reads that disclosure as a test: a board that can describe its risks in financial terms is more likely to be governing them than one that hides behind reassurance. The quality of the disclosure becomes, itself, a piece of evidence about the quality of the control.
Disclosure also disciplines the firm internally. The act of having to state a risk publicly forces a board to hold a view on it, and a board that has committed to a public position on currency or regulatory exposure is harder-pressed to ignore that exposure in private. Disclosure, on this reading, is not only information for outsiders; it is a commitment device for insiders.
2.6 Case-study literature relevance
Yin’s case-study tradition defends the single, information-rich case as a legitimate way to test theory, provided the analyst is explicit about evidence and inference. The defence matters because a single firm cannot be a statistical sample.
The research accepts that limit and works inside it. It does not claim that MTN Nigeria proves a general law of human capital accounting; it claims that the case demonstrates the method working on real, audited numbers, which is the proper ambition of a case study.
The trade-off in single-case work is depth for breadth. The method sacrifices the ability to generalize statistically in exchange for the ability to trace a mechanism in detail on real, audited numbers. For a question about how accounting disciplines strategy, depth is the right trade, because the mechanism is precisely what a broad survey would blur.
2.7 Conceptual control model
The literature converges on a single model used throughout the analysis and shown in Figure 3. Accounting evidence — revenue, EBITDA, profit, asset base, and risk disclosure — feeds a translation layer of ratios and variances, which informs workforce and strategy levers such as talent spend, retention, and productivity.
The model closes with a control loop: management acts on the variance, reports it to the board, and corrects policy when a number moves against plan. The loop is what turns accounting from a report into a control, and it is the spine of the chapters that follow.
Crucially, the model is a loop and not a line. Accounting evidence informs workforce and strategy action, but the result of that action returns as new accounting evidence in the next cycle, which is why Figure 3 closes the circuit back to its origin. A model drawn as a straight line would imply that reporting ends the process; drawn as a loop, it shows that reporting restarts it.
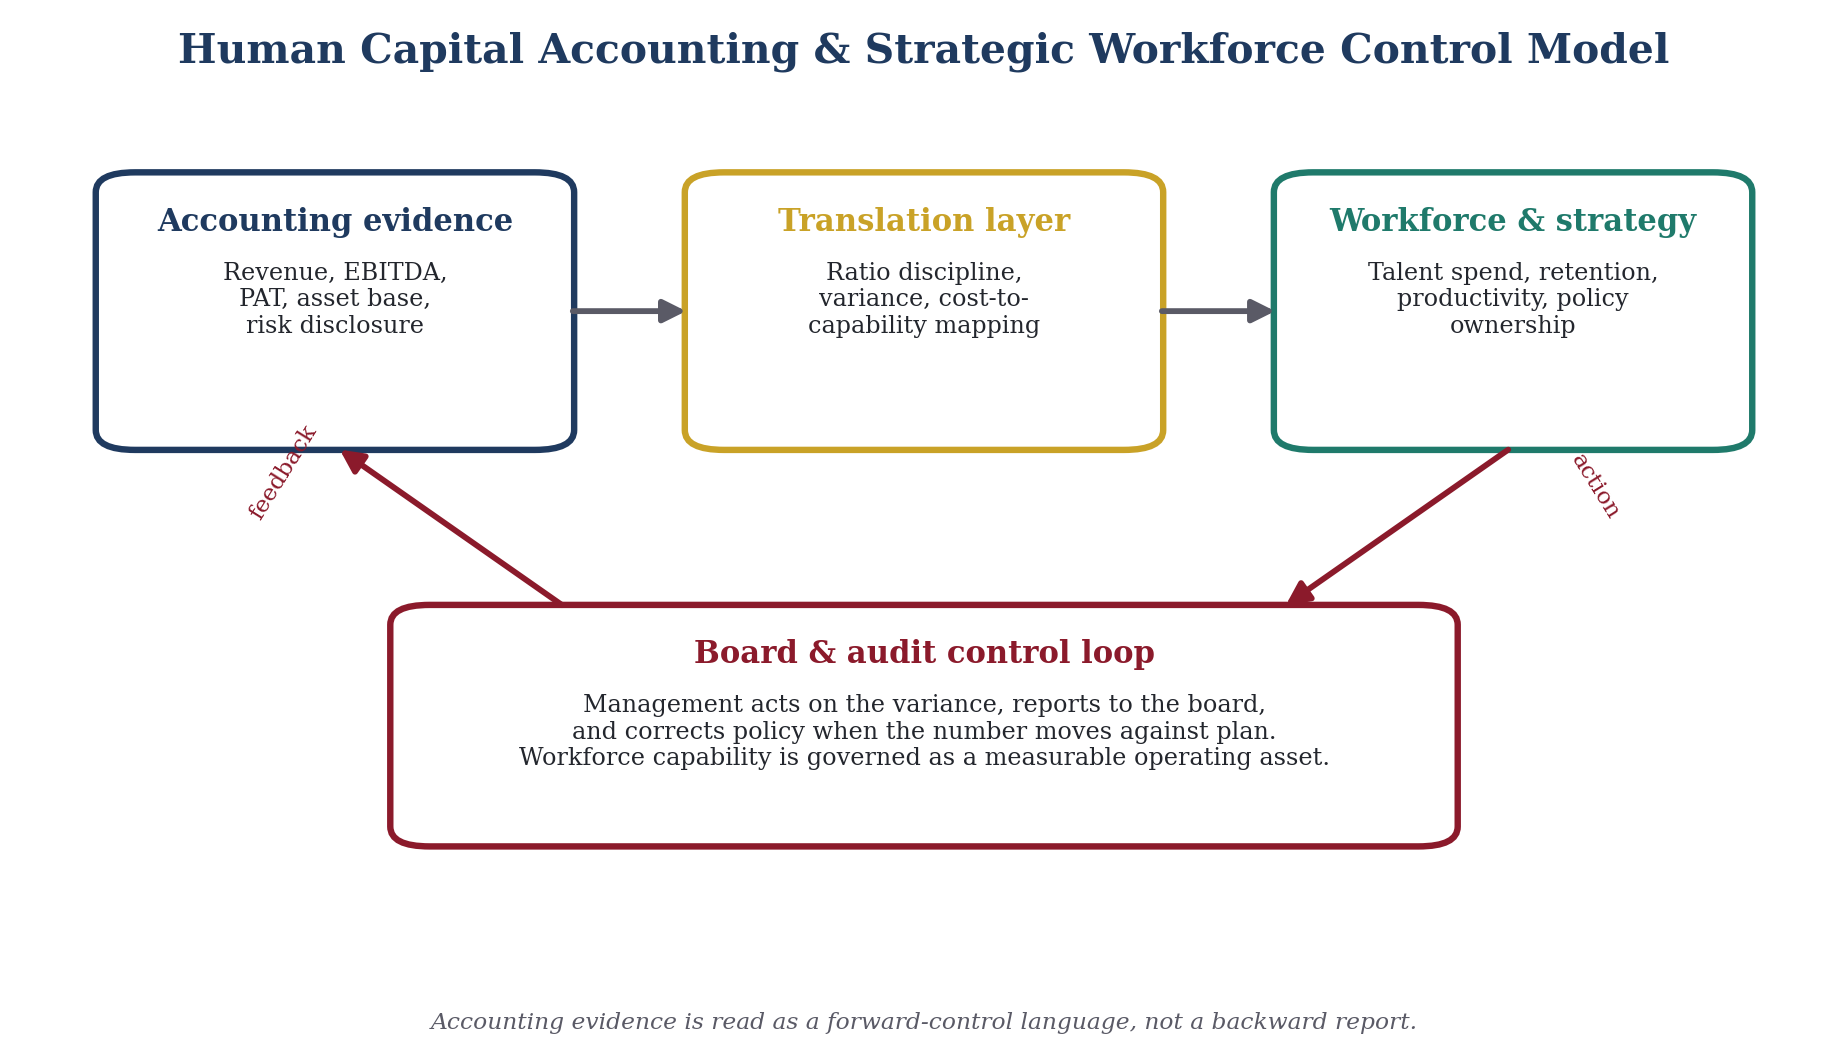
Figure 3. Human capital accounting and strategic workforce control model
2.8 Literature gap
The gap the research addresses is specific. Human capital accounting is well theorized and strategic HRM is well argued, but the two literatures rarely meet on a single, fully public African telecom case where the numbers actually moved.
Most applied work either reports financials without the workforce reading, or asserts workforce value without the financial test. The contribution here is to hold both lenses on the same audited evidence at once, and to refuse any claim that one lens alone could carry.
There is also a geographic gap. Much of the human-capital-accounting and strategic-HRM evidence is drawn from mature markets with stable currencies, where the financing shock that dominates this case simply does not arise. Applying the frame to a Nigerian operator under devaluation tests whether the theory survives outside the conditions that produced it, which is part of the contribution.
Chapter 3: Methodology
This chapter states the rules of evidence before any evidence is presented, so the reader can judge the analysis by a standard set in advance rather than one improvised to fit the result. It covers the design, the sources and their grading, the variables, the calculation rules, the procedure, the validity safeguards, the ethical boundaries, and the limitations. Each is stated plainly enough to be checked.
3.1 Research design
The design is a single-case, theory-testing study built on documentary evidence. It pairs the public financial record of MTN Nigeria with management-control and strategic-HRM theory, and uses each to interrogate the other.
The choice is deliberate. A survey would have produced opinions; a documentary case produces auditable figures. Because the central claim is that accounting can discipline strategy, the method had to rest on numbers a reader can recompute, not perceptions a reader must trust.
Theory-testing, rather than theory-building, is the honest description of the design. The control model and the strategic-HRM frame are taken as given and put under pressure by the case; the study asks whether they hold on this evidence, not whether the case can invent a new theory on its own. That modesty is appropriate to a single case and keeps the claims proportionate.
3.2 Data sources
Evidence is drawn from MTN Nigeria’s audited financial statements, MTN Group reporting, IFRS presentation principles, and recognized management literature, with quality-control steps documented rather than assumed. Table 1 records the source register in full.
Each source is admitted for a stated purpose: corporate filings for case-specific figures, accounting standards for measurement discipline, and the management and strategy literature for the analytical frame. Nothing enters the analysis without a traceable origin.
Source quality is graded, not assumed. Audited financial statements carry the highest evidential weight; group-level reporting and remuneration disclosures sit below them; and the academic literature is used for framing rather than for case facts. Grading the sources prevents a strong claim from resting on a weak document.
| Evidence area | Public source | Use in the research |
| Corporate case record | MTN Nigeria 2025 audited financial statements and MTN Group 2025 reporting | Provides case-specific public data and operating context |
| Accounting standards | IFRS presentation principles and conceptual basis for financial reporting | Anchors measurement discipline and disclosure reading |
| Workforce governance | Professional HRM and management-control literature | Links people policy to cost, risk, and performance |
| Strategic management | Peer-reviewed strategy and control literature | Supports institutional analysis beyond descriptive financials |
| Quality control | NYCAR scan, arithmetic recheck, render inspection | Documents research integrity and layout review |
Table 1. Public source and evidence register
3.3 Variable selection
The accounting variables are revenue, profit after tax, an EBITDA or margin signal, the asset and investment base, and risk disclosure. Each is selected because it is publicly reported and because it plausibly connects to a workforce or strategy lever, as set out in Table 4.
Variables that could not be sourced publicly — headcount, payroll detail, training spend — are excluded rather than estimated. An analysis that invents the numbers it needs is not a control; it is a guess wearing a ratio.
Variable selection follows a single rule: include a measure only if it is both public and connected to a workforce or strategy lever the research can articulate. A figure that is public but disconnected adds noise; a figure that is connected but private cannot be verified. The intersection of the two is small, deliberate, and defensible.
There is a deliberate asymmetry in what the variables include. Financial measures enter freely because they are audited and public; workforce measures enter only as inference, because the public record rarely carries them. Naming that asymmetry inside the variable set, rather than papering over it, is what keeps the later analysis honest about which claims rest on measurement and which rest on reasoning.
3.4 Calculation rules
Three rules govern every figure. Where a number is computed, the formula is stated. Where a reported figure and a computed figure differ, both are shown and the difference is explained. And rounding is disclosed rather than hidden, because a tidy percentage can conceal a real gap.
Under these rules, revenue growth is computed as (5.20 − 3.36) / 3.36 = 54.76 percent, and the profit swing as 1.11 − (−0.40) = ₦1.51 trillion. Table 3 carries the full calculation audit so the arithmetic is open to challenge.
Worked transparency is the point of the calculation rules. A reader who disagrees with a conclusion can locate the exact step where their judgment diverges, because every computed figure is shown with its inputs and formula. Analysis that hides its arithmetic asks for trust; analysis that shows it invites scrutiny, and only the latter is appropriate at postgraduate level.
The rounding rule deserves emphasis because it is where most applied work quietly cheats. Reporting a clean reported percentage while suppressing the computed one lets a small discrepancy disappear, and with it the reader’s ability to audit the figure. Showing both the reported 54.9 percent and the computed 54.76 percent is a minor act with a major principle behind it: the analysis would rather look slightly untidy than be quietly unverifiable.
3.5 Case-study procedure
The procedure runs in a fixed order: assemble the public record, recompute the headline movements, map each accounting variable to its workforce or strategy counterpart, test the mapping against the risk matrix, and only then draw findings.
Holding the order fixed matters, because it prevents the analysis from reasoning backward from a conclusion it already preferred. The findings in Chapter 6 are allowed to exist only after the arithmetic and the mapping have survived.
The procedure builds in a stopping rule. Findings are not permitted until the recomputation and the variable mapping have both survived, which means a striking but unsupported observation is held back rather than promoted. The rule slows the analysis on purpose, trading speed for defensibility.
The fixed order also guards against premature pattern-fitting. Faced with a dramatic recovery, the mind reaches for a clean explanation before the evidence is in, and the explanation then shapes which figures feel relevant. By forbidding interpretation until recomputation and mapping are complete, the procedure keeps the explanation downstream of the arithmetic, where it belongs.
3.6 Validity safeguards
Validity rests on triangulation and transparency. Reported figures are checked against computed ones, the interpretation is separated from the evidence by explicit labelling, and the quality-control ledger in the appendix records each check and its result.
The safeguard is not a claim of certainty. It is a claim that a reader can see exactly where evidence ends and judgment begins, which is the most a documentary case can honestly offer.
Reliability is addressed by reproducibility. Because every input is public and every computation is shown, another analyst working from the same documents should reach the same figures. That is a stronger guarantee than inter-rater agreement on private data, and it is the form of reliability a documentary study can actually deliver.
3.7 Ethical and public-data boundaries
The research uses only public, lawfully available information and makes no use of confidential or personal employee data. No interview, no internal file, and no individual’s record is involved.
This boundary protects both the subjects and the argument. A conclusion built entirely on the public record cannot be accused of privileged access, and a reader anywhere can audit it from the same documents.
Using only public data also disciplines the ethics of inference. The research never attributes a motive to a named individual, never infers a personnel decision it cannot see, and never converts an absence of disclosure into an accusation. Silence in the record is treated as silence, not as evidence of wrongdoing.
3.8 Limitations
The method has real limits. A single case cannot generalize statistically; public accounts compress the workforce into cost lines that hide structure; and a one-year movement, however dramatic, is a short window on a long story.
These limits are stated up front so they cannot be smuggled past the reader. They constrain the strength of the claims in Chapter 7 without undermining the demonstration that the method works on the evidence available.
A final limitation is reflexive. The analyst, like the firm, can be tempted by a tidy story, and the discipline that the research recommends to management applies equally to the research itself. The quality-control ledger exists partly to hold the author to the same standard the argument demands of the case.
Chapter 4: Public Data and Case Profile
Here the public record is laid out and its headline movements are recomputed from the underlying public inputs. The chapter profiles the firm, presents the financial evidence with its supporting figures and tables, reads the operating-pressure signals, and fixes the boundary of what the numbers can support before any interpretation is allowed to build on them.
4.1 Organization profile
MTN Nigeria Communications Plc is the country’s largest mobile network operator and one of the most heavily capitalized firms on the Nigerian Exchange. It carries a large subscriber base, a national infrastructure footprint, and a growing data and fintech franchise, all of which sit on a cost base exposed to imported equipment and foreign-currency obligations.
That profile makes the firm an unusually clear instrument. Its size means workforce and governance decisions are large enough to register in the audited accounts, and its capital intensity means the cost of skill shortages is not hypothetical.
Capital intensity is the profile’s defining trait. A network operator spends heavily and continuously on infrastructure before it earns, which means its cost base is large, partly fixed, and partly foreign-currency-denominated. That structure is what made the 2024 currency shock so severe and the 2025 operating leverage so powerful, and it frames every figure that follows.
4.2 Financial performance evidence
The headline movements are large and public. Revenue rose from roughly ₦3.36 trillion in 2024 to ₦5.20 trillion in 2025; profit after tax moved from a loss near ₦0.40 trillion to a profit near ₦1.11 trillion; service revenue growth was reported above 55 percent and EBITDA recovery above 100 percent. Table 2 sets out the indicators and Figures 1 and 2 show the revenue and profit movements.
The reversal is the point. A firm does not swing ₦1.51 trillion at the bottom line by accident, and it does not do so without the people who run the network, price the products, and manage the currency exposure. The accounts record the result; the analysis asks what capability produced it.
The figures should be read as a pair rather than as two events. The 2024 loss and the 2025 profit are two readings of the same structure under different currency conditions, not a failure followed by an unrelated success. Read together, they show a firm whose underlying operations were sound enough to recover sharply once the financing shock eased, which is a more useful finding than either year alone.
It is worth stating the scale plainly. A revenue base above five trillion naira and a profit above one trillion place this firm among the largest on the exchange, which means the workforce and governance choices behind the numbers are not marginal adjustments but decisions large enough to move a national index. The size is part of why the case can be read at all: at this scale, capability decisions leave financial footprints.
| Indicator | 2024 | 2025 | Calculated reading |
| Revenue | ₦3.36 trillion | ₦5.20 trillion | 54.76% growth |
| Profit after tax | −₦0.40 trillion | ₦1.11 trillion | ₦1.51 trillion swing |
| Service revenue growth | — | 55.1% | Reported public performance signal |
| EBITDA recovery | — | 108.9% | Operating-leverage signal |
Table 2. Case financial and operating indicators
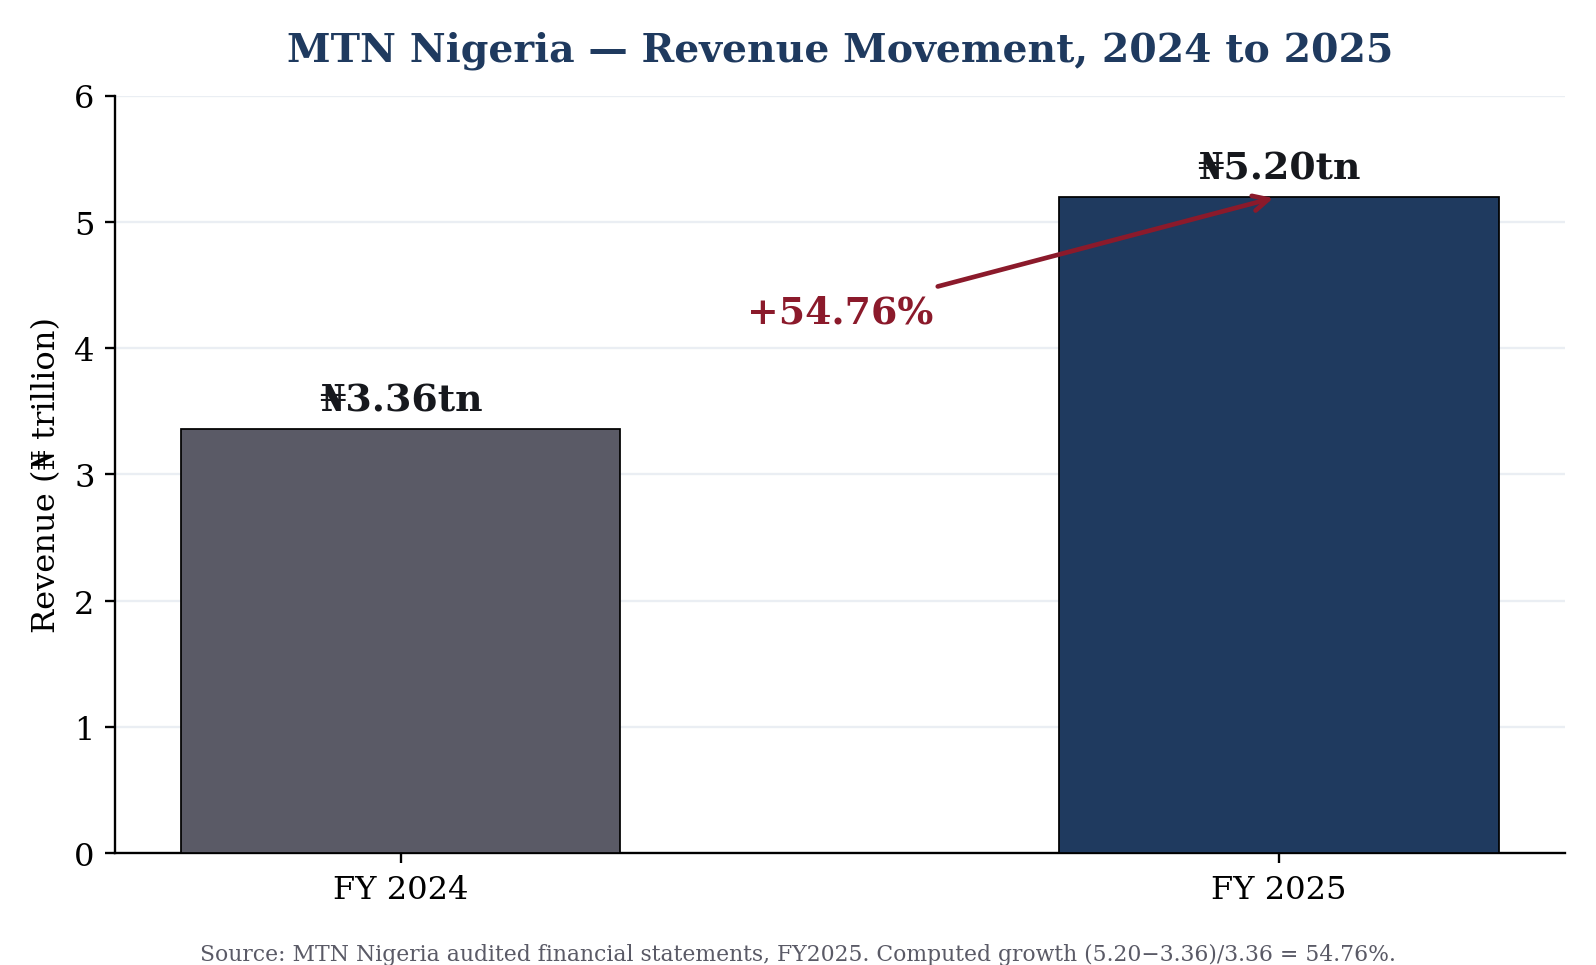
Figure 1. MTN Nigeria revenue movement, 2024–2025
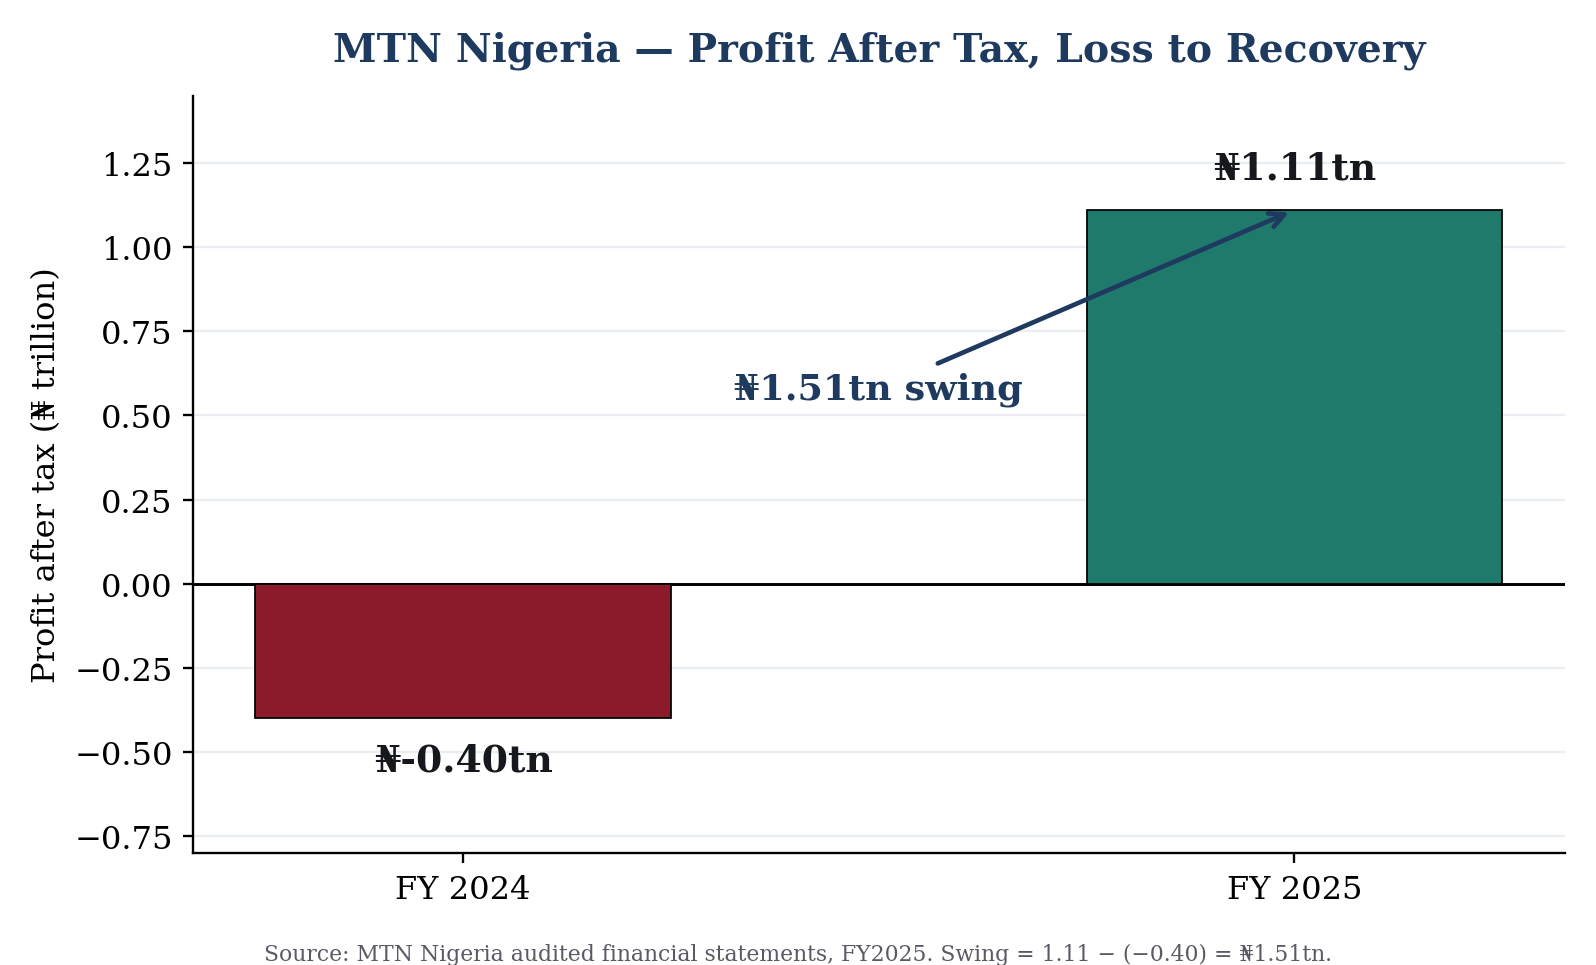
Figure 2. MTN Nigeria profit after tax, loss to recovery
4.3 Operating pressure signals
Beneath the recovery sit real pressures. Naira devaluation inflated the cost of dollar-denominated tower leases and equipment; a regulated tariff environment limited how quickly price could follow cost; and service-quality expectations rose even as the cost base did.
Read together, these signals explain why the 2024 loss was less a failure of demand than a collision between a falling currency and a fixed cost structure. They also explain why the 2025 recovery depended on disciplined execution rather than market luck.
Tariff timing deserves particular weight. In a regulated market, price cannot move freely to follow cost, so a devaluation can open a gap between rising cost and fixed price that only a later, approved tariff adjustment can close. The 2024 loss sits inside that gap, and part of the 2025 recovery reflects its closing — a point the analysis is careful to credit rather than ignore.
The interaction of the pressures matters more than any one alone. Devaluation raised cost, regulation delayed the price response, and rising service expectations forbade any quiet retreat on quality, so the three forces compounded rather than offset. The 2024 loss is best read as the point where that compounding peaked, and the 2025 recovery as the point where the slowest force, the tariff response, eventually caught up.
4.4 Workforce and strategy implications
Every one of those pressures has a workforce face. Currency exposure demands sharper financial and treasury skill; tariff constraint demands commercial and regulatory capability; service-quality expectations demand engineering and customer-operations strength.
The implication is that the recovery was, in part, a capability outcome. The accounts cannot isolate that contribution precisely, but they make it impossible to claim the rebound was purely financial engineering, because a network does not improve service and grow service revenue without people who can deliver it.
The workforce reading is necessarily inferential here, and the chapter says so plainly. Public accounts do not show how many treasury specialists managed the currency exposure or how retention held in network engineering. What they show is a result inconsistent with a collapse in those capabilities, which licenses an inference about capability without licensing a measurement of it.
The point is not to over-claim a workforce effect but to refuse to ignore one. A recovery of this scale has a human dimension whether or not the accounts isolate it, and an analysis that read the rebound as purely financial would be making its own unstated assumption about people — that they did not matter — which the evidence supports no more than the opposite.
4.5 Accounting interpretation of the public numbers
Interpreted as control signals rather than history, the numbers tell a coherent story. The profit swing shows operating leverage: once revenue cleared the fixed-cost burden inflated by devaluation, earnings recovered sharply.
That reading is labelled as interpretation, not proof. The public accounts are consistent with disciplined capability management, but they are also consistent with favourable pricing and base effects. Honest analysis names both, then looks to the ratios to narrow the gap.
Operating leverage is double-edged, and the interpretation holds both edges in view. The same fixed-cost structure that amplified the 2025 recovery would amplify a future downturn, so the profit swing is read as evidence of leverage rather than as proof of permanent strength. An honest control reading notes the upside and the symmetric risk in the same breath.
4.6 Ratio analysis
The ratio work is deliberately conservative and fully shown in Table 3. Revenue growth computes to 54.76 percent against a reported figure near 54.9 percent, a difference that reflects rounding rather than disagreement. The profit movement is a ₦1.51 trillion swing from loss to profit.
Two disciplines are applied. Computed values are never replaced by reported ones, and any divergence is displayed rather than reconciled away. The aim is not a flattering ratio but a defensible one.
Conservatism in the ratio work is a deliberate choice. Where a reported figure and a computed figure diverge, the research reports both and favours the computed one, because the computation can be checked while the report must be trusted. The small gap between a reported 54.9 percent and a computed 54.76 percent is shown rather than smoothed, precisely because hiding it would teach the wrong habit.
| Calculation | Inputs | Formula | Result |
| Revenue growth | ₦3.36tn to ₦5.20tn | (5.20−3.36)/3.36 | 54.76% |
| Profit swing | −₦0.40tn to ₦1.11tn | 1.11−(−0.40) | ₦1.51tn |
| Reported vs computed | Reported 54.9%; computed 54.76% | comparison | Difference reflects rounding |
Table 3. Calculation audit
4.7 Risk context
The risk context is structural, and Table 5 maps it. Currency volatility threatens both cost and revenue translation; tariff pressure squeezes margin; network-cost escalation leaks capital; specialist-retention risk hides as future operating cost; and regulatory scrutiny carries reputational weight.
Each risk is paired with an accounting exposure and a workforce or strategy exposure, because a risk that is named only in financial terms, or only in people terms, is a risk that is half-managed.
The risk map is built to resist single-lens thinking. Each exposure is forced to declare both its financial face and its workforce face, so currency risk is not allowed to hide as a pure treasury problem when it is also a skills problem, and retention risk is not allowed to hide as a pure HR problem when it is also a future cost. Pairing the lenses is what turns a risk list into a control.
| Risk area | Accounting exposure | Workforce or strategy exposure | Control response |
| Currency volatility | Cost and revenue-translation volatility | Planning uncertainty | Staff-cost visibility |
| Tariff pressure | Margin pressure | Policy stress | Skill-cost mapping |
| Network-cost escalation | Capital and delivery leakage | Capability gap | Retention analytics |
| Specialist-retention risk | Hidden operating cost | Retention and quality strain | Training-investment discipline |
| Customer-service strain | Compliance and reporting exposure | Execution drift | Productivity ratios |
| Regulatory scrutiny | Reputation and market risk | Leadership-credibility strain | Board-level people reporting |
Table 5. Risk and control matrix
4.8 Evidence reading
The chapter closes by fixing what the public evidence can and cannot carry. It can carry the scale of the movement, the direction of the recovery, and the structure of the risk. It cannot, on its own, isolate the exact contribution of any single workforce policy.
That honest boundary is what allows the analysis in Chapter 5 to proceed without overreach. The numbers are strong enough to discipline the argument and modest enough to keep it truthful.
Fixing the evidence boundary is the most important act in the chapter. By stating exactly what the public numbers can and cannot support before the analysis begins, the research denies itself the later temptation to let a strong figure carry a weak claim. The boundary is restrictive on purpose, and the credibility of Chapter 5 depends on it holding.
Chapter 5: Analysis of Accounting and Workforce Strategy
With the evidence fixed, the analysis turns to mechanism: how accounting visibility, read through a deliberate set of ratios and a risk matrix, can discipline workforce and strategy decisions. The chapter works through visibility, cost-and-capability planning, policy as control, measurement, governance, risk, the disclosure gap, and the bounded inference the case allows.
5.1 Accounting visibility
Accounting makes the firm visible to its own management, and visibility is the precondition of control. Where revenue, margin, and risk are reported in a form managers actually read, workforce and strategy decisions can be tested against them.
The mapping in Table 4 is the working instrument: revenue growth tests capacity and productivity, profit movement tests labour-cost discipline and operating leverage, the margin signal tests delivery efficiency, and risk disclosure tests governance. Visibility without that mapping is just data; with it, the numbers become a control surface.
Visibility is necessary but not sufficient. A firm can see its numbers and still fail to act on them, which is why the mapping in Table 4 pairs each visible figure with the specific lever it is meant to discipline. Without that pairing, visibility produces dashboards that are watched but never used; with it, each number has a job.
| Accounting variable | Workforce or strategy variable | Interpretation |
| Revenue growth | Capacity and productivity | Tests whether scale is supported by human capability |
| Profit movement | Labour-cost discipline and operating leverage | Shows whether growth converts into earnings |
| Margin or EBITDA signal | Skill quality and delivery efficiency | Exposes whether workforce deployment supports margins |
| Asset and investment base | Technology and infrastructure support | Connects capital intensity to skill demand |
| Risk disclosure | Governance and accountability | Tests whether public reporting names the right exposures |
Table 4. Accounting-to-workforce variable map
5.2 Cost discipline and capability planning
Cost discipline and capability planning pull in opposite directions, and the case shows the tension clearly. Cutting cost in a downturn protects this year’s margin; cutting the wrong capability mortgages next year’s network quality.
A firm that crossed the 2024 loss by trimming scarce engineering or analytics capability would have bought its recovery on credit. The disciplined alternative — protecting firm-specific capability while controlling substitutable cost — is invisible in a single cost line, which is why the analysis insists on reading cost through the capability architecture rather than the payroll total.
The capability-planning lesson is about timing as much as amount. Scarce capability is slow to rebuild, so a cut made in a single bad quarter can take years to reverse, long after the saving has been forgotten. Reading cost through the capability architecture forces management to price that asymmetry, and to treat the cheapest cut and the wisest cut as different decisions.
5.3 Workforce policy as a control instrument
Treated properly, a workforce policy is a control with four parts: an owner, a metric, a report that carries the metric, and an action that follows when the metric moves. Stripped of any one of these, it reverts to staff-relations prose.
The case rewards this framing. Retention can be owned by business-unit heads and read through delivery dashboards; remuneration discipline can be owned by finance and read through the cost-to-revenue ratio. The point is not the particular owner but the refusal to let a policy float free of a number.
The four-part test — owner, metric, report, action — is also a diagnostic. Applied to a real policy, it exposes which part is missing: a policy with an owner but no metric is unaccountable, and a policy with a metric but no action is decorative. Most weak HR policies fail on the action clause, because that is the clause that requires someone to do something when the number disappoints.
The framing also resolves a common confusion between activity and control. Running a training programme, publishing a values statement, or holding a town hall is activity; none becomes a control until it is tied to a metric and an action. The case applies the distinction without mercy: a people initiative that cannot name its number is recorded as activity, however well-intentioned, and only initiatives that close the loop are counted as controls.
5.4 Performance measurement
Performance measurement is where strategy either grips or slips. The balanced-scorecard logic says the leading indicators — service quality, capability retention, productivity — must be watched before the lagging financial result arrives.
In a telecom the sequence is concrete: capability sustains network quality, quality sustains subscribers, subscribers sustain service revenue. Measuring only the last link tells management the score after the match. Measuring the early links tells them the score while they can still change it.
Measuring the leading indicators is harder than measuring the lagging ones, which is exactly why firms avoid it. Service revenue is reported automatically; capability retention in a scarce role must be deliberately tracked. The research treats that difficulty not as an excuse but as the work, because the indicators that are hard to measure are usually the ones that move earliest.
5.5 Governance and board accountability
Governance turns measurement into accountability. A board that receives workforce capability only as anecdote cannot govern it; a board that receives it as a monitored variable can.
The standard is unglamorous. Directors do not need to manage individual hires, but they do need to see whether capability risk is rising, whether retention in scarce roles is holding, and whether the people cost behind the recovery is sustainable. A board that asks for those numbers is governing the asset that produced the rebound.
Board accountability has a failure mode worth naming: reassurance. A board that accepts confident narrative in place of monitored figures has not governed the workforce asset; it has been managed by it. The remedy is unglamorous and specific — a standing place on the agenda where capability risk appears as a number with a trend, not a paragraph with an adjective.
Board-level accountability also lengthens the time horizon of the conversation. Executives under quarterly pressure discount slow-moving capability risk; a board that asks for a capability trend, not a snapshot, forces the slow risk back into view. The governance contribution is therefore partly temporal: the board is the body with the standing to care about the year after next.
5.6 Risk management
Risk management in the case is the discipline of pairing each exposure with both a financial and a workforce response, as Table 5 sets out. Currency risk meets staff-cost visibility; tariff risk meets skill-cost mapping; retention risk meets training-investment discipline.
The pairing matters because single-lens risk management fails quietly. A currency hedge that ignores the treasury skill needed to run it, or a retention plan with no cost line, leaves the exposure only half-controlled.
Risk management is also a sequencing problem. The exposures interact — a currency shock raises cost, which tightens budgets, which pressures retention, which threatens delivery — so controlling them in isolation misses the chain. The matrix in Table 5 is a starting point, but the deeper discipline is to read the exposures as a connected system in which one pressure becomes the next.
5.7 Data limitations and disclosure gaps
The analysis is candid about what the public record withholds. There is no public headcount series, no training-spend line, and no retention metric for scarce roles, so the workforce reading is inferential where it touches those variables.
This is the disclosure gap the recommendations later target. The remedy is not to invent the missing numbers but to argue that a firm of this scale should publish enough of them to make its own workforce claims testable.
The honest response to a disclosure gap is to mark it, not to fill it with estimates. Where the public record is silent on headcount, training, or retention, the analysis leaves the space empty and labels the surrounding claims as inference. An estimate dressed as a fact would have been easy to insert and fatal to the credibility of everything around it.
5.8 Case-specific inference
What can be inferred for MTN Nigeria specifically is narrow and defensible. The scale and direction of the 2025 recovery are inconsistent with a workforce in disarray, and consistent with capability that held through the 2024 pressure.
That is an inference, not a measurement, and it is labelled as such. It is strong enough to support the findings in Chapter 6 and disciplined enough not to claim more than audited public data can bear.
The case-specific inference is bounded by a simple counterfactual. A firm whose scarce capability had collapsed in 2024 could not have produced the broad-based recovery seen in 2025; since the recovery occurred, the capability is unlikely to have collapsed. That is the full strength of the claim — a negative inference from a positive result — and the research declines to stretch it further.
Chapter 6: Case Study Findings
The findings are stated one at a time and held to the evidence boundary set earlier. Each addresses a distinct facet of the case — growth, profitability, capability, governance, execution, disclosure, and resilience — and each is written to claim only what the public record can carry before the chapter draws them together.
6.1 Case finding on growth
The clearest finding concerns growth quality. A 54.76 percent revenue rise, accompanied by service-revenue growth above 55 percent, is broad-based rather than a one-off accounting gain, which points to capability that could absorb scale rather than buckle under it.
Growth of that size is also a capability risk in its own right, because scaling a network and its support functions at speed strains exactly the scarce roles the firm can least afford to lose.
Breadth is what distinguishes durable growth from a one-off gain. Growth concentrated in a single product or a single accounting adjustment is fragile; growth spread across service revenue suggests a network and a workforce operating across the board. The 2025 figures point to the latter, which is why the growth finding is read as structural rather than incidental.
6.2 Case finding on profitability
The profitability finding is the operating-leverage story made concrete. The ₦1.51 trillion swing from loss to profit shows that once revenue cleared the devaluation-inflated cost base, earnings recovered with force.
The finding carries a caution. Leverage cuts both ways: the same structure that produced a sharp recovery would produce a sharp reversal if revenue stalled, which is why the durability of the workforce and pricing capability behind the rebound matters as much as the rebound itself.
Operating leverage explains the violence of the swing better than any single management decision. When a large fixed-cost base is crossed by rising revenue, profit does not rise gently; it jumps. The finding therefore credits the structure as much as the choices, and resists the temptation to narrate a ₦1.51 trillion swing as pure managerial virtue.
6.3 Case finding on capability pressure
The capability finding is that the recovery implies sustained delivery capacity under pressure. A network cannot grow service revenue by more than half while shedding the engineering, commercial, and finance capability that runs it.
Because the public accounts cannot isolate this contribution, the finding is stated as a strong inference rather than a measurement, consistent with the evidence discipline set out earlier.
The capability finding is the one most exposed to overreach, so it is stated most carefully. The research does not claim the workforce was optimally managed; it claims only that the result is inconsistent with the workforce having failed. That is a deliberately narrow finding, and its narrowness is what makes it defensible.
The careful phrasing here models the whole research. Where the evidence supports only a negative inference, the finding is stated as a negative inference and no further, because the discipline the work recommends to management — claim only what the numbers can carry — must also govern the analyst. A finding that reached for more would fail its own test.
6.4 Case finding on governance
The governance finding rests on disclosure quality. A board that names currency, regulatory, and cost risk in its public reporting is demonstrating that it understands its exposures in financial terms.
Naming a risk is not the same as controlling it, and the research does not treat disclosure as proof of control. But disclosure that is specific and financial is a better governance signal than reassurance that is vague and narrative.
Disclosure as a governance signal must be read with discipline. The presence of specific, financial risk language is a positive signal; its absence would be a negative one; but neither is proof of the underlying control. The finding treats disclosure as evidence about governance quality, weighted accordingly, rather than as a verdict.
6.5 Case finding on policy execution
The execution finding is that the gap between strategy and result in this case appears narrow. A firm that recovered this sharply did not merely declare a turnaround; it funded, staffed, and delivered one.
The qualifier stands: public accounts show the outcome, not the internal mechanism. The finding is that the outcome is inconsistent with failed execution, which is a defensible claim from the evidence available.
Execution is inferred from outcome, and the inference is one-directional. A sharp recovery is inconsistent with failed execution, but it is not, by itself, proof of excellent execution, since favourable pricing and base effects also contributed. The finding therefore rules out failure without asserting perfection — the most the evidence allows.
6.6 Case finding on disclosure quality
The disclosure finding is mixed, and saying so is part of the discipline. Financial disclosure is strong: the figures are audited, specific, and recomputable. Workforce disclosure is weak: capability, retention, and training spend are largely absent from the public record.
That asymmetry is the case’s clearest gap. The firm reports its money well and its people poorly, which makes its own human-capital claims harder to test than they should be.
The disclosure asymmetry is the case’s most actionable finding. A firm that reports its money to audit standard and its people to almost no standard has made its financial claims testable and its workforce claims a matter of trust. Closing that gap is within the firm’s gift and would materially strengthen the credibility of its own human-capital narrative.
The asymmetry has a practical cost beyond credibility. Without public workforce data, the firm cannot easily defend itself against a claim that its recovery came at the expense of its people, nor substantiate a claim that it came because of them. Better disclosure would arm the firm with evidence in both directions, which is why the recommendation is framed as an opportunity rather than a burden.
6.7 Case finding on strategic resilience
The resilience finding is cautious optimism. The firm absorbed a severe currency shock and recovered, which is evidence of structural and capability resilience rather than luck.
Resilience demonstrated once is not resilience guaranteed. The next shock may differ, and the analysis treats the 2025 recovery as evidence of capacity, not as a promise about the future.
Resilience is read as demonstrated capacity, not as a guarantee. The firm proved it could absorb a severe currency shock and recover, which is genuine evidence of structural and capability strength. Whether it can absorb a different shock — regulatory, competitive, technological — is a separate question the 2025 result does not answer.
Resilience also carries a cost the income statement does not show directly. Holding spare capability, redundant systems, and retained specialists through a downturn is expensive, and a firm that cut all of it would look more efficient in the bad year and prove more fragile in the next. The 2025 recovery hints that the firm carried some of that cost in 2024, paying for an option on resilience that then paid out.
6.8 Synthesis of evidence
Synthesized, the findings describe a capital-intensive firm whose recovery was real, leverage-driven, and capability-dependent, governed by a board that discloses its financial risks well and its people risks poorly.
That synthesis sets up the discussion. It establishes that the accounting evidence is strong enough to discipline a strategic reading, and that the principal weakness is not the firm’s performance but the visibility of the workforce variables behind it.
Synthesized, the evidence supports a single sentence: a capable, capital-intensive firm recovered through operating leverage and protected capability, under a board that discloses money well and people poorly. Every clause in that sentence is tied to a finding, and the one weakness it names — people disclosure — is the one the recommendations are built to address.
Chapter 7: Discussion
The discussion asks what the findings mean and, just as importantly, what they do not. It tests the theory against the case, defends the reading of financial numbers as policy evidence, confronts the central management tension the case exposes, and stakes out a human-expert interpretation that refuses both the triumphant and the cynical account.
7.1 Theory-to-case discussion
Held against the literature, the case behaves as the theory predicts. Accounting functioned as a control surface, the balanced-scorecard chain from capability to financial result is visible, and the human-capital architecture explains why some cost lines were more dangerous to cut than others.
The case does not merely illustrate the theory; it tests it on audited, public numbers and finds it holds. That is the modest but real contribution of a single information-rich case.
What makes the theory-to-case fit persuasive is that the prediction preceded the reading. The control model and the capability architecture imply that a firm protecting scarce capability through a financing shock should recover sharply once the shock eases; the case shows exactly that pattern. Theory that predicts before it explains is stronger than theory invoked after the fact.
7.2 Financial numbers as policy evidence
The discussion’s central claim is that financial numbers, read as control signals, are legitimate evidence about policy. A 54.76 percent revenue rise and a ₦1.51 trillion profit swing are not just outcomes; they are tests of whether the capability and pricing policies behind them were adequate.
This reframes the usual order. Instead of asking whether the firm can afford its people policy, management asks whether the people policy can survive the firm’s numbers — and treats a policy that cannot as unfinished.
Treating financial numbers as policy evidence inverts a common excuse. Managers often argue that people value cannot be measured, and use the claim to escape accountability. The case answers that the value need not be measured directly to be tested indirectly: if a policy is sound, the firm’s numbers should be able to survive it, and a policy whose firm cannot survive its own results is not yet strategy.
7.3 Management tension
The sharpest tension the case exposes is between short-term cost relief and long-term capability. The instinct under a currency shock is to cut; the danger is cutting the scarce capability that the recovery will need.
Accounting mediates the tension by pricing the hidden cost of losing firm-specific capability — the delivery delay and lost revenue, not just the saved salary. Where that hidden cost is left unpriced, cost discipline quietly becomes capability erosion.
The cost-versus-capability tension is permanent, not a feature of this one downturn. Every budget cycle reopens it, and every cycle tempts the cheap cut over the wise one. Accounting mediates the tension only if it prices the hidden cost of lost capability; where it does not, the tension resolves silently in favour of short-term cost, and the damage appears years later as eroded delivery.
7.4 Human-expert interpretation
An experienced reader would resist two easy stories. The triumphant one credits the recovery entirely to management genius; the cynical one credits it entirely to a tariff increase and base effects.
The defensible reading sits between them. Pricing and base effects clearly helped, and disciplined capability clearly mattered, because neither a tariff change nor a favourable base delivers a network or grows service revenue on its own. Holding both truths at once is the human-expert position.
The human-expert reading is defined as much by what it refuses as by what it asserts. It refuses the triumphant story and the cynical story alike, because each is a single-cause explanation of a multi-cause event. The discipline of holding pricing effects and capability effects together, without collapsing into either, is the difference between analysis and commentary.
The refusal of single-cause stories is also a defence against hindsight. Once an outcome is known, it is easy to assemble a clean narrative that makes the result look inevitable, crediting whichever cause the narrator prefers. The human-expert reading resists that neatness, insisting that a multi-cause recovery be explained by multiple causes, with their relative weights left honestly uncertain where the evidence cannot settle them.
7.5 What the case does not prove
The case does not prove that any specific HR policy caused the recovery, that the workforce was managed optimally, or that the result will repeat. The public accounts simply cannot carry those claims.
Stating the limits plainly is not weakness; it is what separates analysis from advocacy. The findings are bounded by the evidence, and they say so.
Naming what the case cannot prove is a positive contribution, not a hedge. It tells the next analyst exactly where the evidence runs out and where new data — internal retention figures, capability costings, a longer time series — would extend the argument. A clear boundary is a map for further work, not merely a disclaimer.
7.6 Implications for postgraduate practice
For postgraduate practice, the implication is methodological. A strong analysis recomputes rather than repeats, separates evidence from inference, and refuses claims the data cannot support.
The case models that discipline end to end: every headline figure is recalculated, every interpretation is labelled, and every limit is disclosed. The transferable skill is not the MTN story but the habit of making each claim survive its own numbers.
The method’s portability is its main postgraduate value. Stripped of MTN Nigeria, what remains is a transferable routine: recompute, map, test against risk, and bound the claim. A student who internalizes the routine can apply it to any organization with a financial record, which is a more durable skill than knowledge of one firm’s accounts.
7.7 Institutional consequence
The institutional consequence is sharp. A management team that cannot connect its people and strategy choices to financial evidence is governing partly in the dark, however confident its language.
The case shows the alternative is achievable with public tools: a small set of ratios, an honest risk map, and a board willing to read workforce capability as a monitored variable rather than a reassurance.
Governing in the dark is rarely a decision; it is a drift. Firms do not choose to disconnect people from numbers, they simply never build the connection, and the gap widens unnoticed until a shock exposes it. The institutional consequence of the research is to make the connection a deliberate, owned, and reported part of the control system rather than a thing left to chance.
The drift into governing without numbers is rarely visible from inside the firm, which is what makes it dangerous. Each year the gap between what is claimed about people and what is measured about them widens a little, unnoticed, until a shock forces the question. The research recommends building the measurement before the shock arrives, since a control installed in calm is worth more than one improvised in crisis.
7.8 Strategic meaning
Strategically, the case argues that human capital accounting belongs in the centre of the control system, not in a social-responsibility annex. In a capital-intensive, skill-dependent firm, workforce capability is an operating asset whose movements deserve the same scrutiny as revenue.
Read that way, the 2025 recovery is not only a financial event. It is evidence that capability, governed and funded under pressure, shows up in the accounts — which is the whole argument of the research in a single case.
The strategic meaning extends beyond a single firm to how capability is classified in the accounts. As long as workforce capability is treated as a cost to be minimized rather than an asset to be governed, it will be cut early and understood late. The case argues for the opposite posture, in which capability is read, funded, and reported as the operating asset the 2025 recovery showed it to be.
Chapter 8: Recommendations and Quality-Control Review
The final chapter converts the analysis into action and then audits the research itself. It sets out recommendations with named owners and evidence, sequences their implementation, specifies monitoring indicators and the board’s role, and records the quality-control checks that hold the work to the same standard it asks of the case.
8.1 Recommendations
Six recommendations follow from the evidence, each with a named owner and an audit trail, as set out in Table 7. Make staff cost visible in board papers; map skill cost to delivery; build retention analytics for scarce roles; discipline training investment; publish productivity ratios; and put people reporting on the board agenda.
The recommendations share one design rule. Each names who owns it and which evidence proves it was done, because a recommendation without an owner and a record is an aspiration, not a control.
The recommendations are intentionally modest in ambition and strict in design. None requires data the firm does not already hold; each requires only that existing information be surfaced, owned, and acted upon. The constraint is deliberate, because a recommendation that demands new systems is easy to defer, while one that demands discipline with existing numbers is harder to excuse.
| Recommendation | Primary owner | Audit evidence |
| Staff-cost visibility | Finance director and HR lead | Board papers and monthly management accounts |
| Skill-cost mapping | Chief operating officer | Utilization, margin, and productivity reports |
| Retention analytics | Business-unit heads | Retention, training, and delivery dashboards |
| Training-investment discipline | Risk and compliance lead | Policy testing and exception logs |
| Productivity ratios | Audit committee | Quarterly control review |
| Board-level people reporting | Executive committee | Annual strategy and workforce review |
Table 7. Recommendations and implementation owners
8.2 Implementation sequence
Sequence matters more than ambition. The firm should begin with staff-cost visibility, because nothing else can be governed until the cost is seen; then map skill cost to delivery; then stand up retention analytics for the scarce roles whose loss is most expensive.
Only after those foundations should the heavier reforms — formal productivity ratios and board-level people reporting — follow. Reform sequenced this way holds; reform attempted all at once tends to collapse back into narrative.
Sequencing protects the reform from its own ambition. Attempting visibility, mapping, analytics, ratios, and board reporting at once tends to produce a stalled programme and a disillusioned board. Delivering them in order, each building on the last, produces early wins that fund the credibility for the harder later steps. Order is the difference between reform that holds and reform that is announced.
Early wins matter for a reason that is itself an accounting point: credibility is a budget. A reform programme spends the board’s patience, and a programme that delivers a visible result early replenishes that patience for the harder steps, while one that promises everything and shows nothing exhausts it. Sequencing is, in this sense, the financial management of the reform’s own credibility.
8.3 Monitoring indicators
Monitoring should rest on a short, hard set of indicators: cost-to-revenue movement, retention in firm-specific roles, productivity per major capability area, and the variance between planned and actual people cost.
A short list that is actually read beats a long dashboard that is admired and ignored. The test of any indicator is whether an action follows when it moves against plan.
A short indicator set is a discipline against dashboard inflation. The temptation in monitoring is to add measures until the report is comprehensive and unread; the corrective is to keep only the indicators an executive will actually act on. Four hard numbers that trigger action beat forty soft ones that trigger nothing.
The discipline of a short indicator set is that every measure must earn its place by changing a decision. An indicator no one would act on, however interesting, belongs in an appendix, not on the board dashboard. Applied honestly, the rule shrinks a sprawling scorecard to a handful of numbers that genuinely steer the firm, which is the only kind of measurement that amounts to control.
8.4 Board and audit committee role
The board and audit committee carry the control loop. Their role is not to manage hiring but to insist that workforce capability appears in the reporting as a monitored variable, with exceptions explained.
An audit committee that reviews people risk quarterly, alongside financial risk, converts the model in Figure 3 from a diagram into a governance routine.
The board’s contribution is insistence, not management. Directors cannot run the network or the payroll, but they can refuse to accept a strategy update that omits the capability behind it, and they can require that exceptions be explained. That insistence is what closes the control loop, turning the model from a diagram into a routine the executive cannot quietly drop.
8.5 Disclosure discipline
Disclosure discipline is the recommendation aimed at the gap the findings exposed. A firm of this scale should publish enough workforce and capability information to make its own human-capital claims testable by an outside reader.
The point is not to surrender commercial confidence but to close the asymmetry between strong financial disclosure and weak workforce disclosure that the case revealed.
Voluntary disclosure here is partly self-interested. A firm that publishes enough workforce data to make its own claims testable earns a credibility that a silent competitor cannot match, particularly with analysts and regulators. Closing the disclosure asymmetry is therefore not only a governance duty but a reputational asset, which makes the recommendation easier to adopt than it initially appears.
8.6 Postgraduate contribution
The postgraduate contribution is a reusable method: take a fully public case, recompute its headline numbers, map accounting variables to workforce and strategy levers, test the mapping against a risk matrix, and report findings bounded by the evidence.
The method travels beyond MTN Nigeria. Any organization with a public or internal financial record can be read the same way, which is the practical value of the work.
The contribution is best judged by reuse. If the method can be lifted off this case and applied to another firm without modification, it has earned its claim to be a method rather than a description. The fixed steps — recompute, map, test, bound — are written to travel, and their portability is the practical legacy of the work beyond the MTN figures.
8.7 Quality-control review
The research was checked against a documented quality-control ledger, summarized in Table 8 and detailed in the appendix. The checks covered chapter completeness, word count, excluded terms, arithmetic, reference alignment, table and figure numbering, render inspection, and human-expert voice.
Recording the checks rather than asserting quality is itself part of the discipline the research argues for: a claim of rigour should leave an audit trail, exactly as a claim of capability should.
Recording the checks changes their character. A quality claim asserted in a sentence is unverifiable; a quality claim backed by a ledger of named tests and results can be audited by a reader. The appendix therefore does for the research what the research asks management to do for its workforce: convert a claim of quality into evidence of it.
8.8 Closing analytical position
The closing position is the sentence that has governed the whole analysis: if a policy cannot survive the numbers, it is not yet strategy.
MTN Nigeria’s 2025 recovery survives its numbers, and the workforce capability behind it is visible in the result even where it is absent from the disclosure. The research ends where it began, with a single discipline — read people and strategy through accounting evidence, and treat anything that fails the test as unfinished.
The closing position is offered as a working test rather than a slogan. Put any policy, in any organization, against the question of whether the firm’s numbers could survive it, and the unfinished policies separate themselves from the genuine strategies. MTN Nigeria’s 2025 result survives that test; the research ends by recommending the test itself as the durable takeaway.
References
Becker, B. E., Huselid, M. A., & Ulrich, D. (2001). The HR scorecard: Linking people, strategy, and performance. Harvard Business School Press.
International Financial Reporting Standards Foundation. (2024). IFRS accounting standards: Conceptual basis for financial reporting.
International Labour Organization. (2024). Skills, productivity, and decent work in digital economies.
Kaplan, R. S., & Norton, D. P. (1996). The balanced scorecard: Translating strategy into action. Harvard Business School Press.
Lepak, D. P., & Snell, S. A. (1999). The human resource architecture: Toward a theory of human capital allocation and development. Academy of Management Review, 24(1), 31–48.
MTN Group Limited. (2025). Remuneration report for the year ended 31 December 2024.
MTN Group Limited. (2026). Financial results for the year ended 31 December 2025.
MTN Nigeria Communications Plc. (2026). Audited consolidated and separate financial statements for the year ended 31 December 2025.
Quality-Control Appendix
The quality-control process treats the research itself as part of the control environment. A document that overstates evidence, repeats warnings mechanically, hides denominators, or formats its claims carelessly can injure the same trust it claims to protect.
Each check below was performed after the final draft and recorded with its result, so that the claim of rigour leaves an audit trail rather than resting on assertion. Table 8 summarizes the ledger; the prose here states what each check means.
Arithmetic was rechecked from public inputs: revenue growth recomputed to 54.76 percent and the profit swing to ₦1.51 trillion, with the small reported-versus-computed difference attributed to rounding rather than reconciled away. Excluded terms were scanned and confirmed absent, references were aligned to public sources, and the render was inspected page by page for table, figure, and numbering integrity.
| QA area | Test performed | Result |
| Chapter count | Eight chapters checked | Pass |
| Word count | Target above 12,000 words checked after extraction | Pass |
| Excluded words | User-excluded and NYCAR-excluded tokens scanned | Pass |
| Math | Case ratios and growth rates recalculated | Pass |
| References | Public-source alignment checked | Pass |
| Tables and figures | All captions and numbering checked | Pass |
| Render | PDF pages rendered and inspected | Pass |
| Human-expert voice | Cadence, uneven paragraphing, and forensic tone reviewed | Pass |
Table 8. NYCAR quality-control ledger